| Param | Original file | Final file |
|---|---|---|
| Filename | modeM0/AS1A02_199T01_9000000800_06150cztM0_level2.evt | modeM0/AS1A02_199T01_9000000800_06150cztM0_level2_quad_clean.evt |
| Size (bytes) | 398,220,480 | 95,253,120 |
| Size | 379.8 MB | 90.8 MB |
| Events in quadrant A | 2,811,720 | 635,736 |
| Events in quadrant B | 3,249,137 | 636,110 |
| Events in quadrant C | 2,651,041 | 619,603 |
| Events in quadrant D | 2,954,692 | 588,944 |
| Mode SS | |||
|---|---|---|---|
| Quadrant | BADHDUFLAG | Total packets | Discarded packets |
| A | 0 | 116 | 0 |
| B | 0 | 116 | 0 |
| C | 0 | 116 | 0 |
| D | 0 | 116 | 0 |
| Mode M9 | |||
|---|---|---|---|
| Quadrant | BADHDUFLAG | Total packets | Discarded packets |
| A | 0 | 13 | 0 |
| B | 0 | 13 | 0 |
| C | 0 | 13 | 0 |
| D | 0 | 13 | 0 |
| Mode M0 | |||
|---|---|---|---|
| Quadrant | BADHDUFLAG | Total packets | Discarded packets |
| A | 0 | 12192 | 2 |
| B | 0 | 13496 | 1 |
| C | 0 | 11854 | 1 |
| D | 0 | 12720 | 1 |
| Quadrant | Total seconds | Saturated seconds | Saturation percentage |
|---|---|---|---|
| A | 5789 | 77 | 1.330109% |
| B | 5789 | 101 | 1.744688% |
| C | 5789 | 48 | 0.829159% |
| D | 5789 | 143 | 2.470202% |
Noise dominated data is calculated using 1-second bins in cleaned event files. If a bin has >2000 counts, and if more than 50% of those come from <1% of pixels, then it is considered to be noise-dominated and hence unusable.
| Quadrant | # 1 sec bins | Bins with >0 counts | Bins with >2000 counts | High rate bins dominated by noise | Noise dominated (total time) | Noise dominated (detector-on time) | Marked lightcurve |
|---|---|---|---|---|---|---|---|
| A | 7059 | 5789 | 13 | 13 | 0.18% | 0.22% | 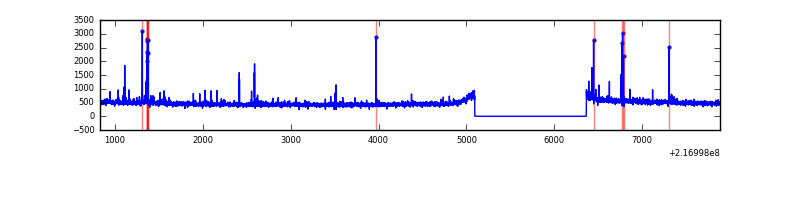 |
| B | 7059 | 5790 | 38 | 38 | 0.54% | 0.66% | 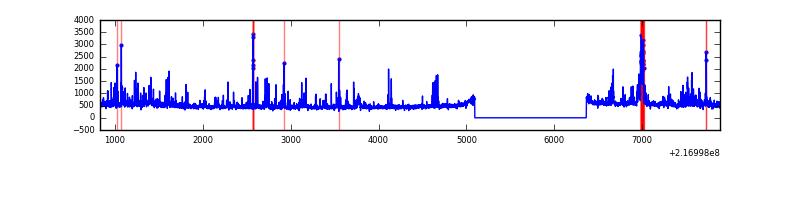 |
| C | 7059 | 5790 | 0 | 0 | 0.00% | 0.00% | 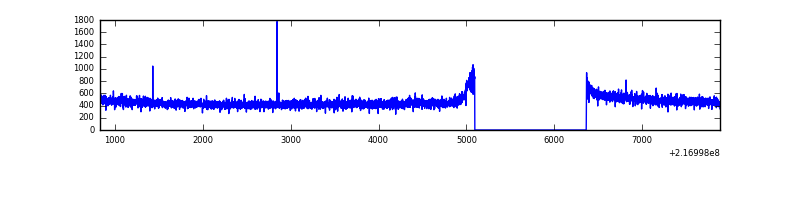 |
| D | 7059 | 5790 | 79 | 79 | 1.12% | 1.36% | 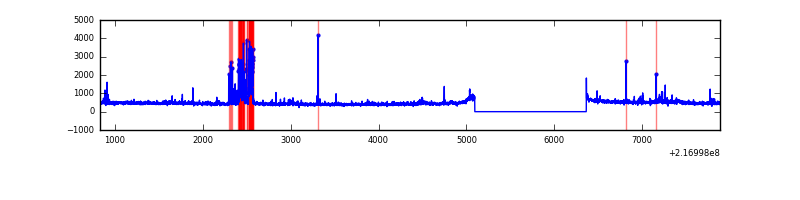 |
Top three noisy pixels from each quadrant. If the there are fewer than three noisy pixels in the level2.evt file, extra rows are filled as -1
| Pixel properties | Quadrant properties | ||||||
|---|---|---|---|---|---|---|---|
| Quadrant | DetID | PixID | Counts | Sigma | Mean | Median | Sigma |
| A | 8 | 15 | 123042 | 874.7 | 690 | 677 | 139.9 |
| A | 14 | 111 | 24719 | 171.86 | 690 | 677 | 139.9 |
| A | 0 | 31 | 7513 | 48.87 | 690 | 677 | 139.9 |
| B | 3 | 64 | 344326 | 2683.75 | 685 | 670 | 128.1 |
| B | 0 | 219 | 81770 | 633.34 | 685 | 670 | 128.1 |
| B | 0 | 214 | 76086 | 588.95 | 685 | 670 | 128.1 |
| C | 1 | 16 | 12121 | 74.22 | 673 | 675 | 154.2 |
| C | 4 | 222 | 7528 | 44.44 | 673 | 675 | 154.2 |
| C | 13 | 61 | 5363 | 30.4 | 673 | 675 | 154.2 |
| D | 13 | 169 | 306953 | 1880.87 | 671 | 650 | 162.9 |
| D | 5 | 97 | 35964 | 216.85 | 671 | 650 | 162.9 |
| D | 8 | 195 | 25774 | 154.28 | 671 | 650 | 162.9 |
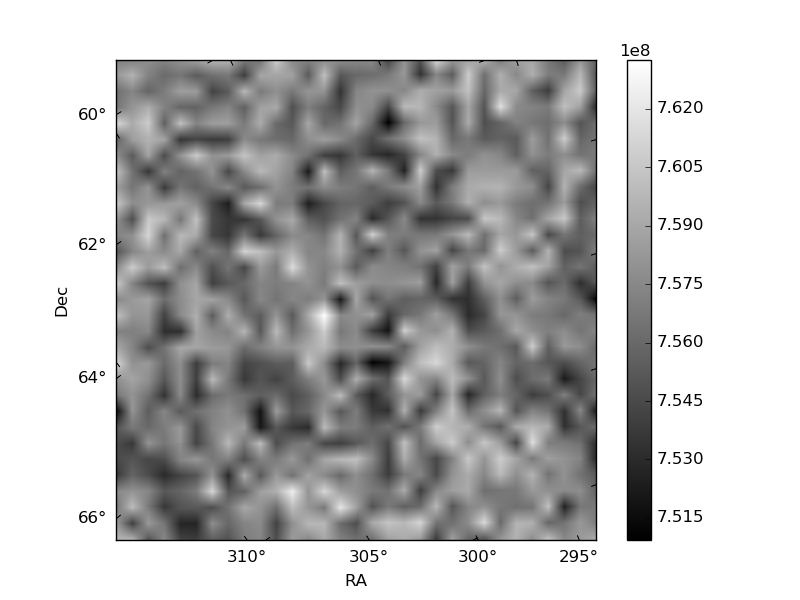
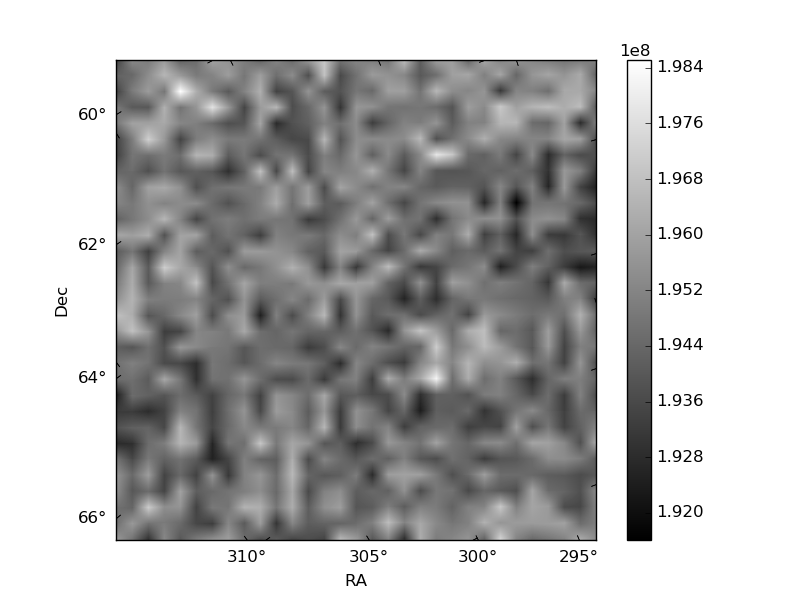
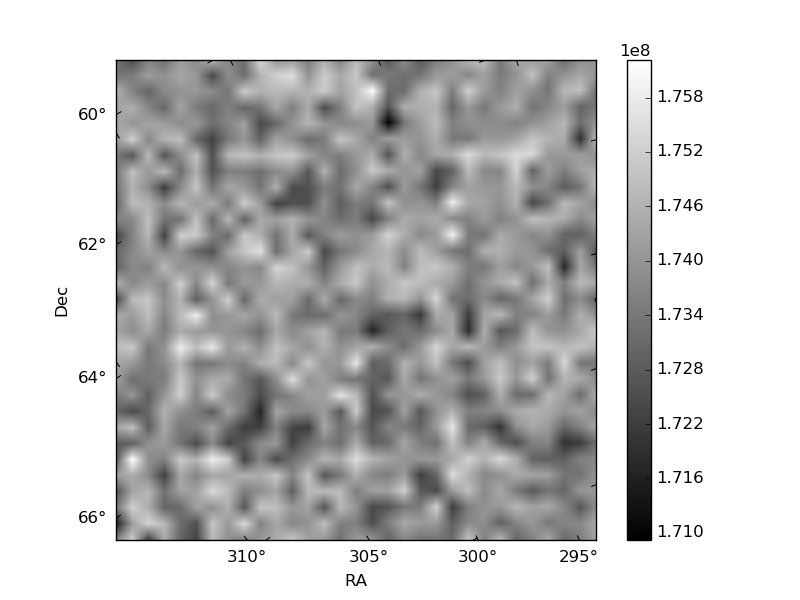
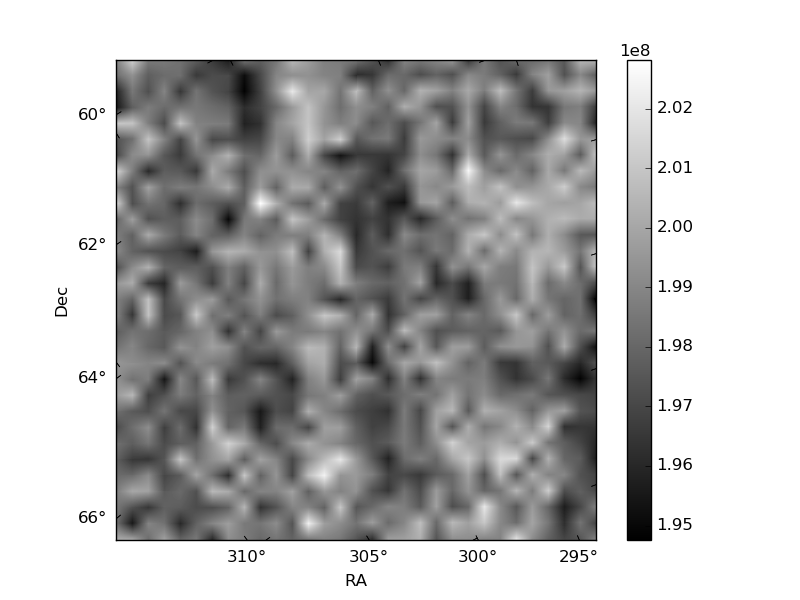
Histogram calculated using DETX and DETY for each event in the final _common_clean file
| Quadrant A | 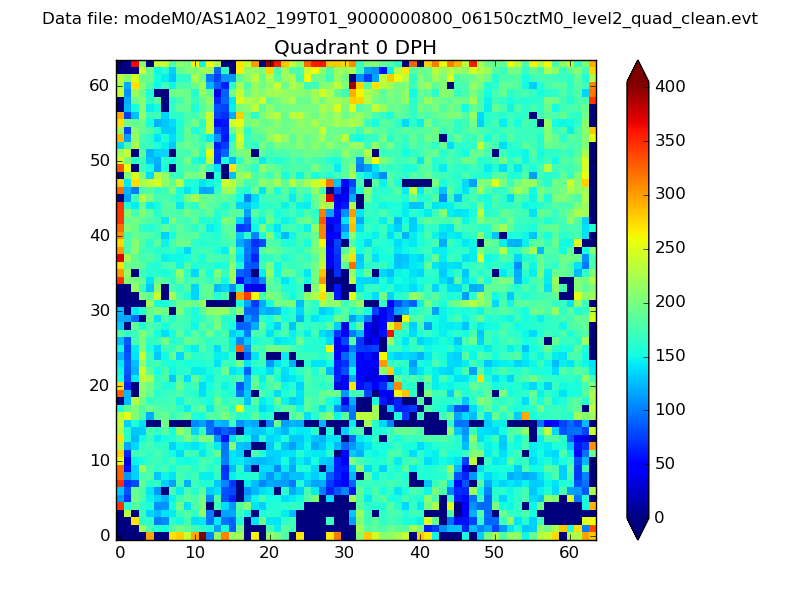 |
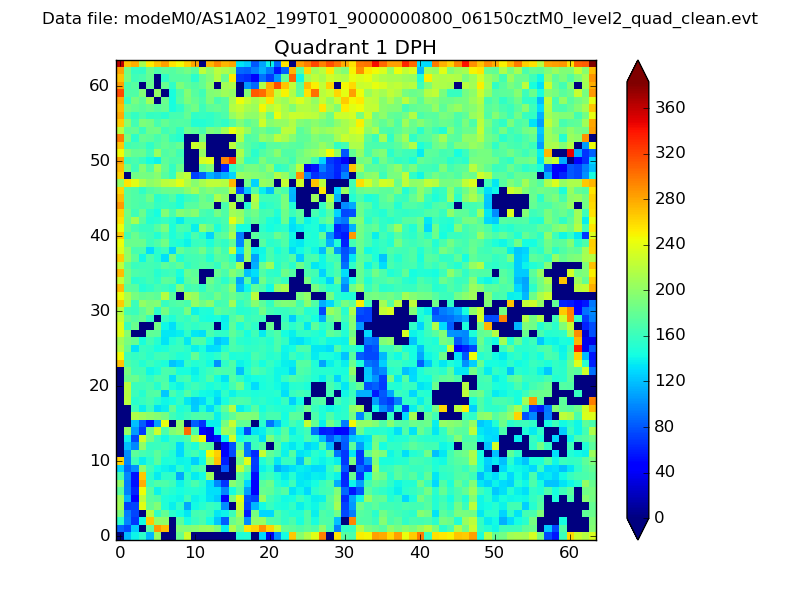 |
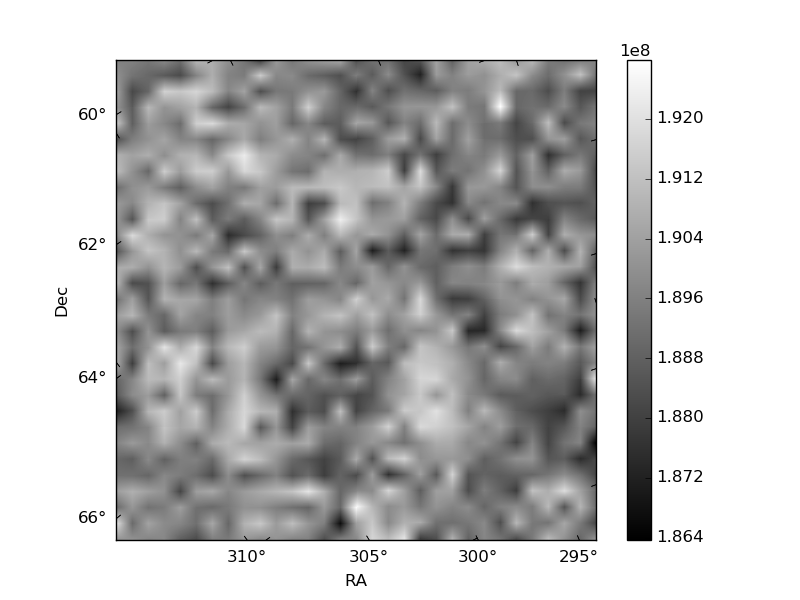
Quadrant B |
|---|---|---|---|
| Quadrant D | 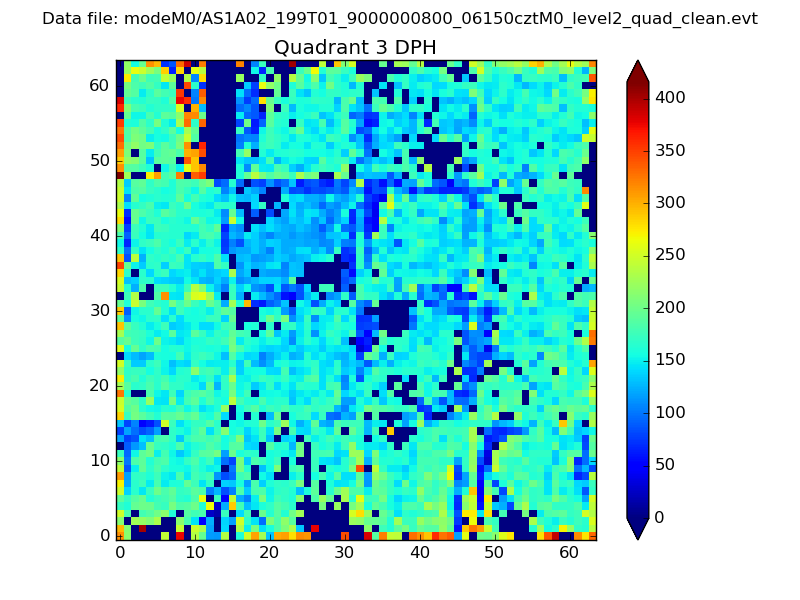 |
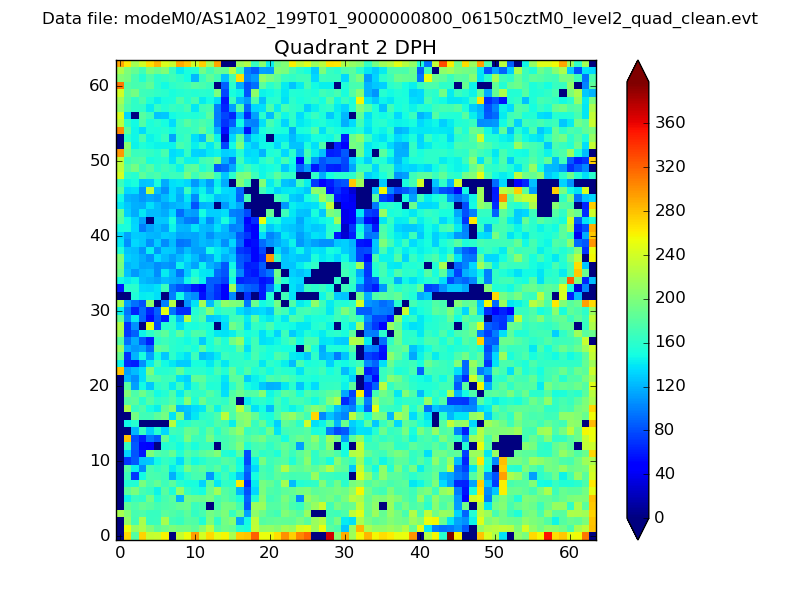 |
Quadrant C |
| Plot type | Count rate plots | Images |
|---|---|---|
| Comparison with Poisson distribution Blue bars denote a histogram of data divided into 1 sec bins. Red curve is a Poisson curve with rate = median count rate of data. |
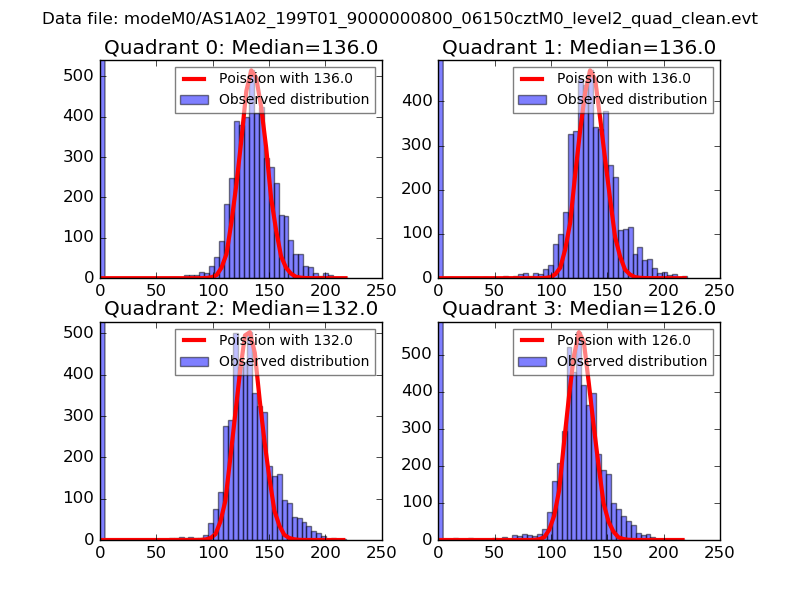 |
 |
| Quadrant-wise count rates Data is divided into 100 sec bins |
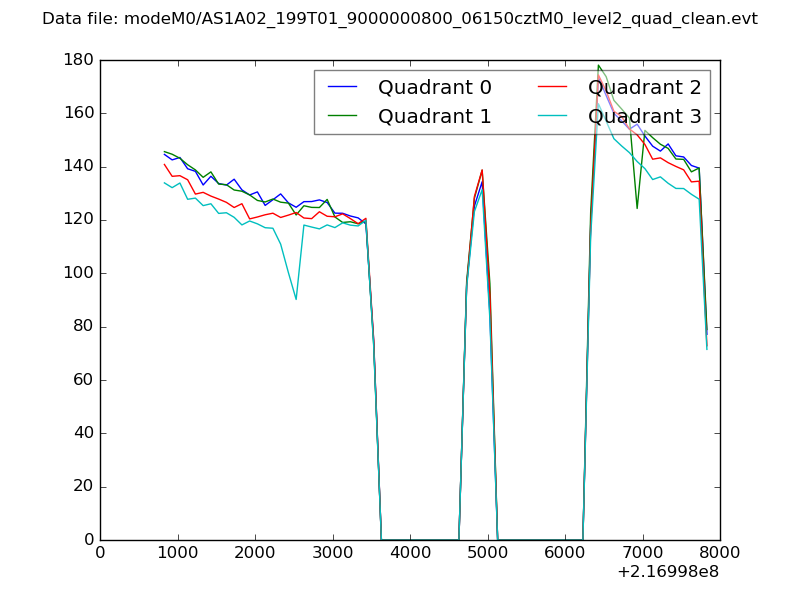 |
|
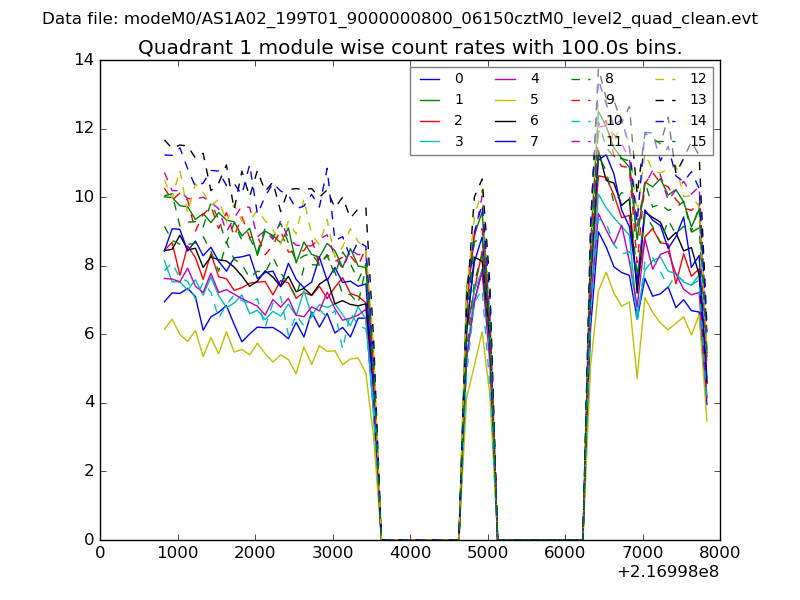
| Module-wise count rates for Quadrant A Data is divided into 100 sec bins |
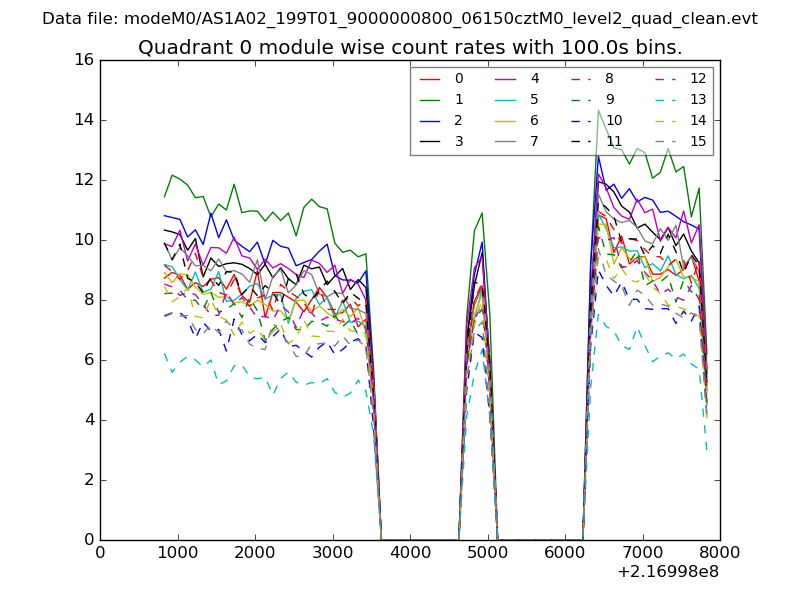 |
 |
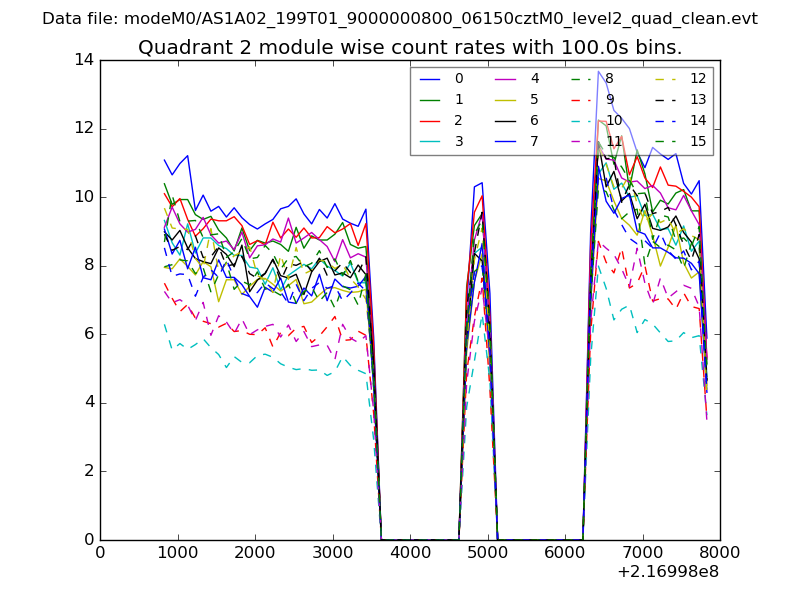
| Module-wise count rates for Quadrant B Data is divided into 100 sec bins |
 |
 |
| Module-wise count rates for Quadrant C Data is divided into 100 sec bins |
 |
 |
| Module-wise count rates for Quadrant D Data is divided into 100 sec bins |
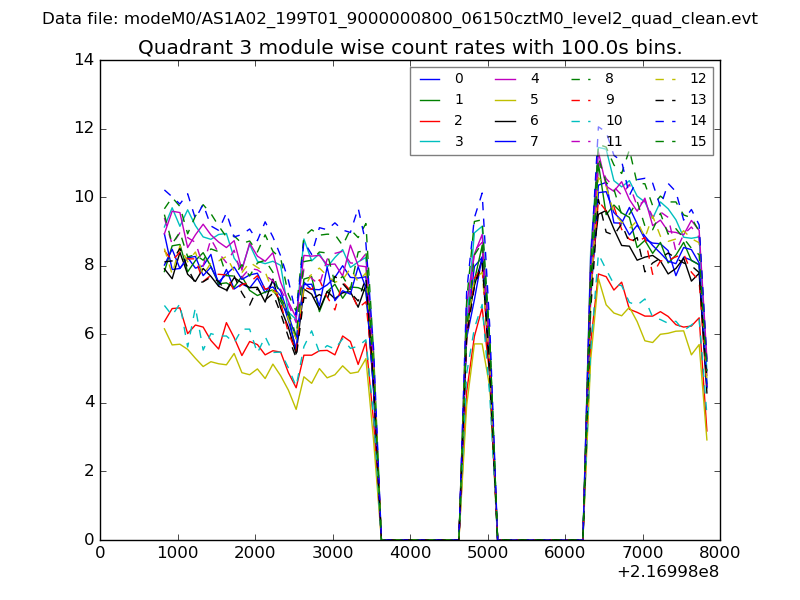 |
 |
| Parameter | Plot |
|---|---|
| CZT HV Monitor | 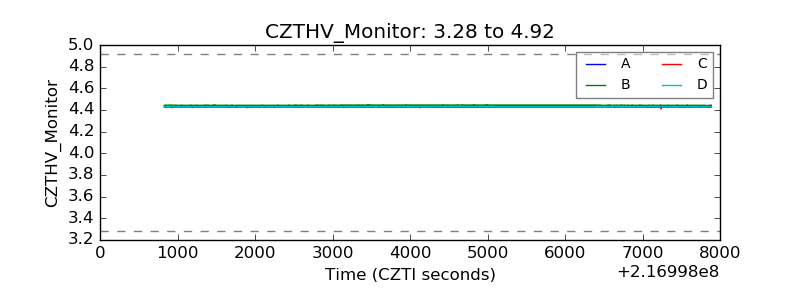 |
| D_VDD | 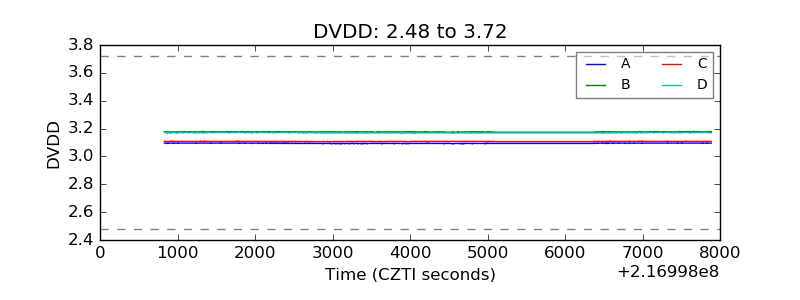 |
| Temperature 1 | 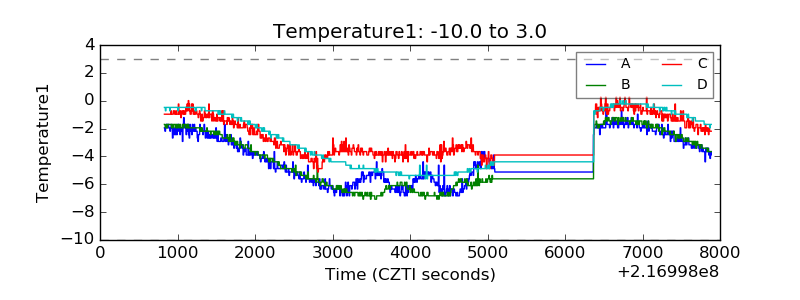 |
| Veto HV Monitor | 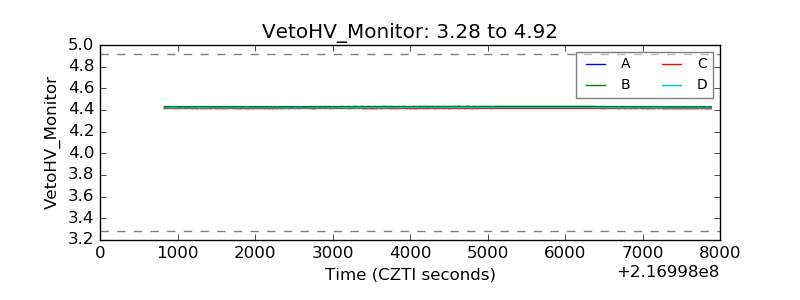 |
| Veto LLD | 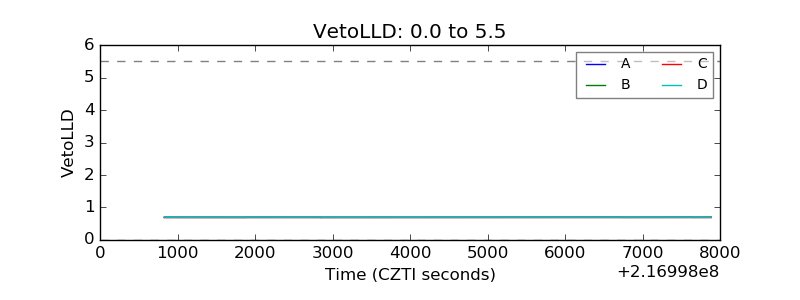 |
| Alpha Counter | 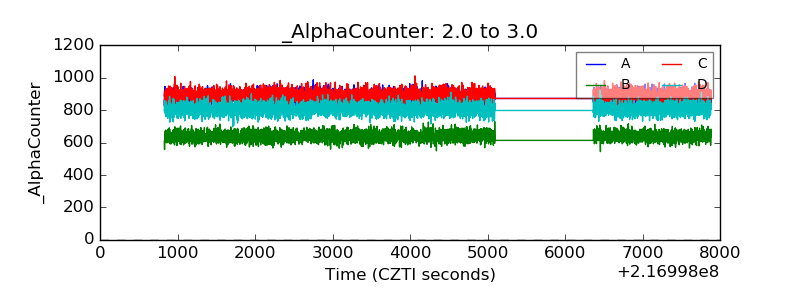 |
| _CPM_Rate | 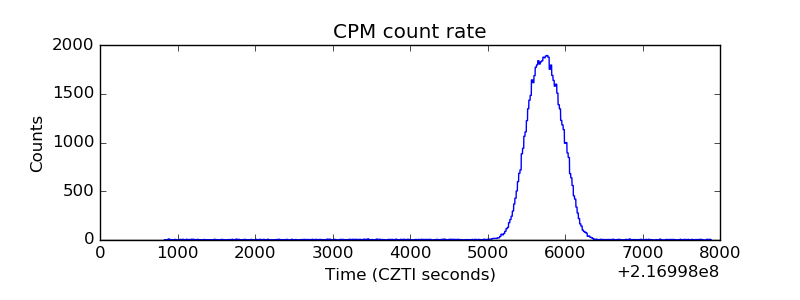 |
| CZT Counter | 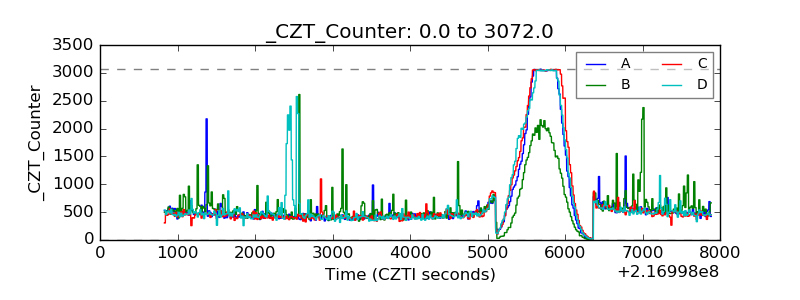 |
| +2.5 Volts monitor | 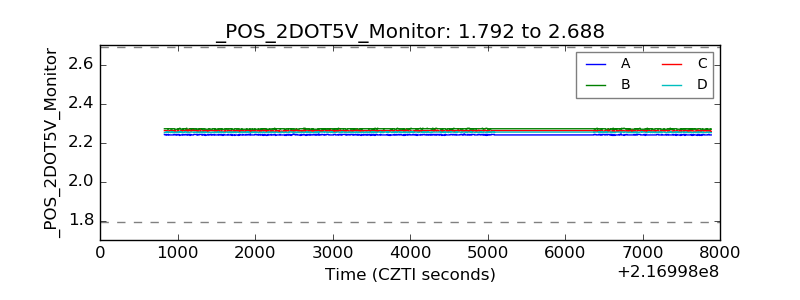 |
| +5 Volts monitor |  |
| _ROLL_ROT | 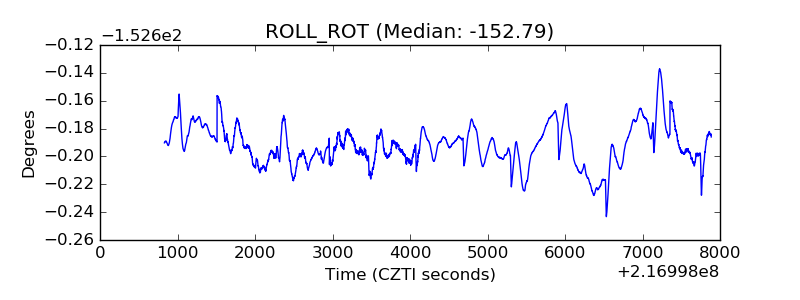 |
| _Roll_DEC | 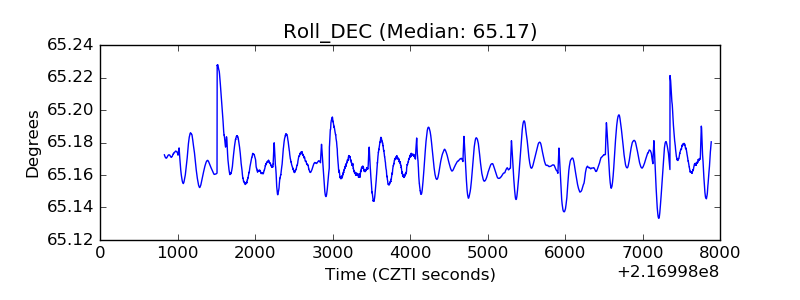 |
| _Roll_RA | 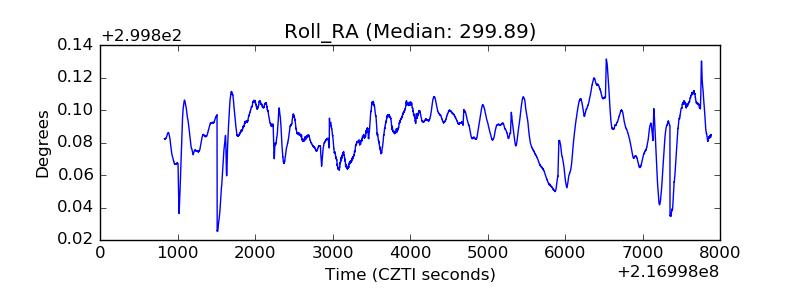 |
| Veto Counter | 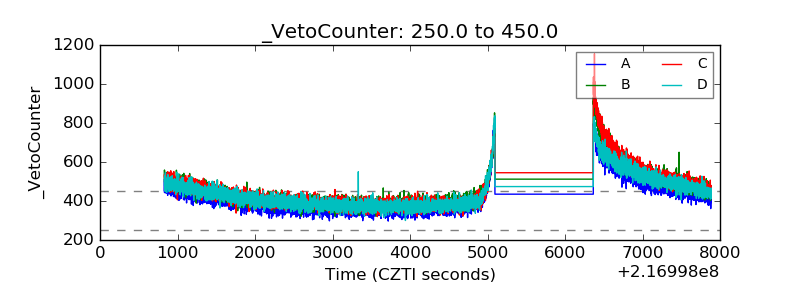 |