| Param | Original file | Final file |
|---|---|---|
| Filename | modeM0/AS1A02_199T01_9000000800_06151cztM0_level2.evt | modeM0/AS1A02_199T01_9000000800_06151cztM0_level2_quad_clean.evt |
| Size (bytes) | 1,330,277,760 | 287,622,720 |
| Size | 1.2 GB | 274.3 MB |
| Events in quadrant A | 8,826,147 | 1,904,932 |
| Events in quadrant B | 10,346,084 | 1,906,929 |
| Events in quadrant C | 8,374,427 | 1,860,091 |
| Events in quadrant D | 11,481,996 | 1,756,506 |
| Mode SS | |||
|---|---|---|---|
| Quadrant | BADHDUFLAG | Total packets | Discarded packets |
| A | 0 | 380 | 0 |
| B | 0 | 380 | 0 |
| C | 0 | 380 | 0 |
| D | 0 | 380 | 0 |
| Mode M9 | |||
|---|---|---|---|
| Quadrant | BADHDUFLAG | Total packets | Discarded packets |
| A | 0 | 37 | 0 |
| B | 0 | 37 | 0 |
| C | 0 | 37 | 0 |
| D | 0 | 38 | 0 |
| Mode M0 | |||
|---|---|---|---|
| Quadrant | BADHDUFLAG | Total packets | Discarded packets |
| A | 0 | 38935 | 5 |
| B | 0 | 43340 | 4 |
| C | 0 | 37977 | 4 |
| D | 0 | 47016 | 4 |
| Quadrant | Total seconds | Saturated seconds | Saturation percentage |
|---|---|---|---|
| A | 18621 | 177 | 0.950540% |
| B | 18621 | 301 | 1.616455% |
| C | 18621 | 79 | 0.424252% |
| D | 18621 | 728 | 3.909564% |
Noise dominated data is calculated using 1-second bins in cleaned event files. If a bin has >2000 counts, and if more than 50% of those come from <1% of pixels, then it is considered to be noise-dominated and hence unusable.
| Quadrant | # 1 sec bins | Bins with >0 counts | Bins with >2000 counts | High rate bins dominated by noise | Noise dominated (total time) | Noise dominated (detector-on time) | Marked lightcurve |
|---|---|---|---|---|---|---|---|
| A | 23823 | 18624 | 43 | 43 | 0.18% | 0.23% | 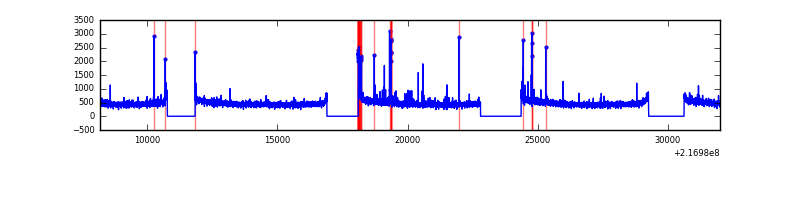 |
| B | 23823 | 18625 | 152 | 152 | 0.64% | 0.82% | 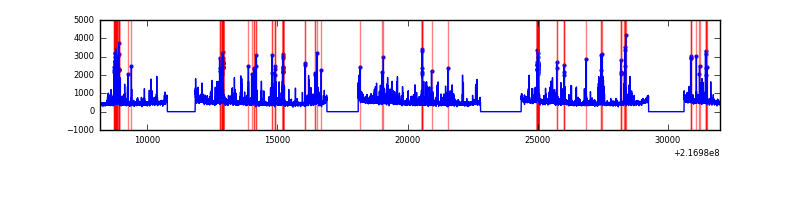 |
| C | 23823 | 18625 | 3 | 3 | 0.01% | 0.02% | 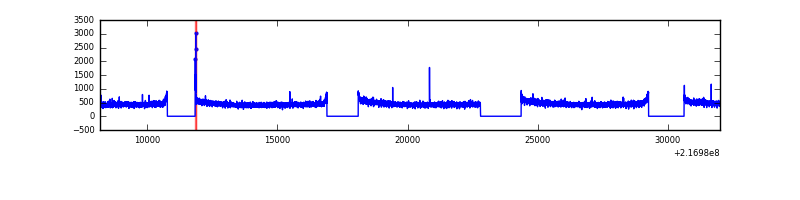 |
| D | 23823 | 18624 | 519 | 519 | 2.18% | 2.79% | 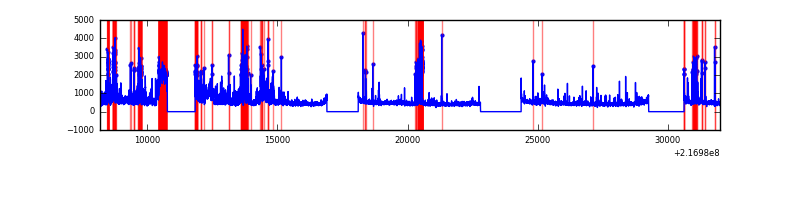 |
Top three noisy pixels from each quadrant. If the there are fewer than three noisy pixels in the level2.evt file, extra rows are filled as -1
| Pixel properties | Quadrant properties | ||||||
|---|---|---|---|---|---|---|---|
| Quadrant | DetID | PixID | Counts | Sigma | Mean | Median | Sigma |
| A | 8 | 15 | 294419 | 671.51 | 2174 | 2130 | 435.3 |
| A | 15 | 236 | 96795 | 217.48 | 2174 | 2130 | 435.3 |
| A | 14 | 111 | 31511 | 67.5 | 2174 | 2130 | 435.3 |
| B | 3 | 64 | 1140110 | 2824.07 | 2179 | 2131 | 403.0 |
| B | 0 | 219 | 307740 | 758.42 | 2179 | 2131 | 403.0 |
| B | 0 | 214 | 158233 | 387.39 | 2179 | 2131 | 403.0 |
| C | 9 | 16 | 33830 | 65.63 | 2129 | 2137 | 482.9 |
| C | 1 | 16 | 20224 | 37.46 | 2129 | 2137 | 482.9 |
| C | 13 | 61 | 17149 | 31.09 | 2129 | 2137 | 482.9 |
| D | 13 | 169 | 3157384 | 6240.7 | 2090 | 2026 | 505.6 |
| D | 5 | 97 | 151925 | 296.47 | 2090 | 2026 | 505.6 |
| D | 8 | 195 | 101422 | 196.59 | 2090 | 2026 | 505.6 |
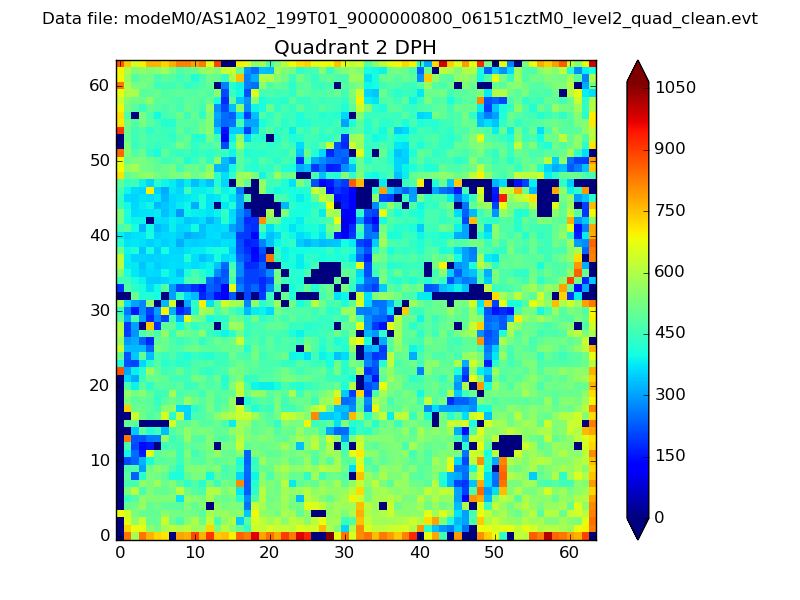
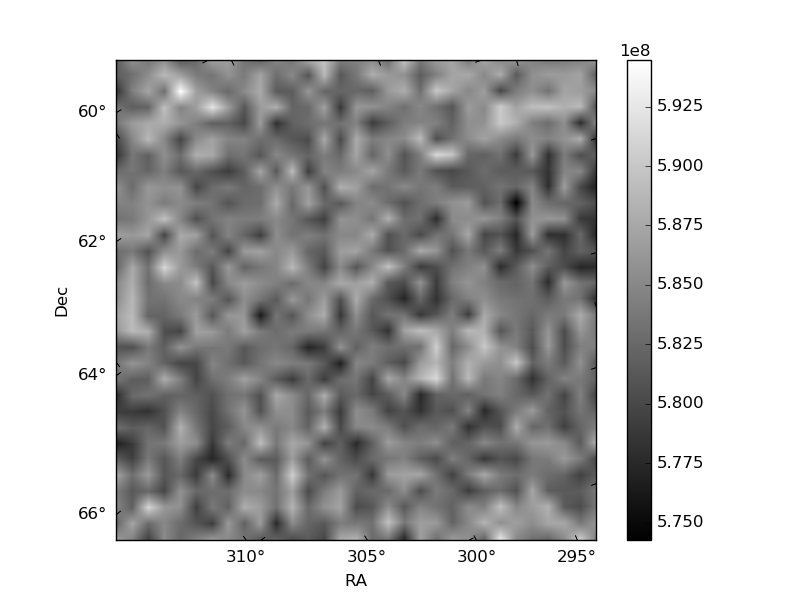
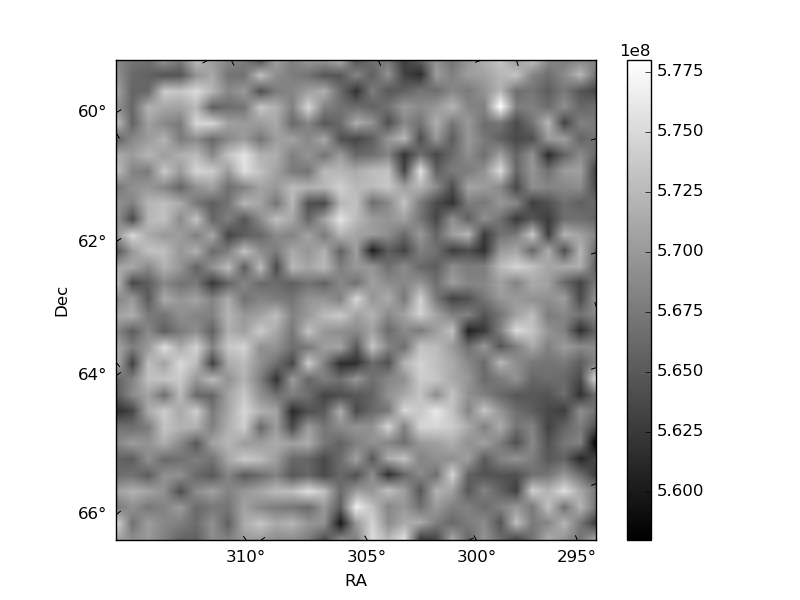
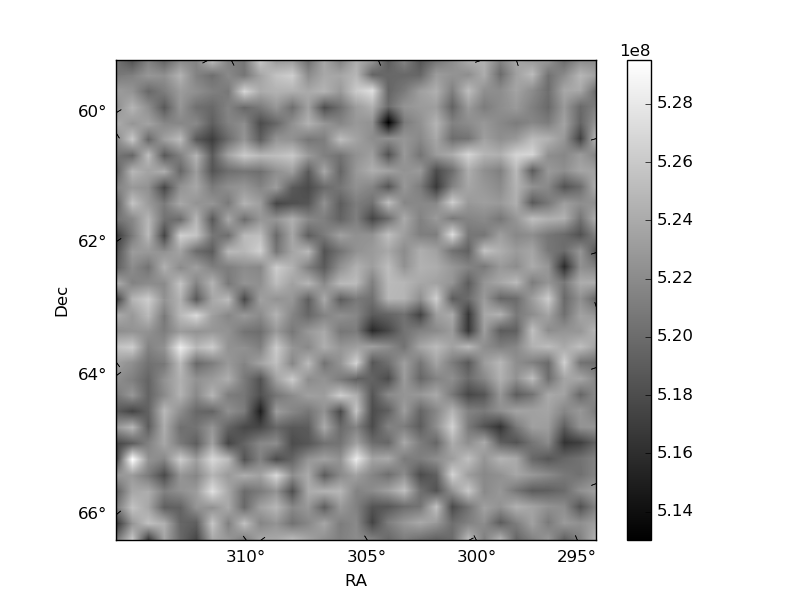
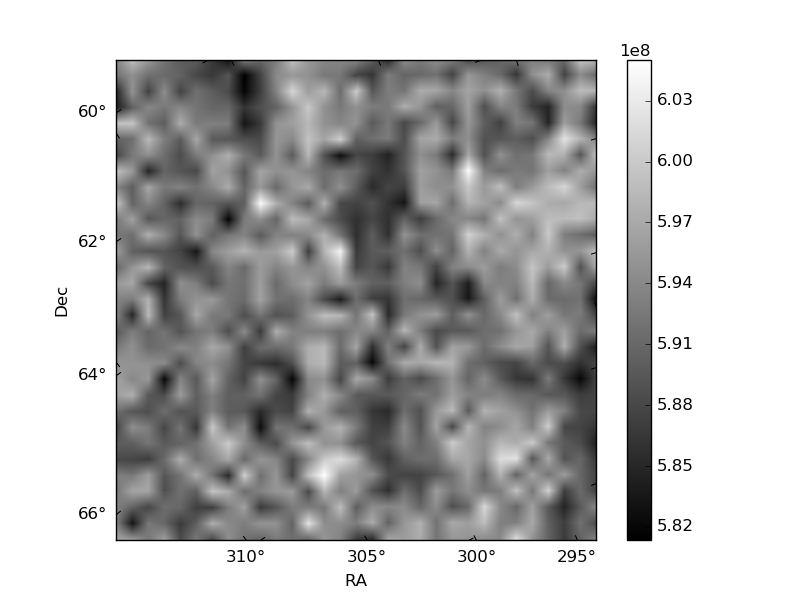
Histogram calculated using DETX and DETY for each event in the final _common_clean file
| Quadrant A | 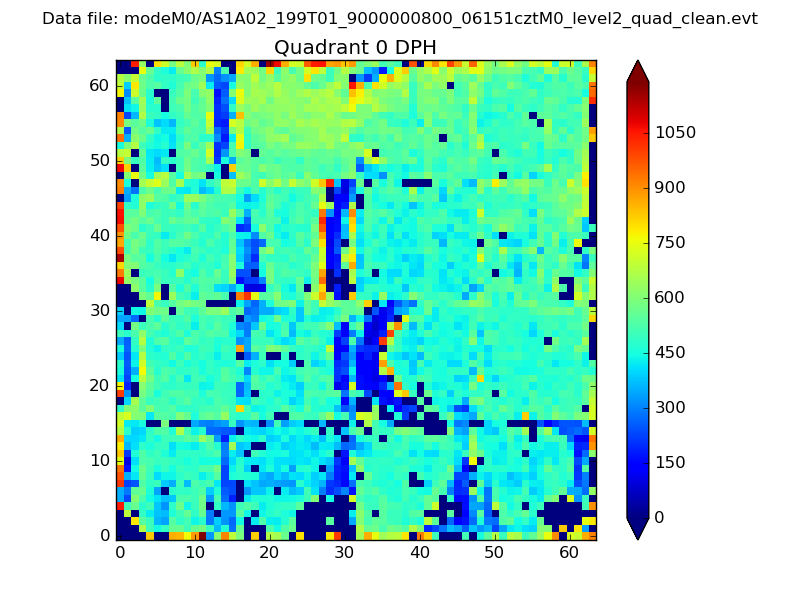 |
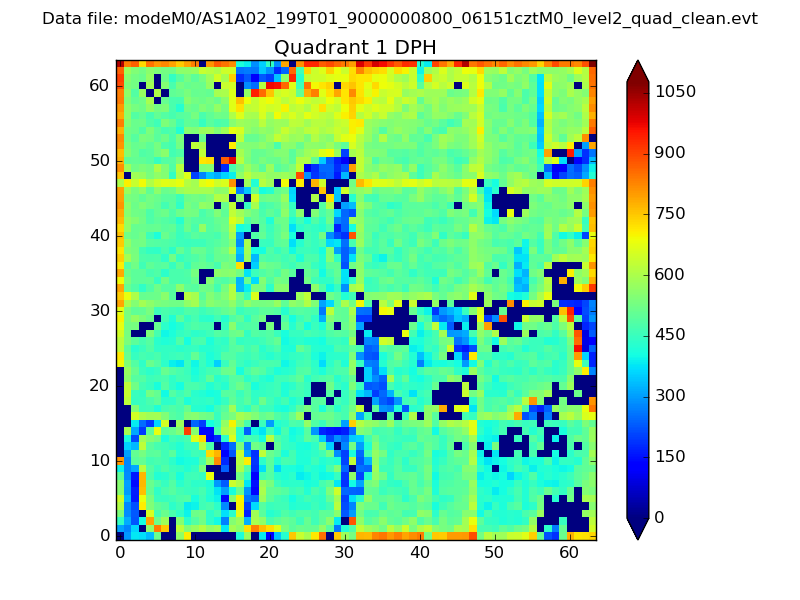 |
Quadrant B |
|---|---|---|---|
| Quadrant D | 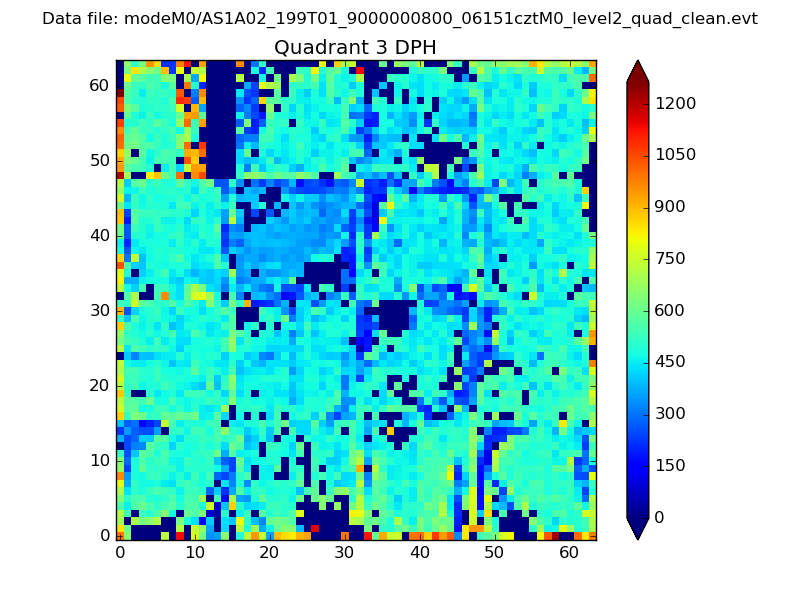 |
 |
Quadrant C |
| Plot type | Count rate plots | Images |
|---|---|---|
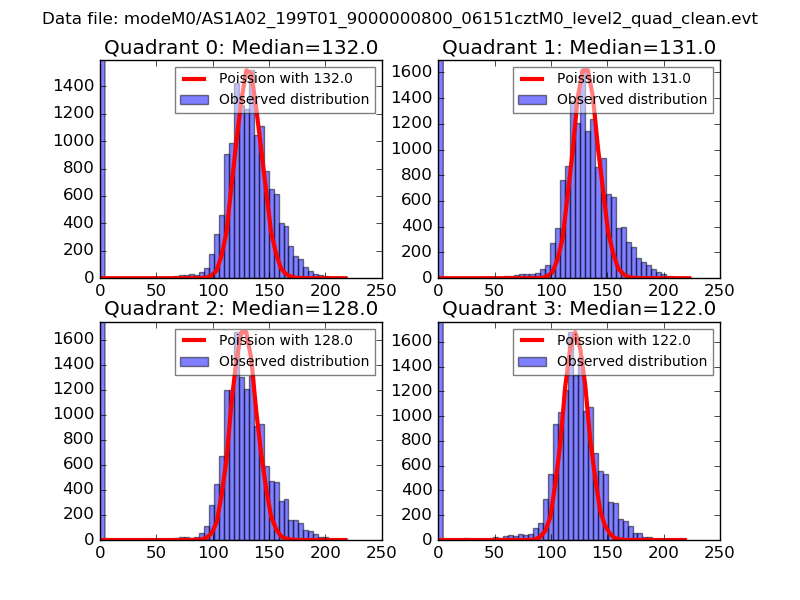
| Comparison with Poisson distribution Blue bars denote a histogram of data divided into 1 sec bins. Red curve is a Poisson curve with rate = median count rate of data. |
 |
 |
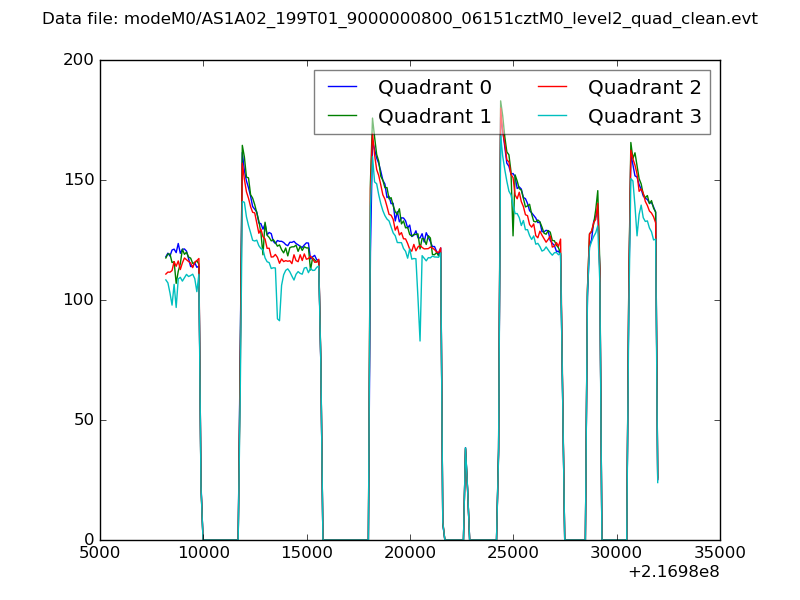
| Quadrant-wise count rates Data is divided into 100 sec bins |
 |
|
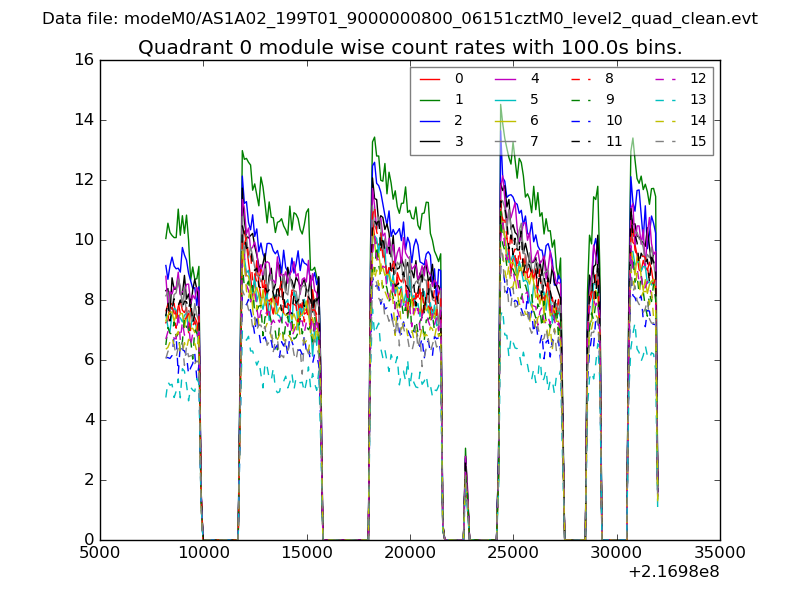
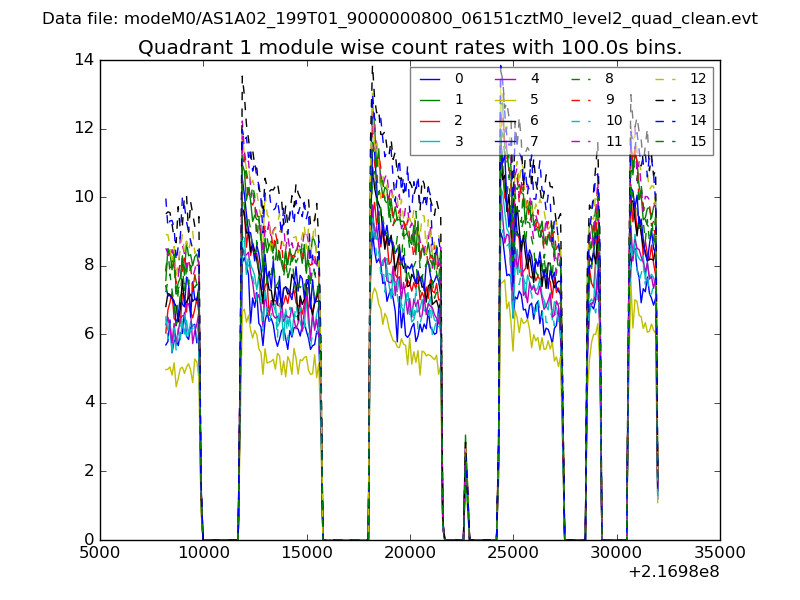
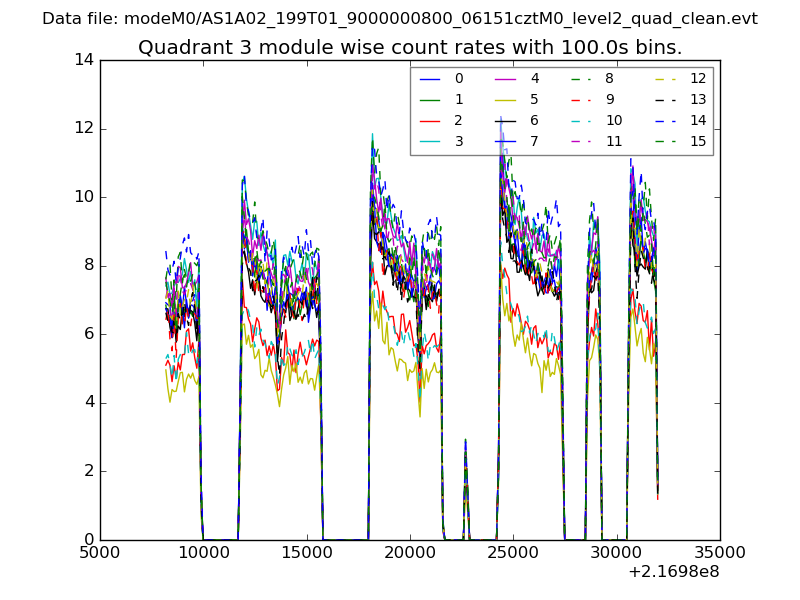
| Module-wise count rates for Quadrant A Data is divided into 100 sec bins |
 |
 |
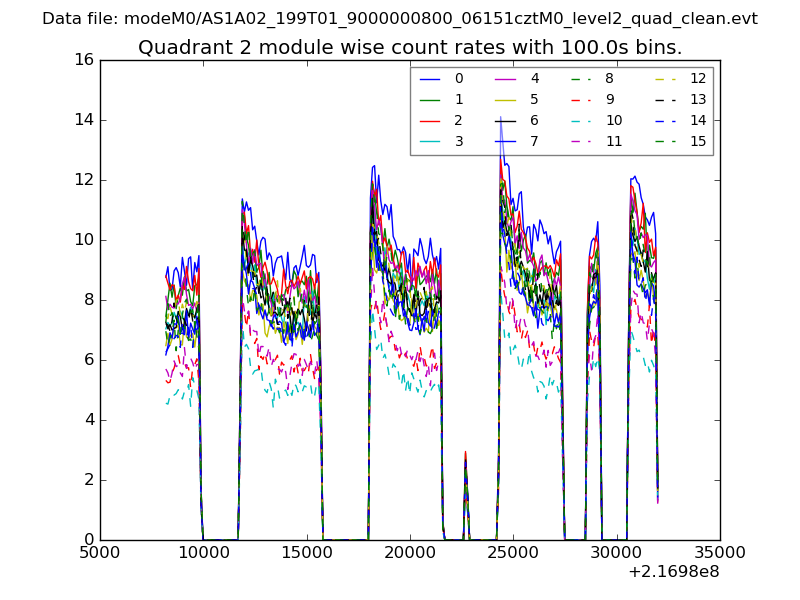
| Module-wise count rates for Quadrant B Data is divided into 100 sec bins |
 |
 |
| Module-wise count rates for Quadrant C Data is divided into 100 sec bins |
 |
 |
| Module-wise count rates for Quadrant D Data is divided into 100 sec bins |
 |
 |
| Parameter | Plot |
|---|---|
| CZT HV Monitor | 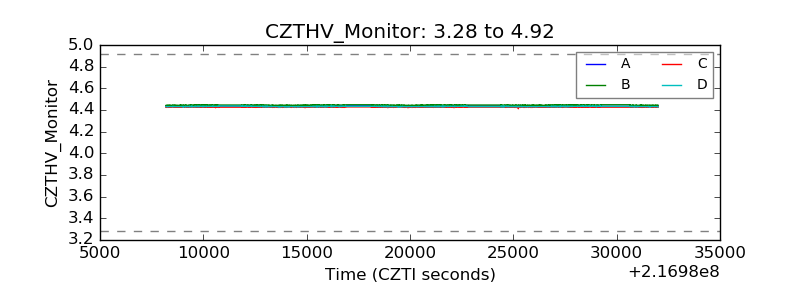 |
| D_VDD | 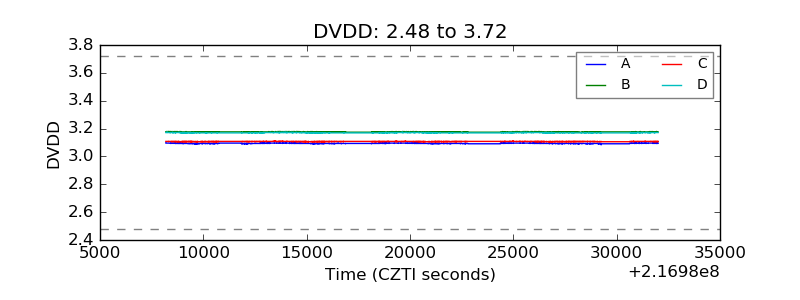 |
| Temperature 1 | 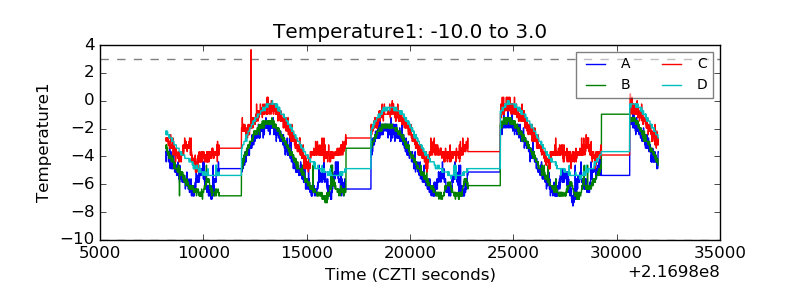 |
| Veto HV Monitor | 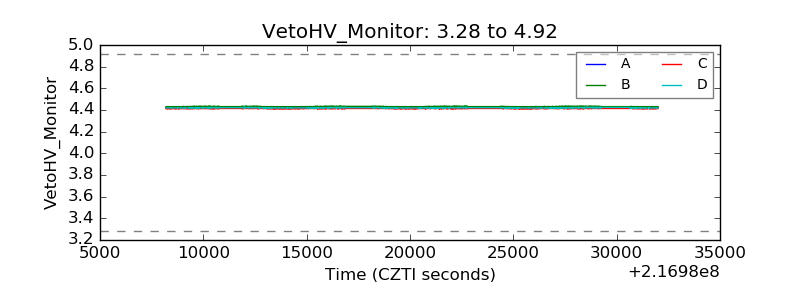 |
| Veto LLD | 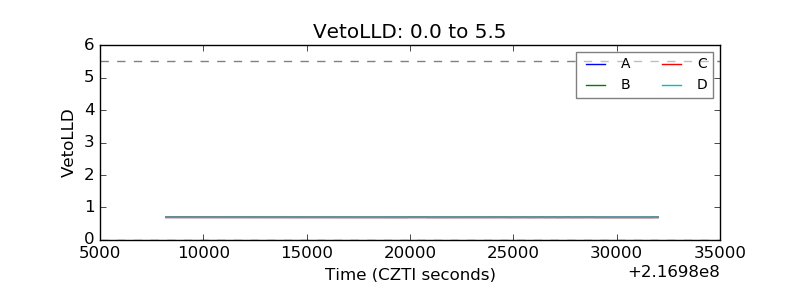 |
| Alpha Counter | 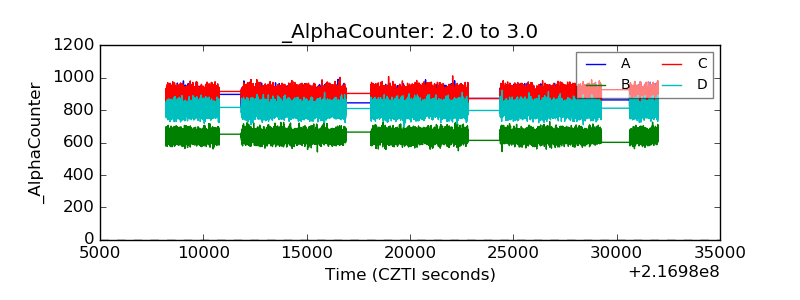 |
| _CPM_Rate | 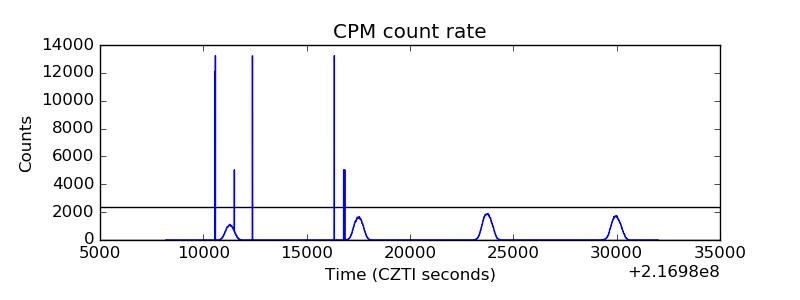 |
| CZT Counter | 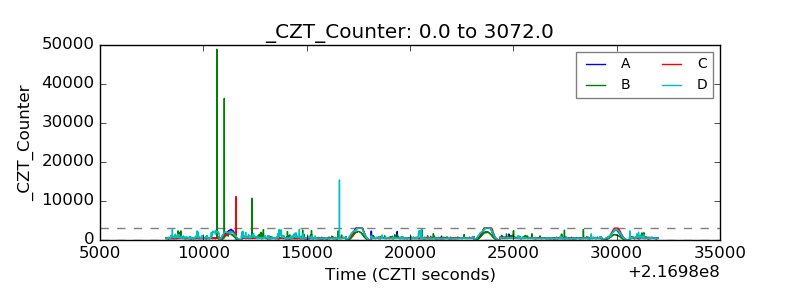 |
| +2.5 Volts monitor |  |
| +5 Volts monitor |  |
| _ROLL_ROT | 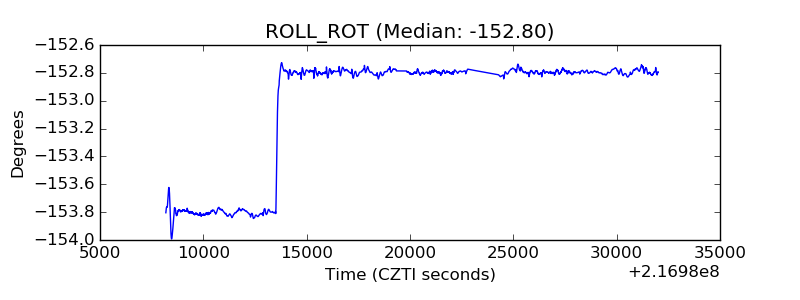 |
| _Roll_DEC | 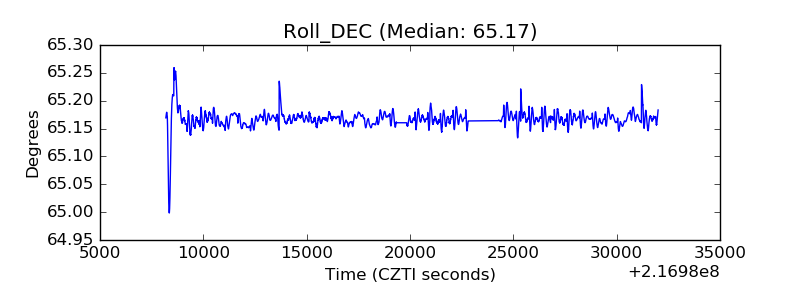 |
| _Roll_RA | 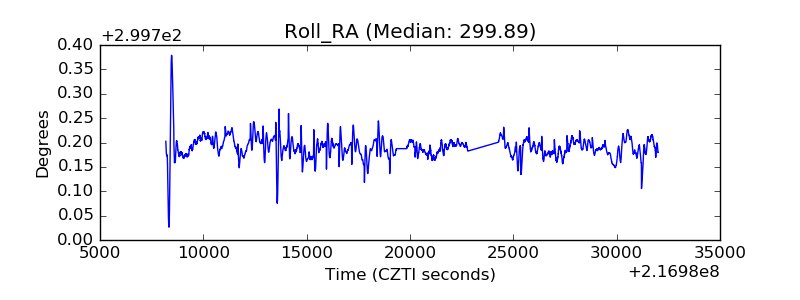 |
| Veto Counter | 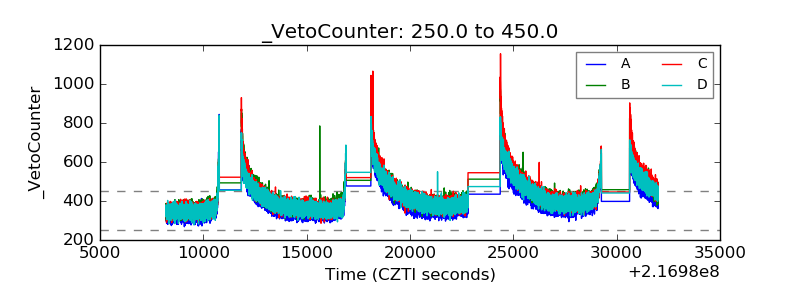 |