| Param | Original file | Final file |
|---|---|---|
| Filename | modeM0/AS1A02_199T01_9000000800_06152cztM0_level2.evt | modeM0/AS1A02_199T01_9000000800_06152cztM0_level2_quad_clean.evt |
| Size (bytes) | 420,459,840 | 103,890,240 |
| Size | 401.0 MB | 99.1 MB |
| Events in quadrant A | 2,959,282 | 686,700 |
| Events in quadrant B | 3,333,038 | 695,772 |
| Events in quadrant C | 2,859,838 | 682,640 |
| Events in quadrant D | 3,157,408 | 646,106 |
| Mode SS | |||
|---|---|---|---|
| Quadrant | BADHDUFLAG | Total packets | Discarded packets |
| A | 0 | 126 | 0 |
| B | 0 | 126 | 0 |
| C | 0 | 126 | 0 |
| D | 0 | 126 | 0 |
| Mode M9 | |||
|---|---|---|---|
| Quadrant | BADHDUFLAG | Total packets | Discarded packets |
| A | 0 | 13 | 0 |
| B | 0 | 13 | 0 |
| C | 0 | 13 | 0 |
| D | 0 | 14 | 0 |
| Mode M0 | |||
|---|---|---|---|
| Quadrant | BADHDUFLAG | Total packets | Discarded packets |
| A | 0 | 13030 | 4 |
| B | 0 | 14137 | 3 |
| C | 0 | 12722 | 3 |
| D | 0 | 13897 | 3 |
| Quadrant | Total seconds | Saturated seconds | Saturation percentage |
|---|---|---|---|
| A | 6238 | 23 | 0.368708% |
| B | 6238 | 68 | 1.090093% |
| C | 6238 | 24 | 0.384739% |
| D | 6238 | 102 | 1.635139% |
Noise dominated data is calculated using 1-second bins in cleaned event files. If a bin has >2000 counts, and if more than 50% of those come from <1% of pixels, then it is considered to be noise-dominated and hence unusable.
| Quadrant | # 1 sec bins | Bins with >0 counts | Bins with >2000 counts | High rate bins dominated by noise | Noise dominated (total time) | Noise dominated (detector-on time) | Marked lightcurve |
|---|---|---|---|---|---|---|---|
| A | 7563 | 6240 | 2 | 2 | 0.03% | 0.03% | 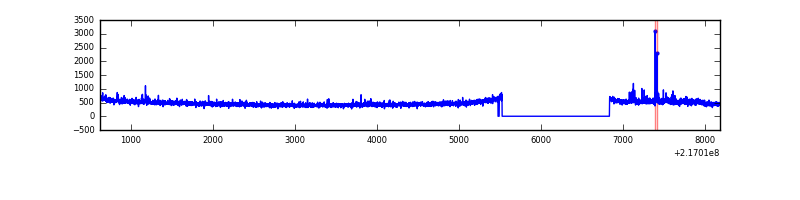 |
| B | 7563 | 6240 | 35 | 35 | 0.46% | 0.56% | 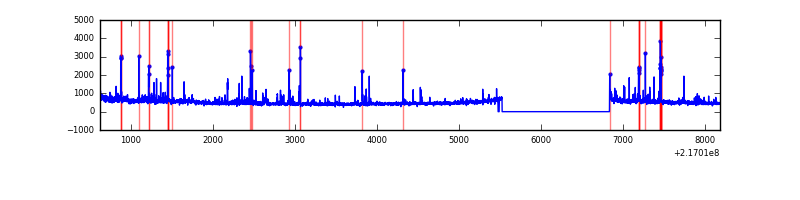 |
| C | 7563 | 6240 | 0 | 0 | 0.00% | 0.00% | 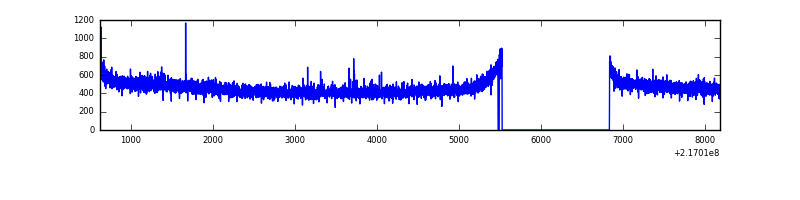 |
| D | 7563 | 6240 | 64 | 64 | 0.85% | 1.03% | 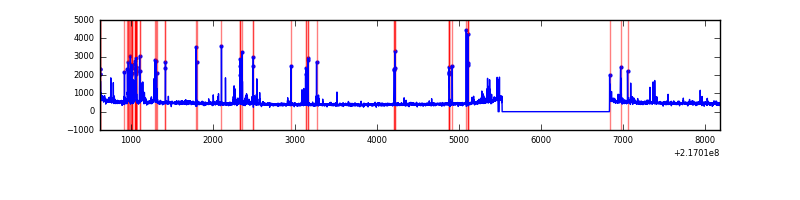 |
Top three noisy pixels from each quadrant. If the there are fewer than three noisy pixels in the level2.evt file, extra rows are filled as -1
| Pixel properties | Quadrant properties | ||||||
|---|---|---|---|---|---|---|---|
| Quadrant | DetID | PixID | Counts | Sigma | Mean | Median | Sigma |
| A | 8 | 15 | 104700 | 703.54 | 736 | 723 | 147.8 |
| A | 0 | 226 | 7127 | 43.33 | 736 | 723 | 147.8 |
| A | 12 | 194 | 7070 | 42.95 | 736 | 723 | 147.8 |
| B | 3 | 64 | 191163 | 1375.23 | 742 | 725 | 138.5 |
| B | 15 | 204 | 89461 | 640.8 | 742 | 725 | 138.5 |
| B | 0 | 219 | 71195 | 508.89 | 742 | 725 | 138.5 |
| C | 9 | 54 | 9272 | 51.12 | 728 | 731 | 167.1 |
| C | 1 | 16 | 6324 | 33.47 | 728 | 731 | 167.1 |
| C | 13 | 61 | 5788 | 30.26 | 728 | 731 | 167.1 |
| D | 13 | 169 | 322154 | 1851.02 | 720 | 698 | 173.7 |
| D | 5 | 97 | 44104 | 249.94 | 720 | 698 | 173.7 |
| D | 8 | 195 | 25090 | 140.45 | 720 | 698 | 173.7 |
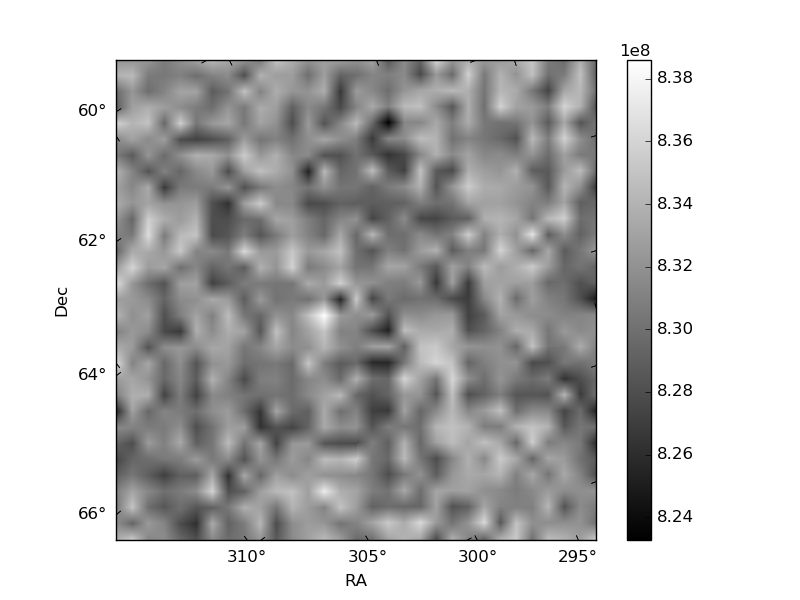
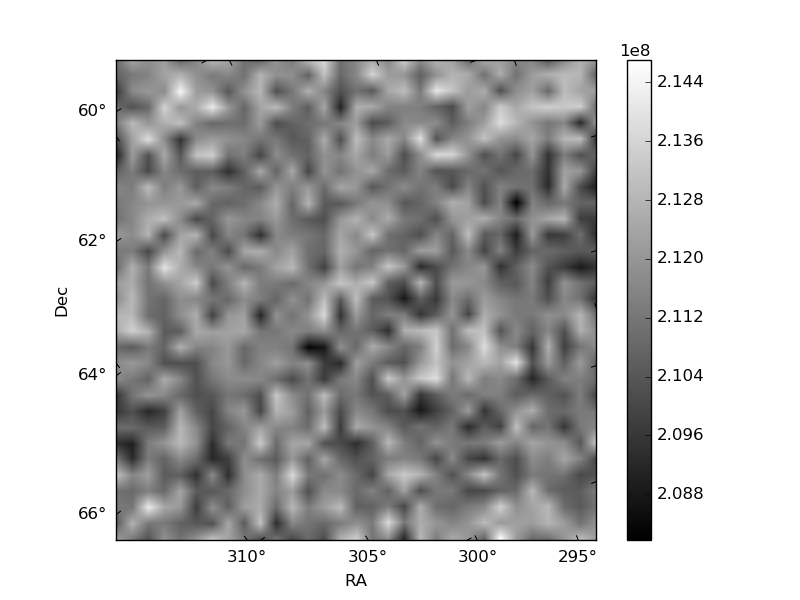
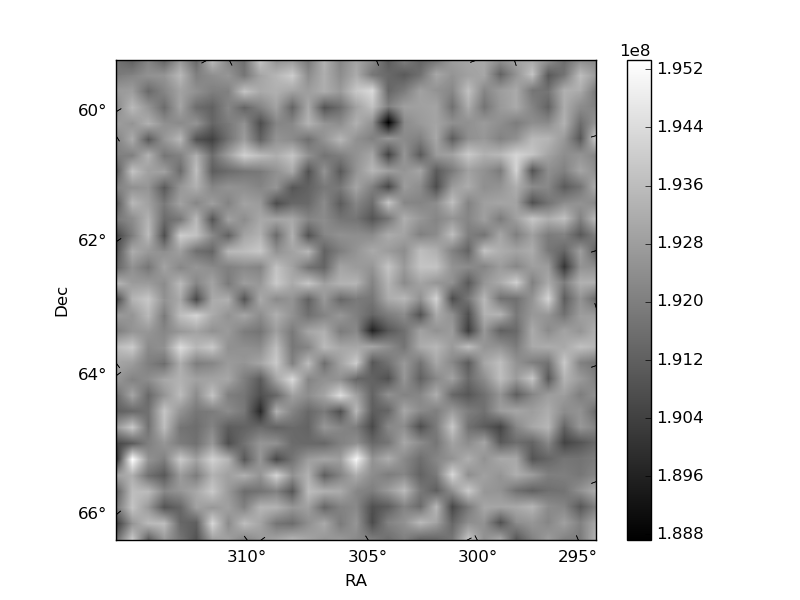
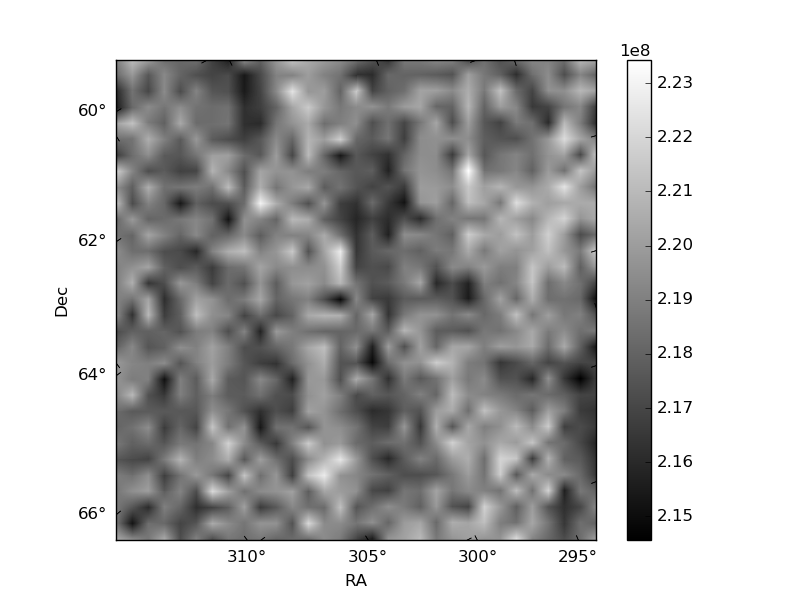
Histogram calculated using DETX and DETY for each event in the final _common_clean file
| Quadrant A | 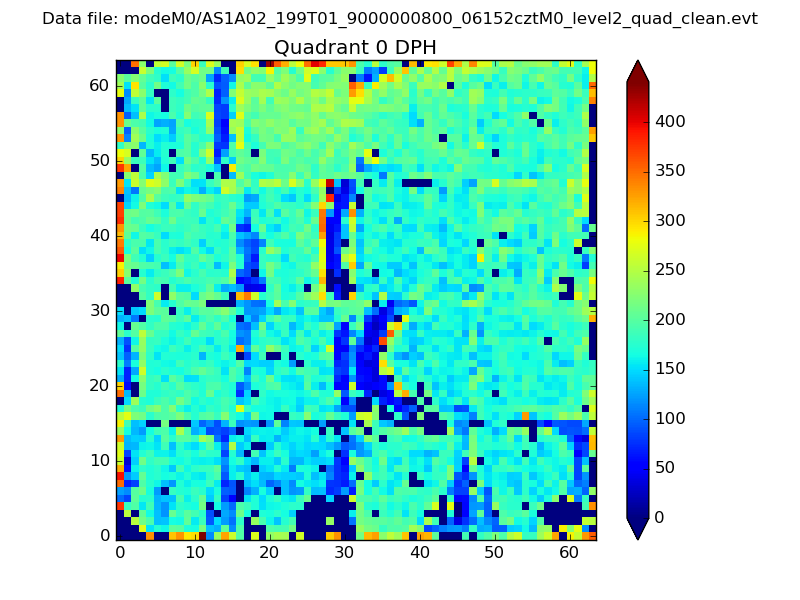 |
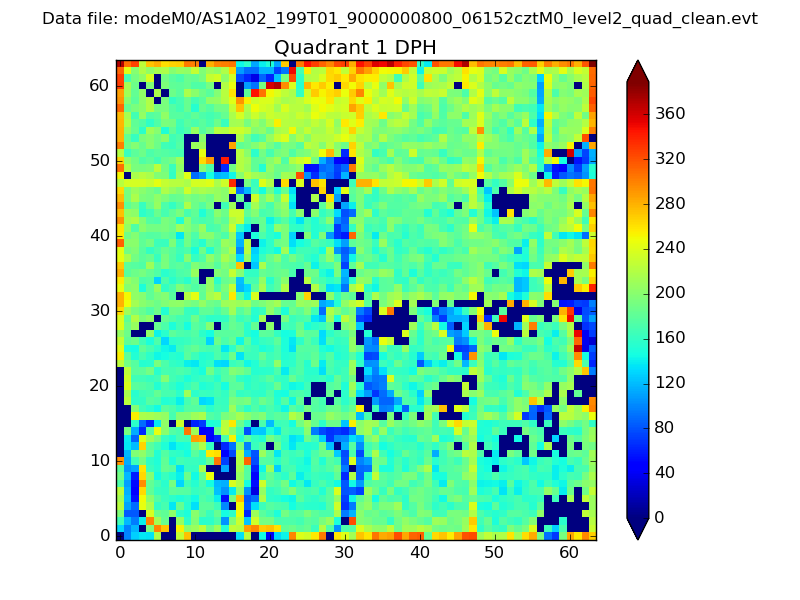 |
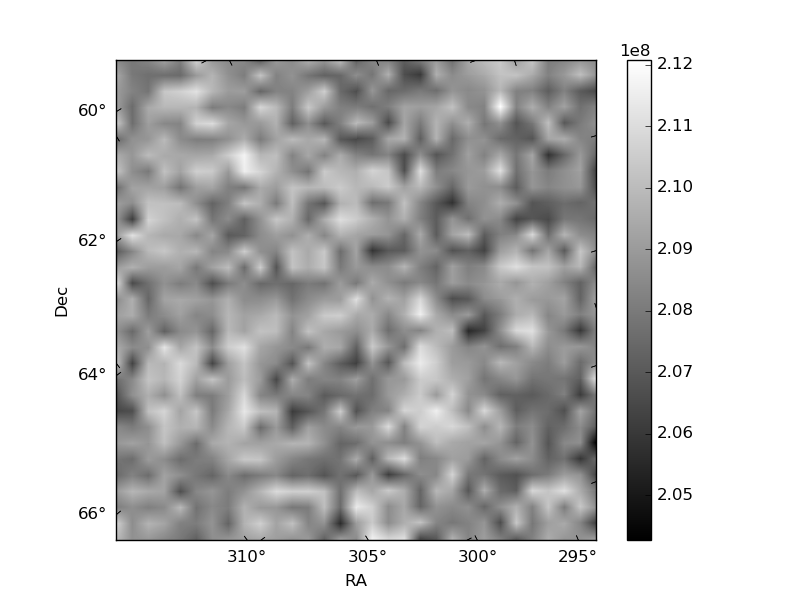
Quadrant B |
|---|---|---|---|
| Quadrant D | 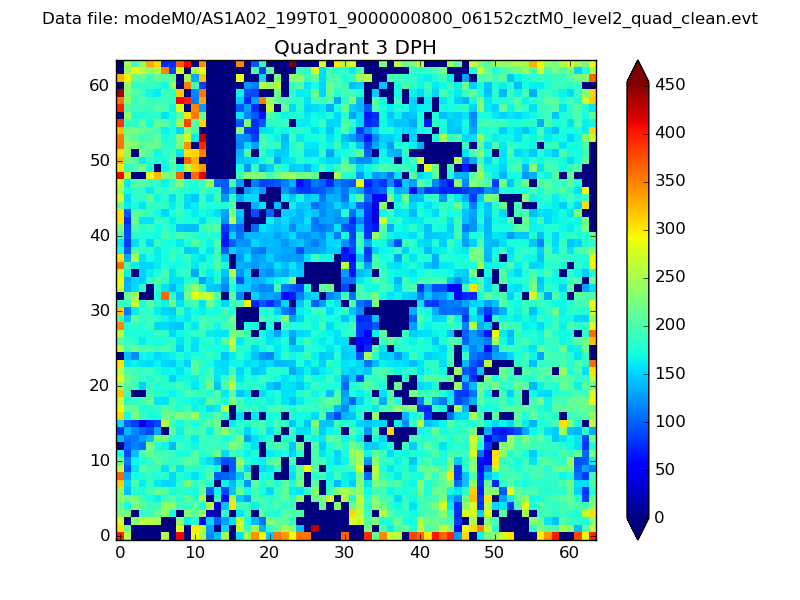 |
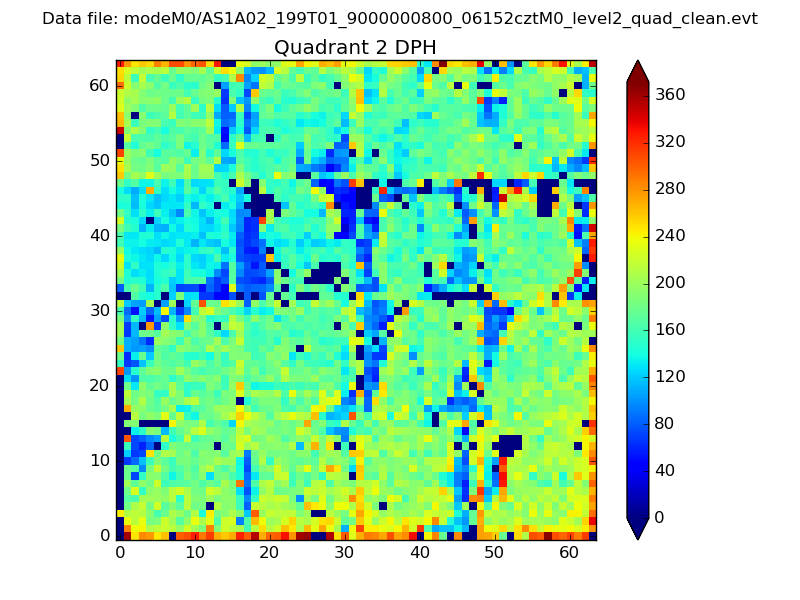 |
Quadrant C |
| Plot type | Count rate plots | Images |
|---|---|---|
| Comparison with Poisson distribution Blue bars denote a histogram of data divided into 1 sec bins. Red curve is a Poisson curve with rate = median count rate of data. |
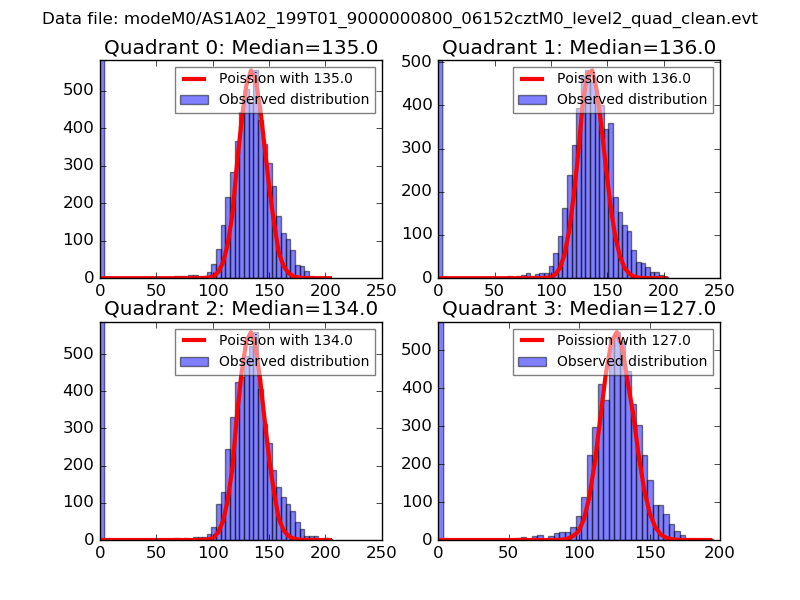 |
 |
| Quadrant-wise count rates Data is divided into 100 sec bins |
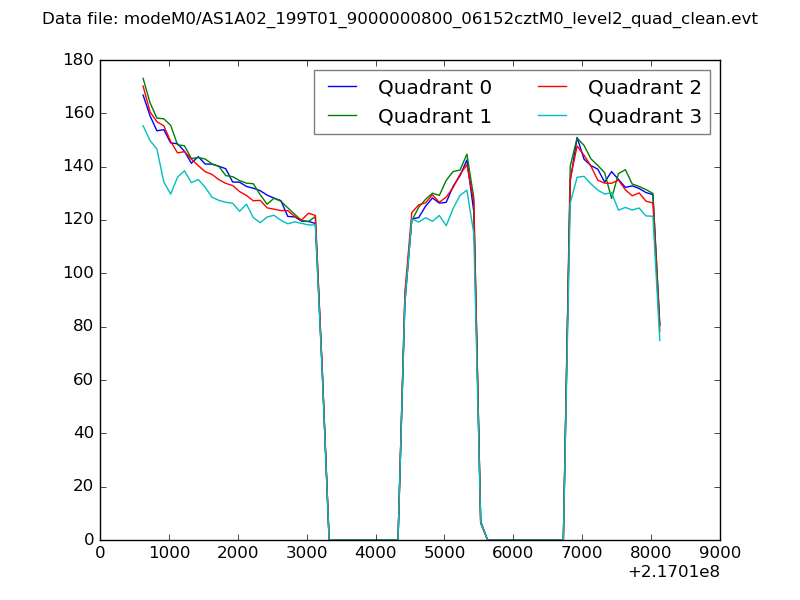 |
|
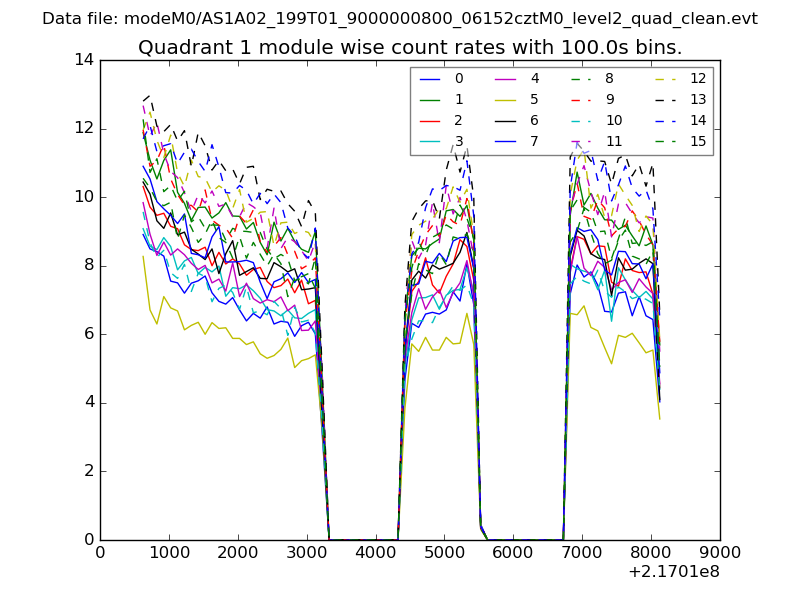
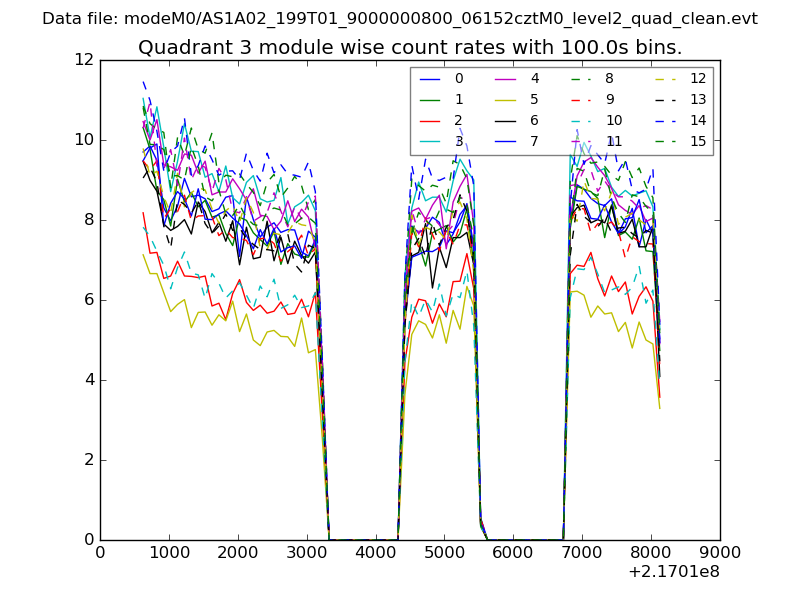
| Module-wise count rates for Quadrant A Data is divided into 100 sec bins |
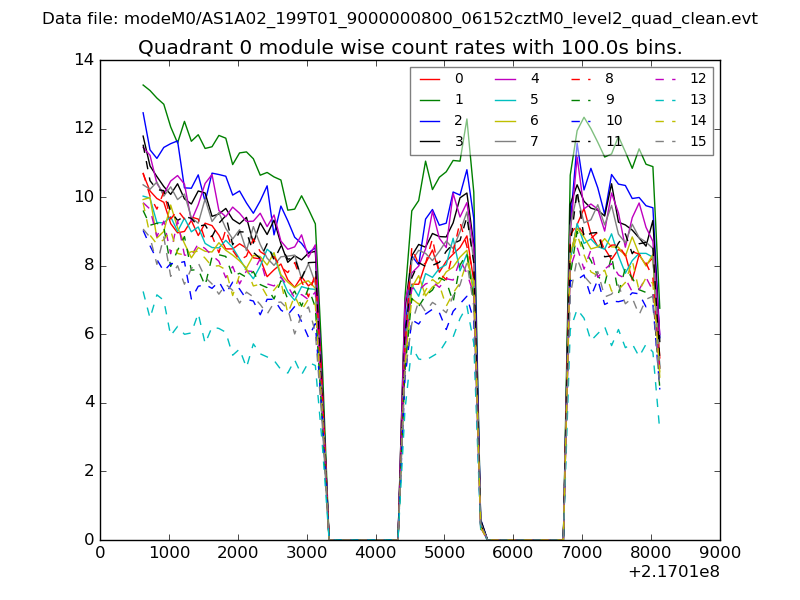 |
 |
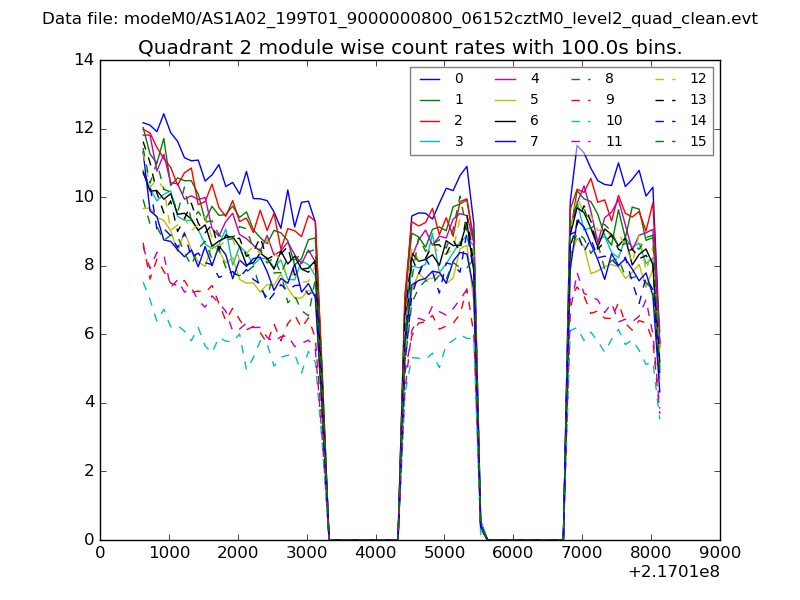
| Module-wise count rates for Quadrant B Data is divided into 100 sec bins |
 |
 |
| Module-wise count rates for Quadrant C Data is divided into 100 sec bins |
 |
 |
| Module-wise count rates for Quadrant D Data is divided into 100 sec bins |
 |
 |
| Parameter | Plot |
|---|---|
| CZT HV Monitor |  |
| D_VDD | 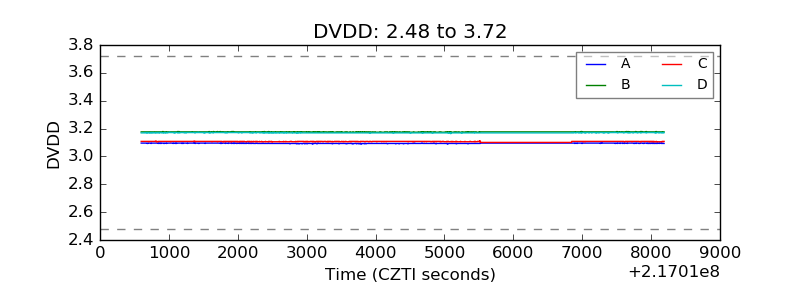 |
| Temperature 1 | 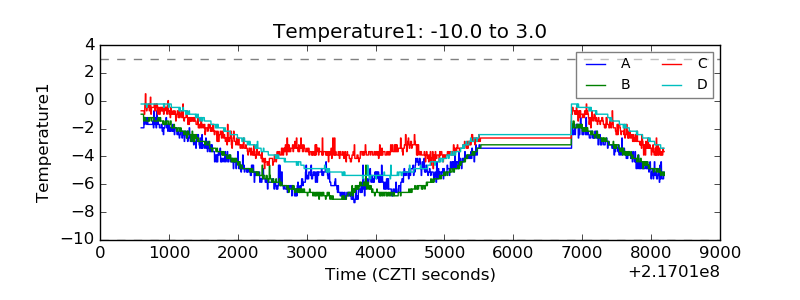 |
| Veto HV Monitor | 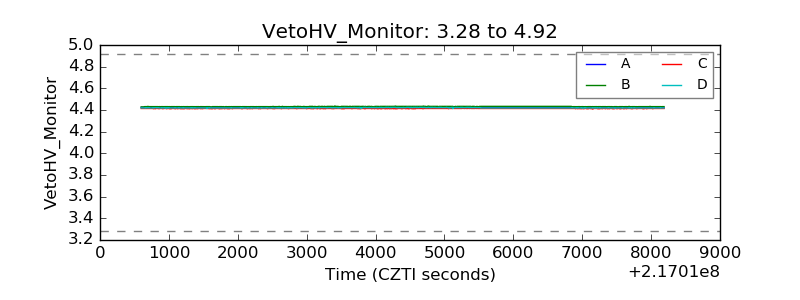 |
| Veto LLD | 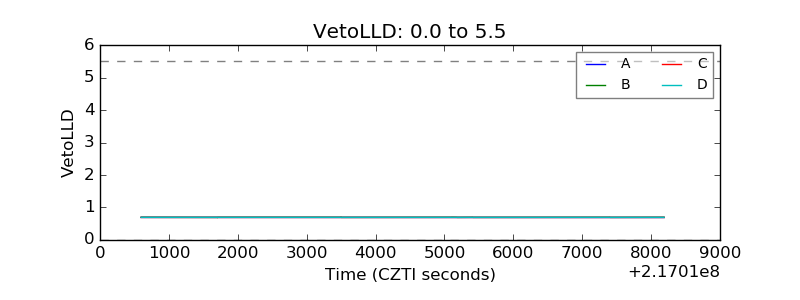 |
| Alpha Counter | 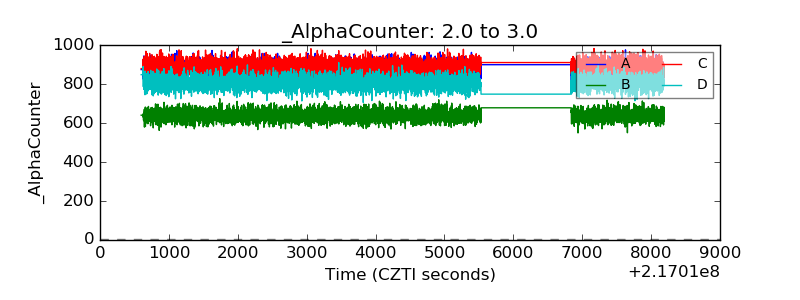 |
| _CPM_Rate | 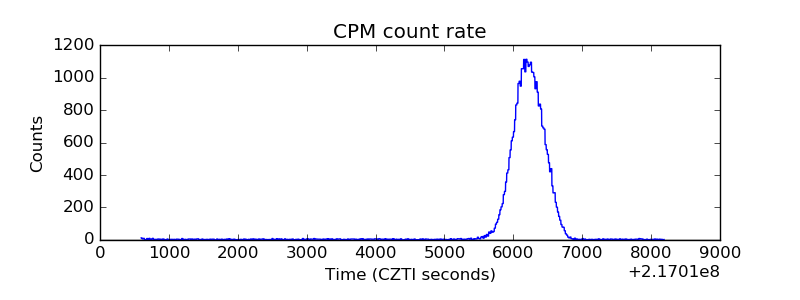 |
| CZT Counter | 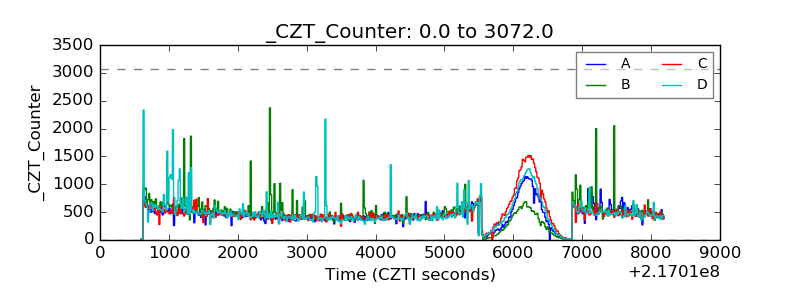 |
| +2.5 Volts monitor |  |
| +5 Volts monitor | 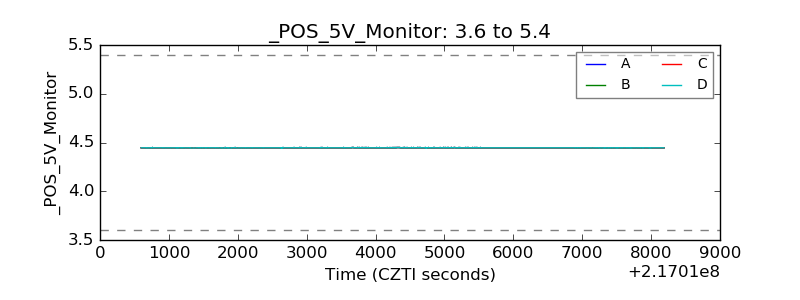 |
| _ROLL_ROT | 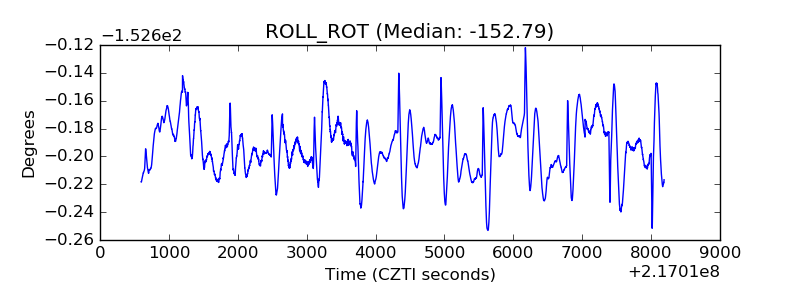 |
| _Roll_DEC | 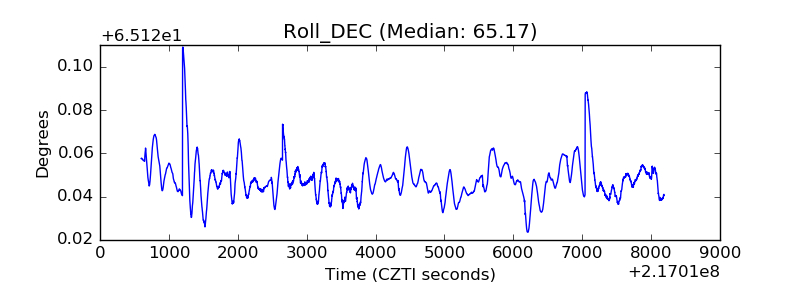 |
| _Roll_RA | 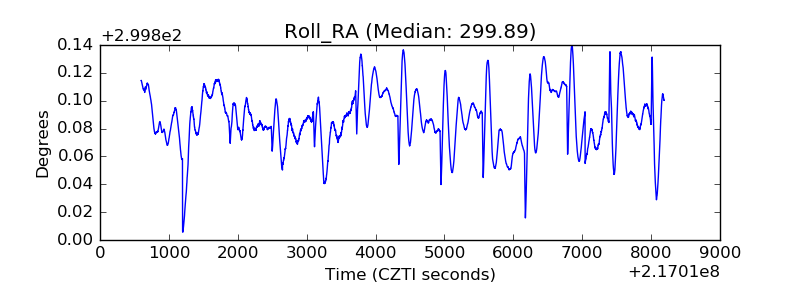 |
| Veto Counter | 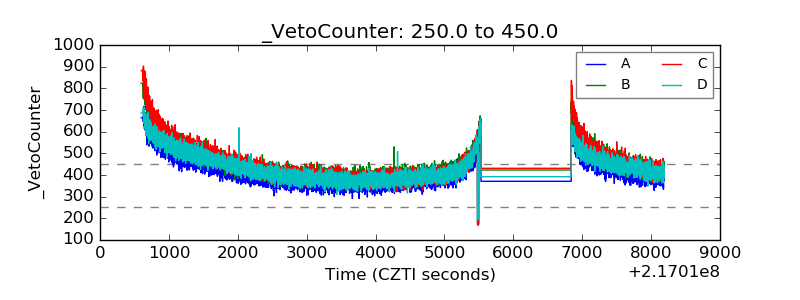 |