| Param | Original file | Final file |
|---|---|---|
| Filename | modeM0/AS1A02_199T01_9000000800_06153cztM0_level2.evt | modeM0/AS1A02_199T01_9000000800_06153cztM0_level2_quad_clean.evt |
| Size (bytes) | 420,739,200 | 102,401,280 |
| Size | 401.2 MB | 97.7 MB |
| Events in quadrant A | 3,018,131 | 672,830 |
| Events in quadrant B | 3,466,933 | 679,484 |
| Events in quadrant C | 2,861,693 | 668,849 |
| Events in quadrant D | 2,959,459 | 633,221 |
| Mode SS | |||
|---|---|---|---|
| Quadrant | BADHDUFLAG | Total packets | Discarded packets |
| A | 0 | 130 | 0 |
| B | 0 | 130 | 0 |
| C | 0 | 130 | 0 |
| D | 0 | 130 | 0 |
| Mode M9 | |||
|---|---|---|---|
| Quadrant | BADHDUFLAG | Total packets | Discarded packets |
| A | 0 | 11 | 0 |
| B | 0 | 11 | 0 |
| C | 0 | 11 | 0 |
| D | 0 | 11 | 0 |
| Mode M0 | |||
|---|---|---|---|
| Quadrant | BADHDUFLAG | Total packets | Discarded packets |
| A | 0 | 13355 | 3 |
| B | 0 | 14682 | 2 |
| C | 0 | 13060 | 2 |
| D | 0 | 13496 | 2 |
| Quadrant | Total seconds | Saturated seconds | Saturation percentage |
|---|---|---|---|
| A | 6407 | 23 | 0.358982% |
| B | 6407 | 94 | 1.467145% |
| C | 6407 | 31 | 0.483846% |
| D | 6408 | 33 | 0.514981% |
Noise dominated data is calculated using 1-second bins in cleaned event files. If a bin has >2000 counts, and if more than 50% of those come from <1% of pixels, then it is considered to be noise-dominated and hence unusable.
| Quadrant | # 1 sec bins | Bins with >0 counts | Bins with >2000 counts | High rate bins dominated by noise | Noise dominated (total time) | Noise dominated (detector-on time) | Marked lightcurve |
|---|---|---|---|---|---|---|---|
| A | 7507 | 6408 | 3 | 3 | 0.04% | 0.05% | 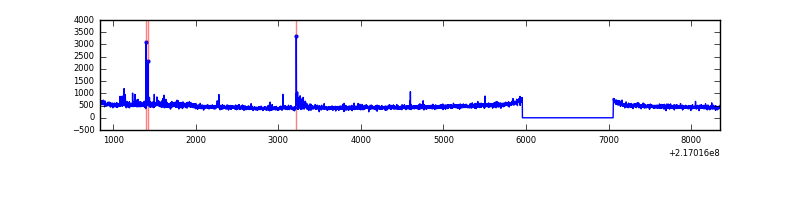 |
| B | 7507 | 6408 | 52 | 52 | 0.69% | 0.81% | 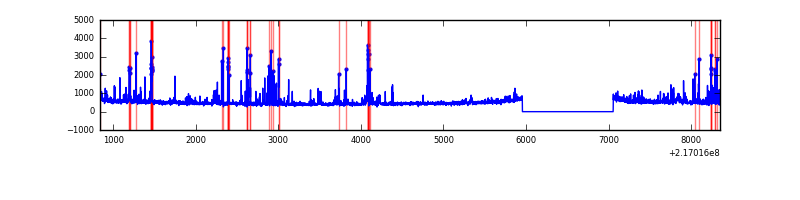 |
| C | 7507 | 6408 | 0 | 0 | 0.00% | 0.00% | 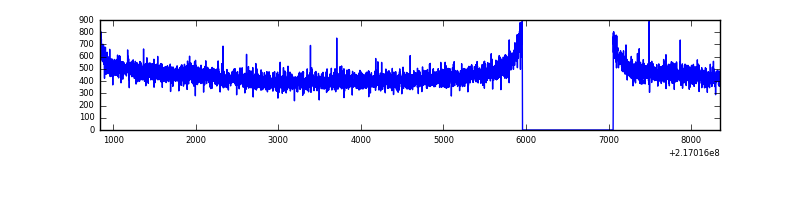 |
| D | 7508 | 6409 | 4 | 4 | 0.05% | 0.06% | 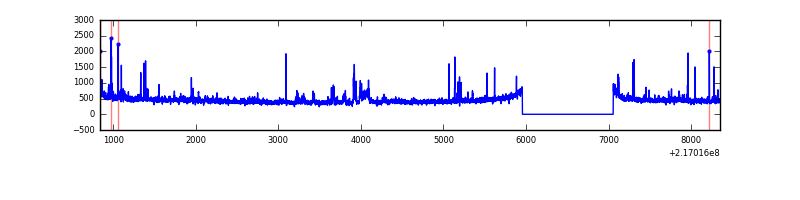 |
Top three noisy pixels from each quadrant. If the there are fewer than three noisy pixels in the level2.evt file, extra rows are filled as -1
| Pixel properties | Quadrant properties | ||||||
|---|---|---|---|---|---|---|---|
| Quadrant | DetID | PixID | Counts | Sigma | Mean | Median | Sigma |
| A | 8 | 15 | 132779 | 891.59 | 737 | 722 | 148.1 |
| A | 0 | 50 | 36959 | 244.66 | 737 | 722 | 148.1 |
| A | 12 | 194 | 7231 | 43.95 | 737 | 722 | 148.1 |
| B | 3 | 64 | 349556 | 2494.18 | 743 | 726 | 139.9 |
| B | 0 | 219 | 93616 | 664.17 | 743 | 726 | 139.9 |
| B | 15 | 204 | 85444 | 605.74 | 743 | 726 | 139.9 |
| C | 1 | 16 | 9534 | 52.14 | 730 | 732 | 168.8 |
| C | 13 | 61 | 5821 | 30.14 | 730 | 732 | 168.8 |
| C | 8 | 222 | 3081 | 13.91 | 730 | 732 | 168.8 |
| D | 13 | 169 | 136974 | 774.64 | 722 | 699 | 175.9 |
| D | 5 | 97 | 45334 | 253.72 | 722 | 699 | 175.9 |
| D | 8 | 195 | 17698 | 96.63 | 722 | 699 | 175.9 |
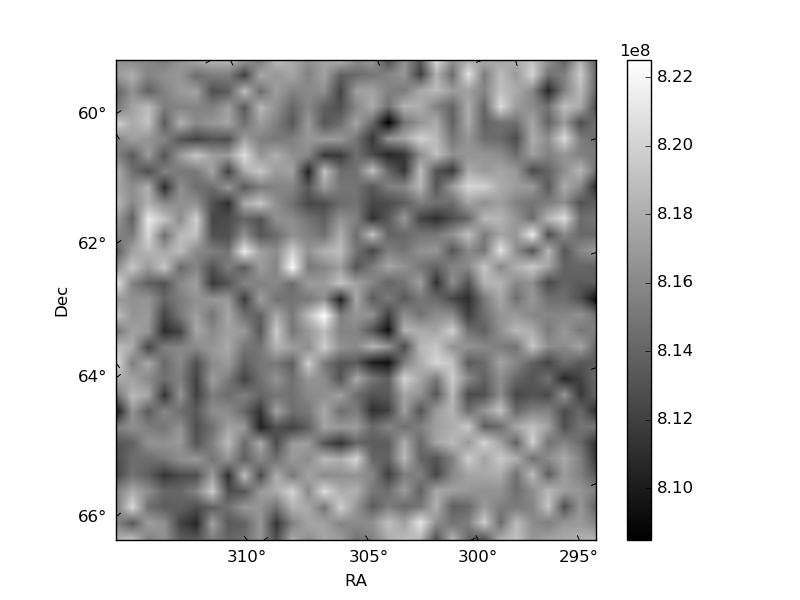
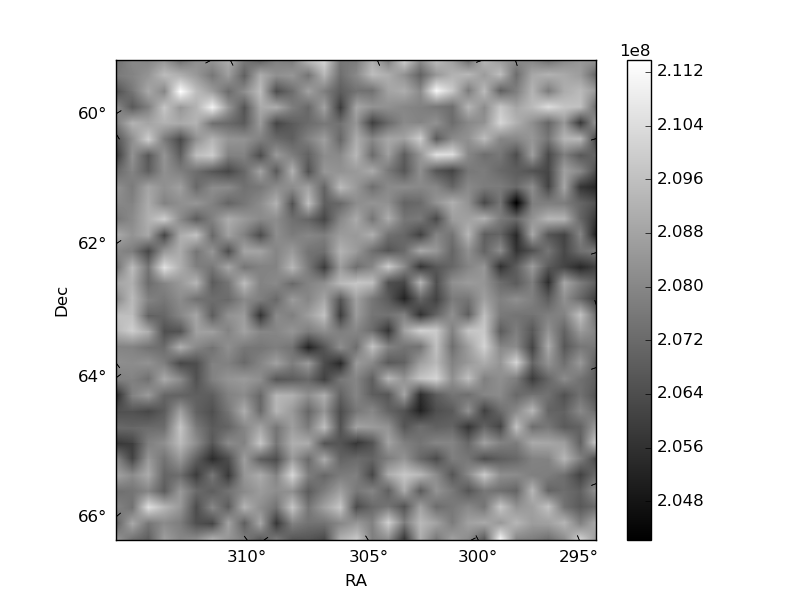
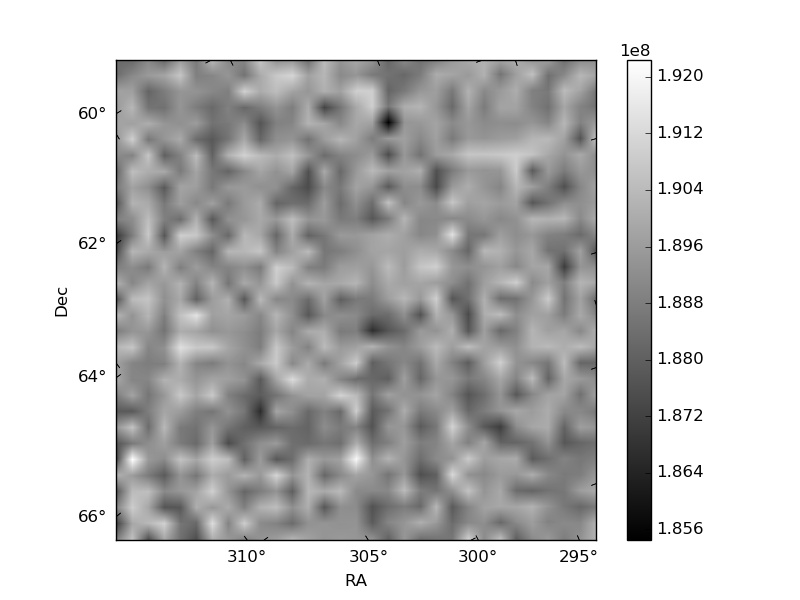
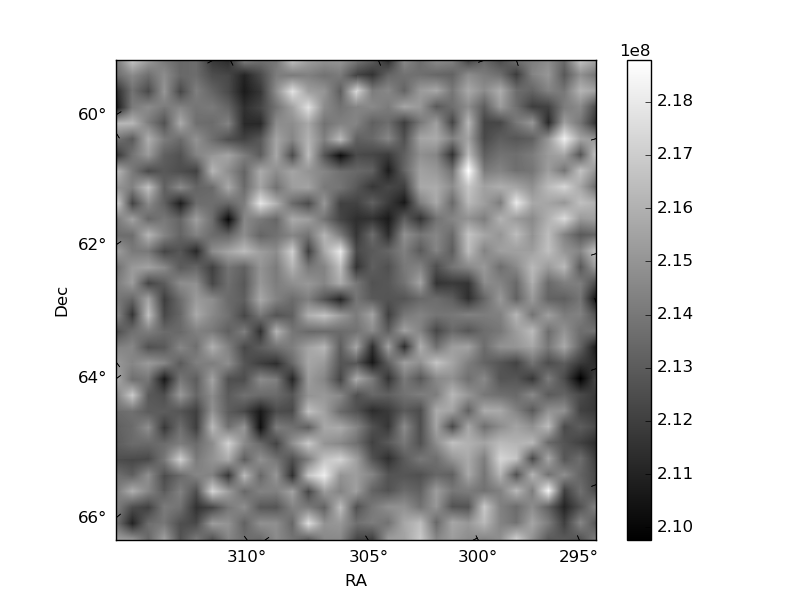
Histogram calculated using DETX and DETY for each event in the final _common_clean file
| Quadrant A | 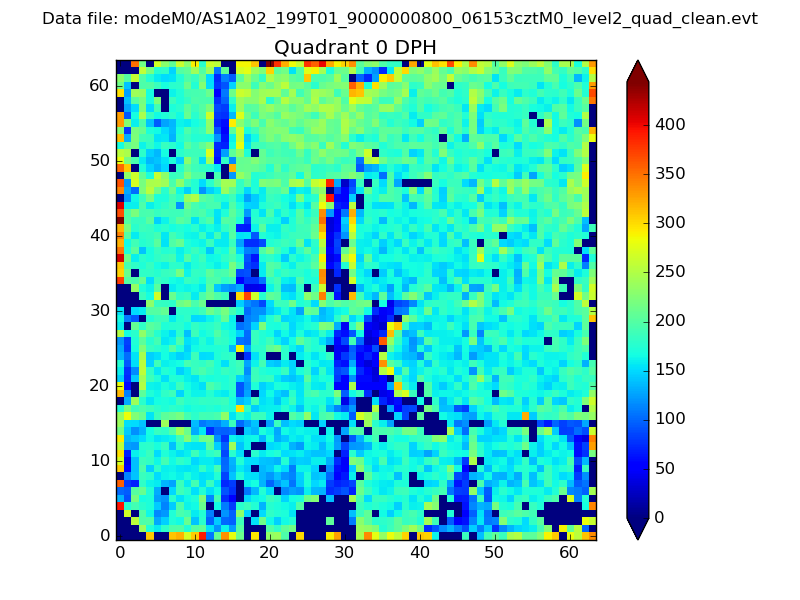 |
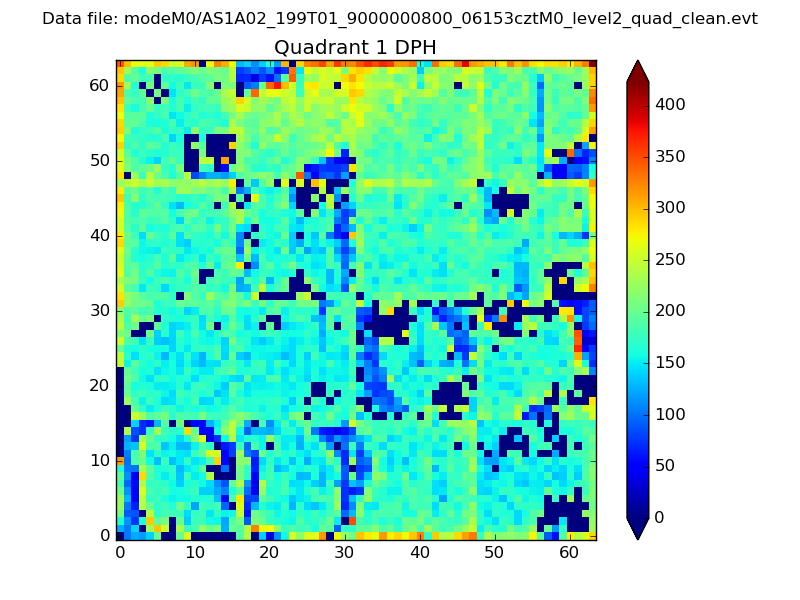 |
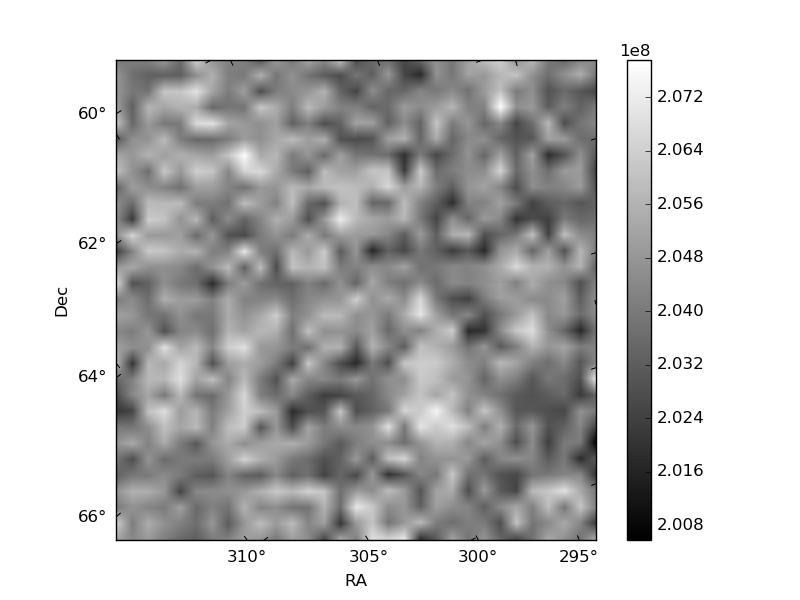
Quadrant B |
|---|---|---|---|
| Quadrant D | 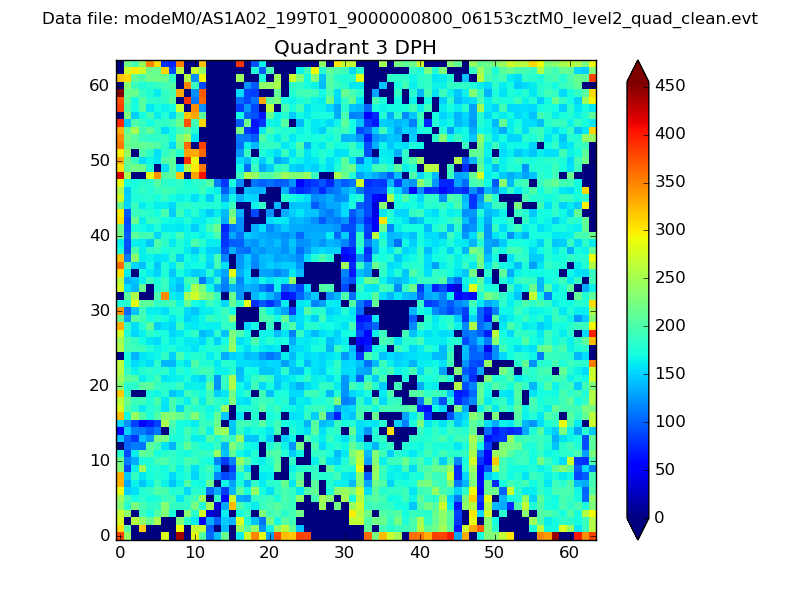 |
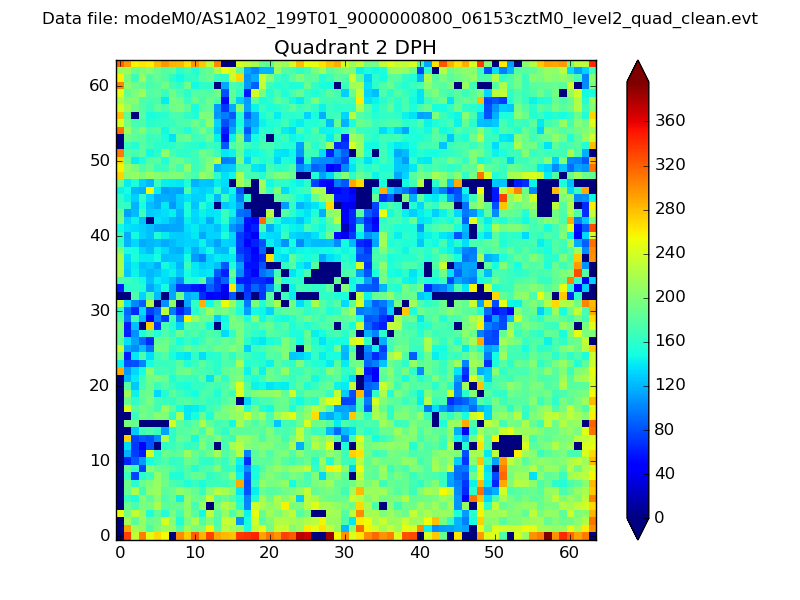 |
Quadrant C |
| Plot type | Count rate plots | Images |
|---|---|---|
| Comparison with Poisson distribution Blue bars denote a histogram of data divided into 1 sec bins. Red curve is a Poisson curve with rate = median count rate of data. |
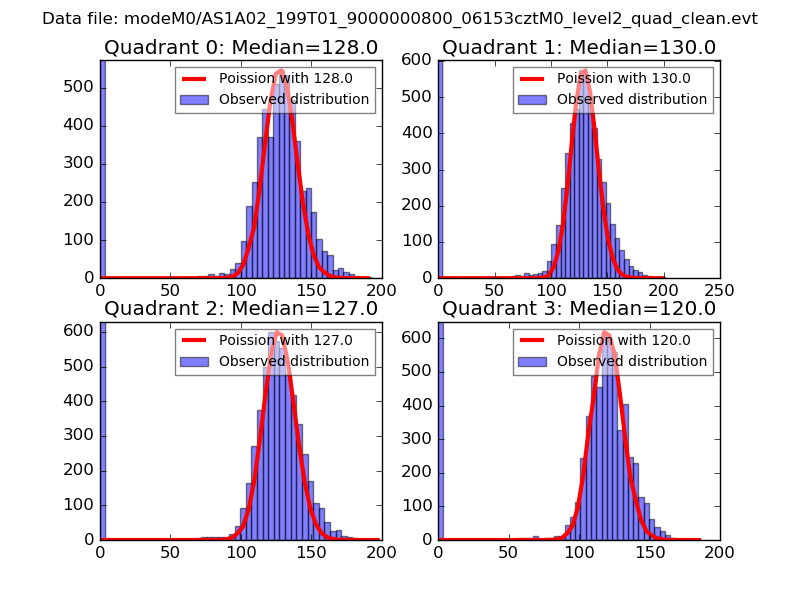 |
 |
| Quadrant-wise count rates Data is divided into 100 sec bins |
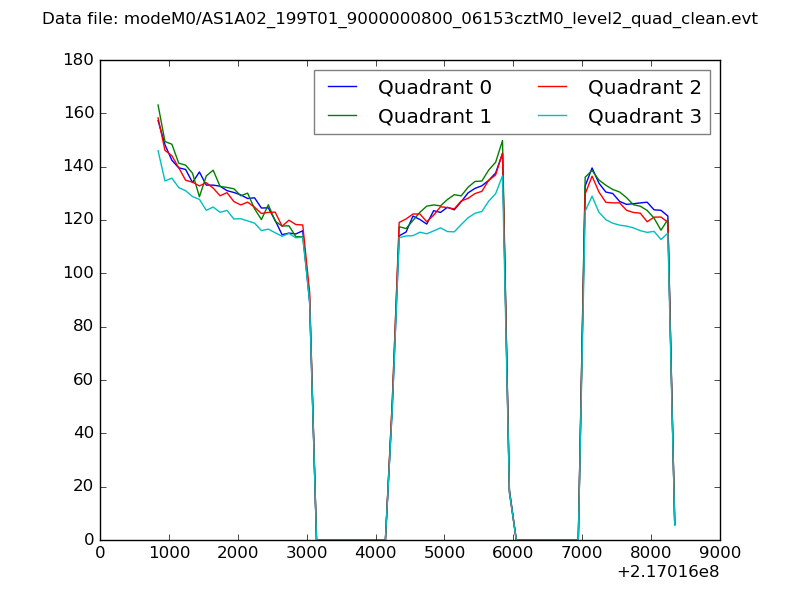 |
|
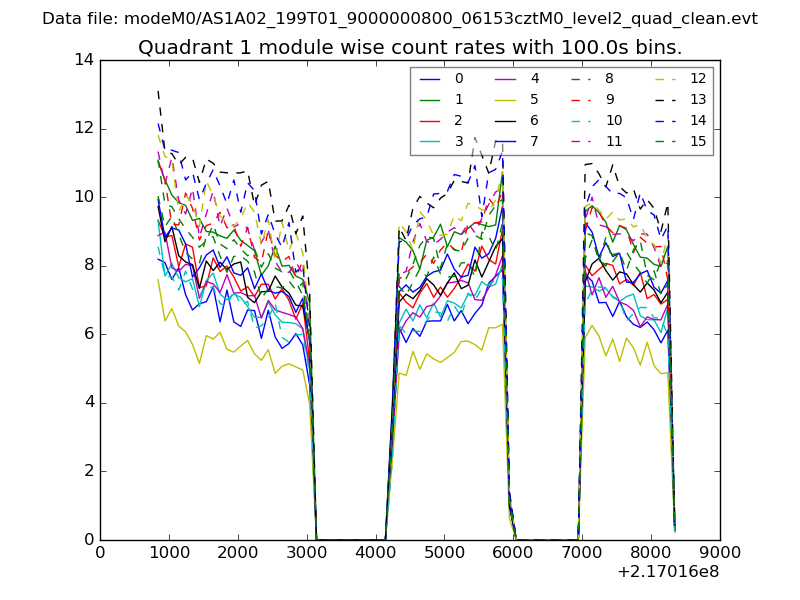
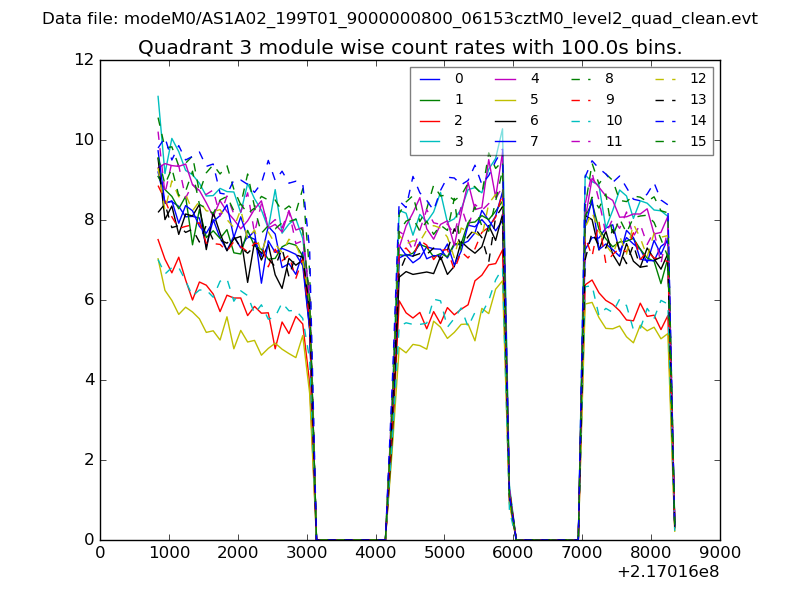
| Module-wise count rates for Quadrant A Data is divided into 100 sec bins |
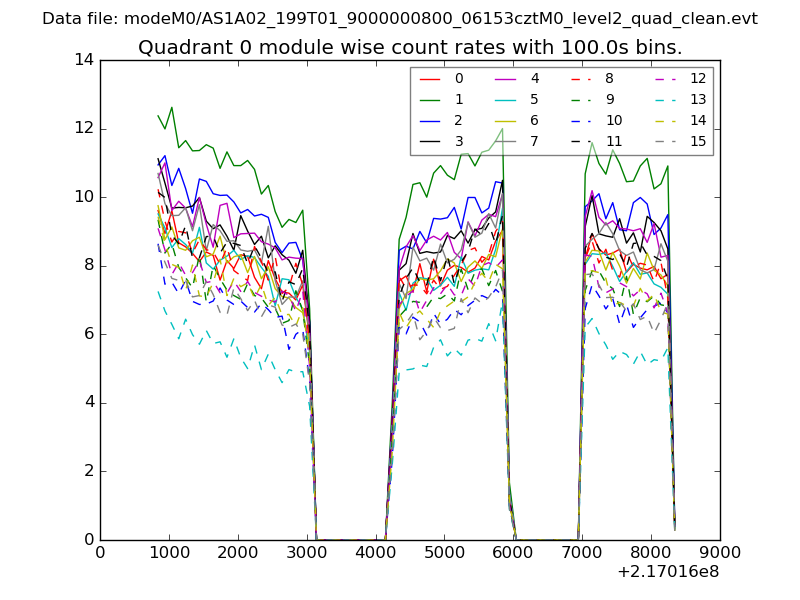 |
 |
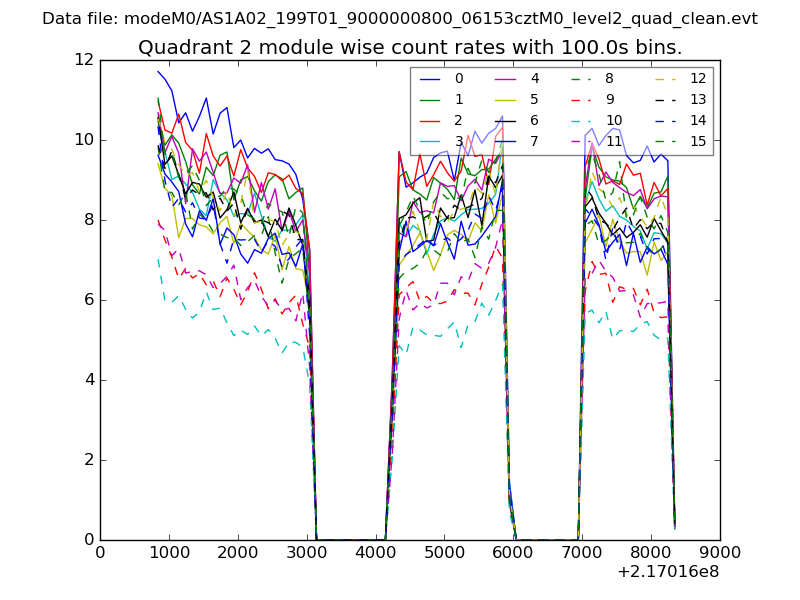
| Module-wise count rates for Quadrant B Data is divided into 100 sec bins |
 |
 |
| Module-wise count rates for Quadrant C Data is divided into 100 sec bins |
 |
 |
| Module-wise count rates for Quadrant D Data is divided into 100 sec bins |
 |
 |
| Parameter | Plot |
|---|---|
| CZT HV Monitor | 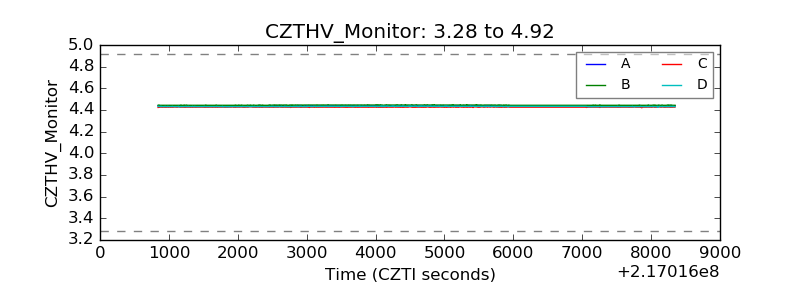 |
| D_VDD | 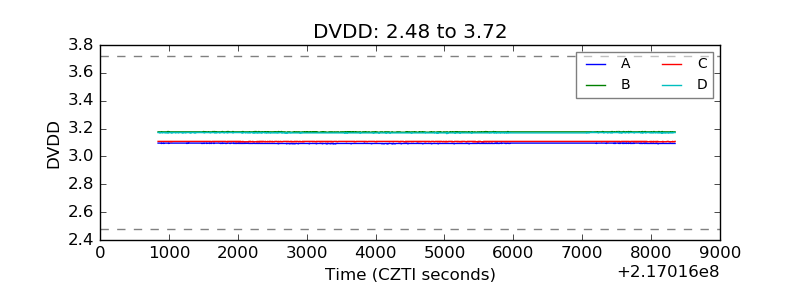 |
| Temperature 1 | 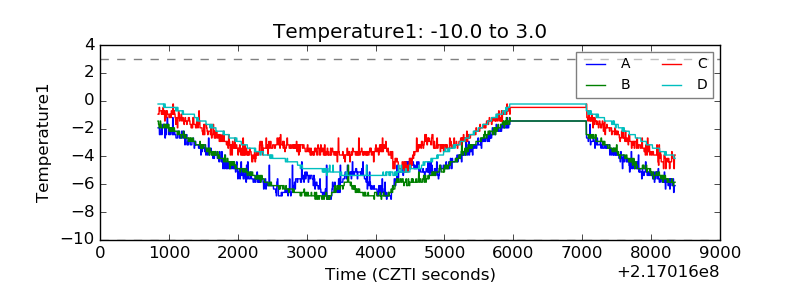 |
| Veto HV Monitor | 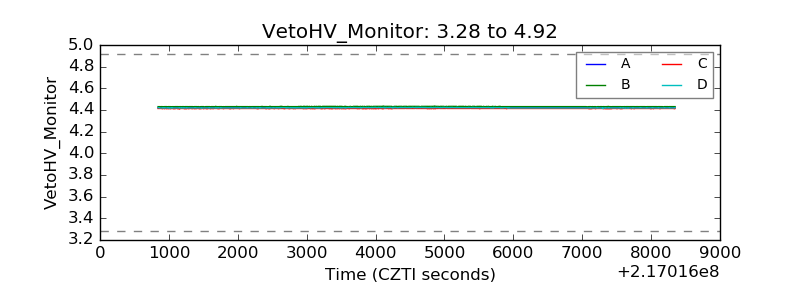 |
| Veto LLD | 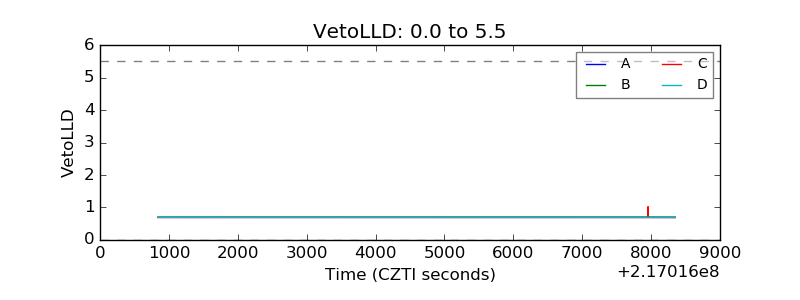 |
| Alpha Counter | 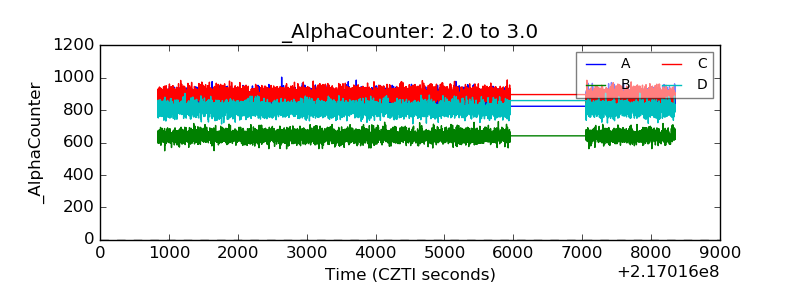 |
| _CPM_Rate |  |
| CZT Counter | 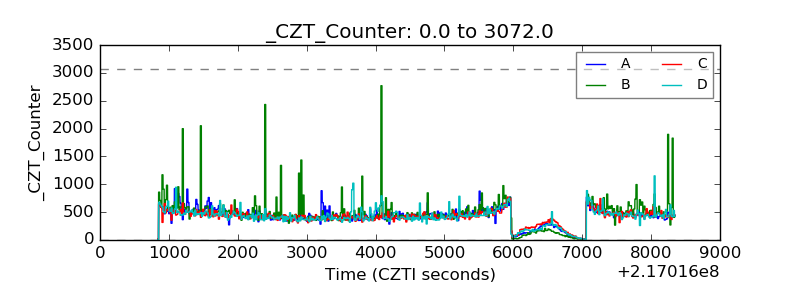 |
| +2.5 Volts monitor |  |
| +5 Volts monitor | 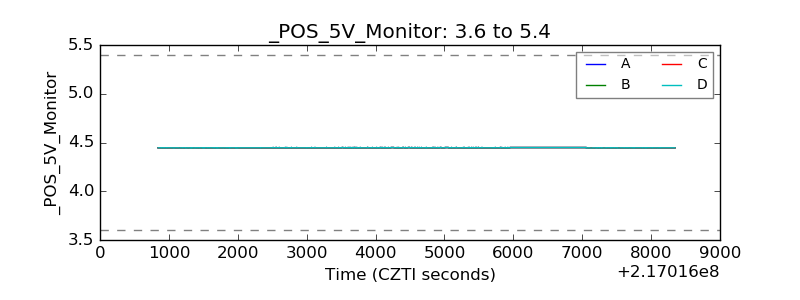 |
| _ROLL_ROT | 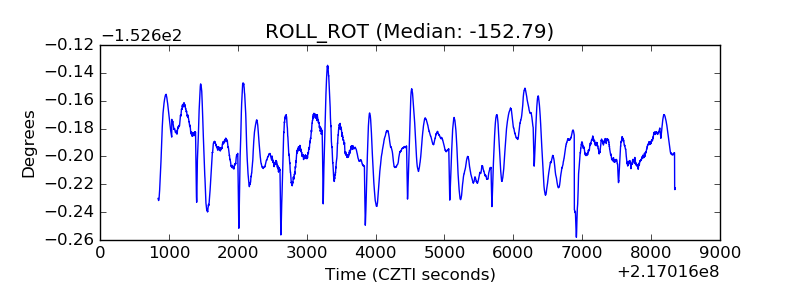 |
| _Roll_DEC | 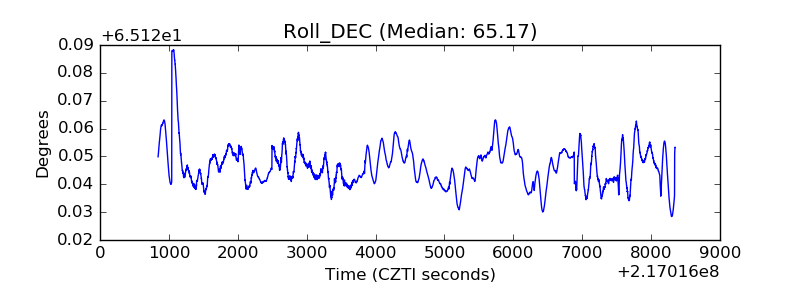 |
| _Roll_RA | 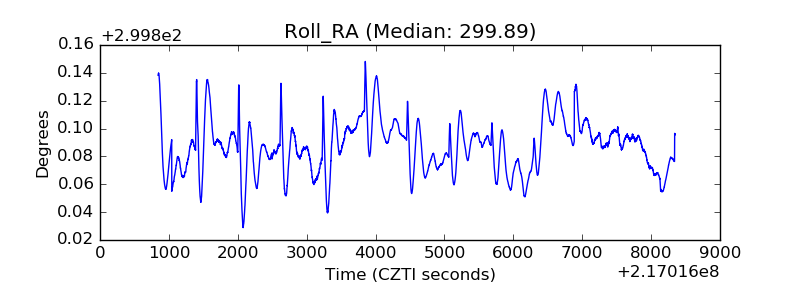 |
| Veto Counter | 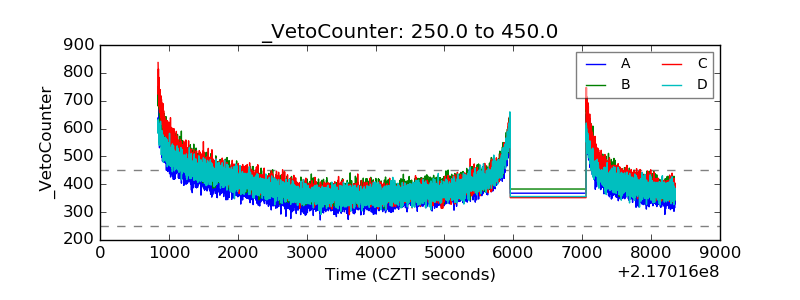 |