| Param | Original file | Final file |
|---|---|---|
| Filename | modeM0/AS1A02_199T01_9000000800_06154cztM0_level2.evt | modeM0/AS1A02_199T01_9000000800_06154cztM0_level2_quad_clean.evt |
| Size (bytes) | 437,950,080 | 106,620,480 |
| Size | 417.7 MB | 101.7 MB |
| Events in quadrant A | 3,050,318 | 700,151 |
| Events in quadrant B | 3,696,843 | 702,693 |
| Events in quadrant C | 2,981,554 | 692,210 |
| Events in quadrant D | 3,069,051 | 657,218 |
| Mode SS | |||
|---|---|---|---|
| Quadrant | BADHDUFLAG | Total packets | Discarded packets |
| A | 0 | 140 | 0 |
| B | 0 | 140 | 0 |
| C | 0 | 140 | 0 |
| D | 0 | 140 | 0 |
| Mode M9 | |||
|---|---|---|---|
| Quadrant | BADHDUFLAG | Total packets | Discarded packets |
| A | 0 | 16 | 0 |
| B | 0 | 16 | 0 |
| C | 0 | 16 | 0 |
| D | 0 | 17 | 0 |
| Mode M0 | |||
|---|---|---|---|
| Quadrant | BADHDUFLAG | Total packets | Discarded packets |
| A | 0 | 14034 | 5 |
| B | 0 | 15846 | 2 |
| C | 0 | 13936 | 2 |
| D | 0 | 14336 | 4 |
| Quadrant | Total seconds | Saturated seconds | Saturation percentage |
|---|---|---|---|
| A | 6840 | 35 | 0.511696% |
| B | 6841 | 126 | 1.841836% |
| C | 6841 | 29 | 0.423915% |
| D | 6840 | 49 | 0.716374% |
Noise dominated data is calculated using 1-second bins in cleaned event files. If a bin has >2000 counts, and if more than 50% of those come from <1% of pixels, then it is considered to be noise-dominated and hence unusable.
| Quadrant | # 1 sec bins | Bins with >0 counts | Bins with >2000 counts | High rate bins dominated by noise | Noise dominated (total time) | Noise dominated (detector-on time) | Marked lightcurve |
|---|---|---|---|---|---|---|---|
| A | 7581 | 6842 | 0 | 0 | 0.00% | 0.00% | 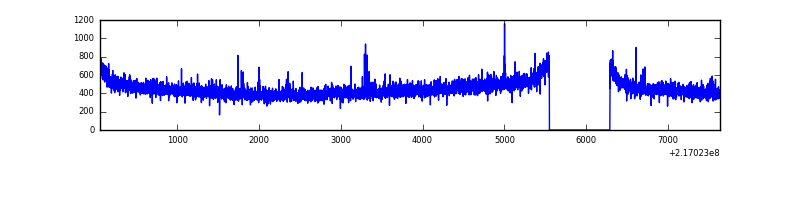 |
| B | 7581 | 6842 | 43 | 43 | 0.57% | 0.63% | 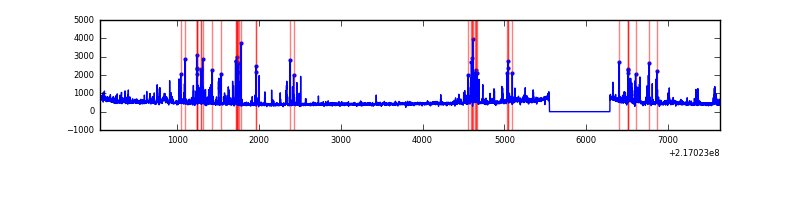 |
| C | 7581 | 6842 | 0 | 0 | 0.00% | 0.00% | 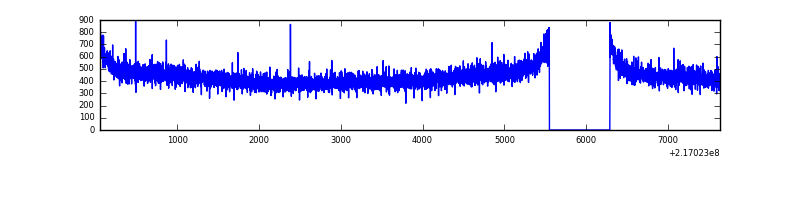 |
| D | 7581 | 6842 | 11 | 11 | 0.15% | 0.16% | 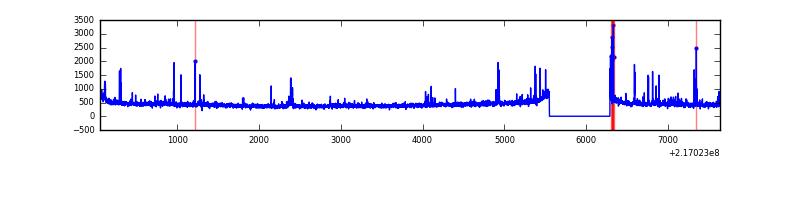 |
Top three noisy pixels from each quadrant. If the there are fewer than three noisy pixels in the level2.evt file, extra rows are filled as -1
| Pixel properties | Quadrant properties | ||||||
|---|---|---|---|---|---|---|---|
| Quadrant | DetID | PixID | Counts | Sigma | Mean | Median | Sigma |
| A | 8 | 15 | 65866 | 416.84 | 773 | 755 | 156.2 |
| A | 0 | 226 | 7569 | 43.62 | 773 | 755 | 156.2 |
| A | 12 | 194 | 7438 | 42.78 | 773 | 755 | 156.2 |
| B | 3 | 64 | 477298 | 3188.93 | 781 | 762 | 149.4 |
| B | 15 | 204 | 62319 | 411.93 | 781 | 762 | 149.4 |
| B | 0 | 219 | 43419 | 285.46 | 781 | 762 | 149.4 |
| C | 1 | 16 | 8658 | 44.65 | 761 | 764 | 176.8 |
| C | 13 | 61 | 6039 | 29.84 | 761 | 764 | 176.8 |
| C | 8 | 222 | 3785 | 17.09 | 761 | 764 | 176.8 |
| D | 5 | 97 | 71850 | 383.52 | 755 | 731 | 185.4 |
| D | 13 | 169 | 63196 | 336.85 | 755 | 731 | 185.4 |
| D | 8 | 195 | 38223 | 202.18 | 755 | 731 | 185.4 |
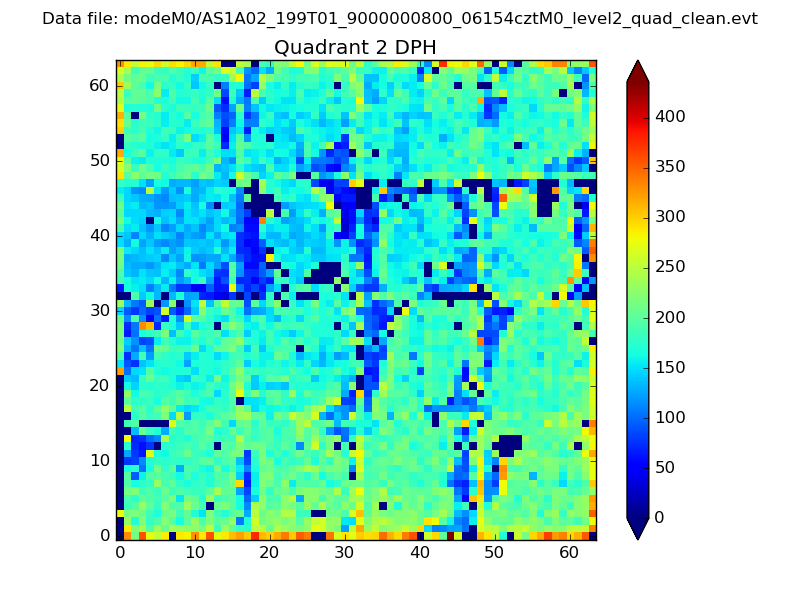
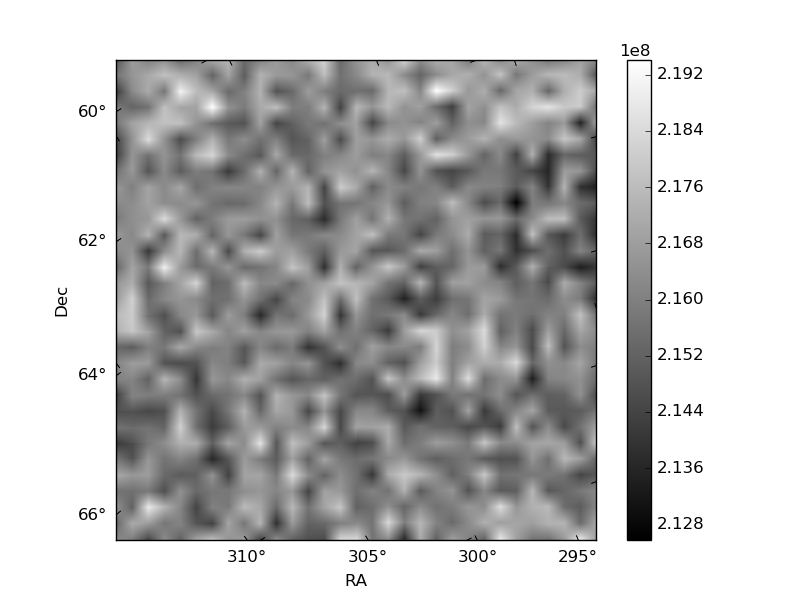
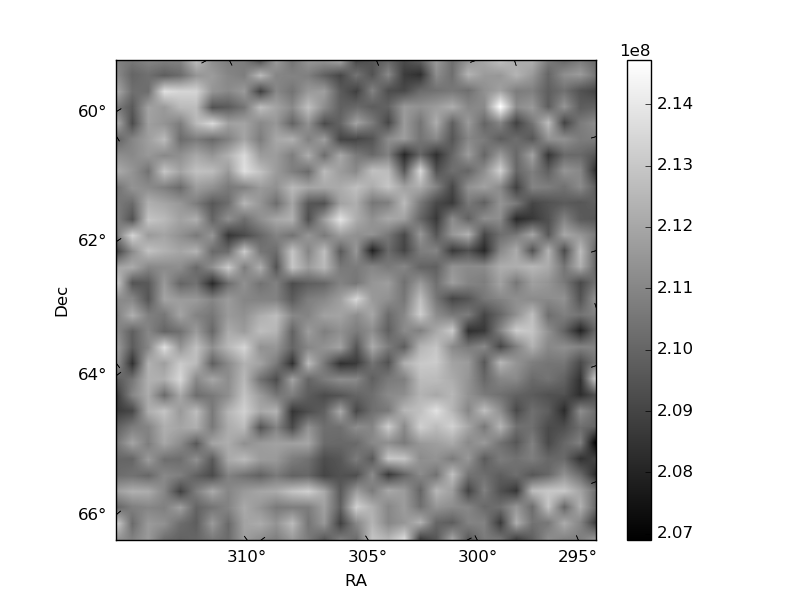
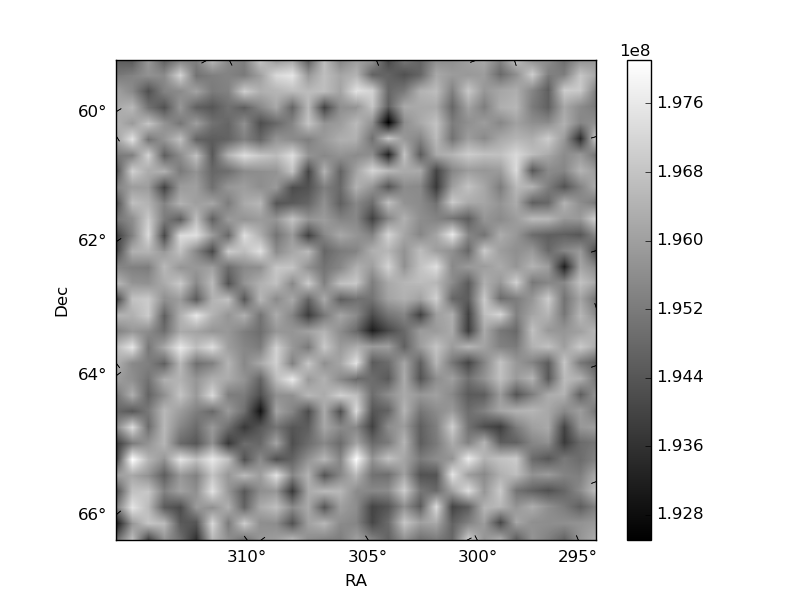
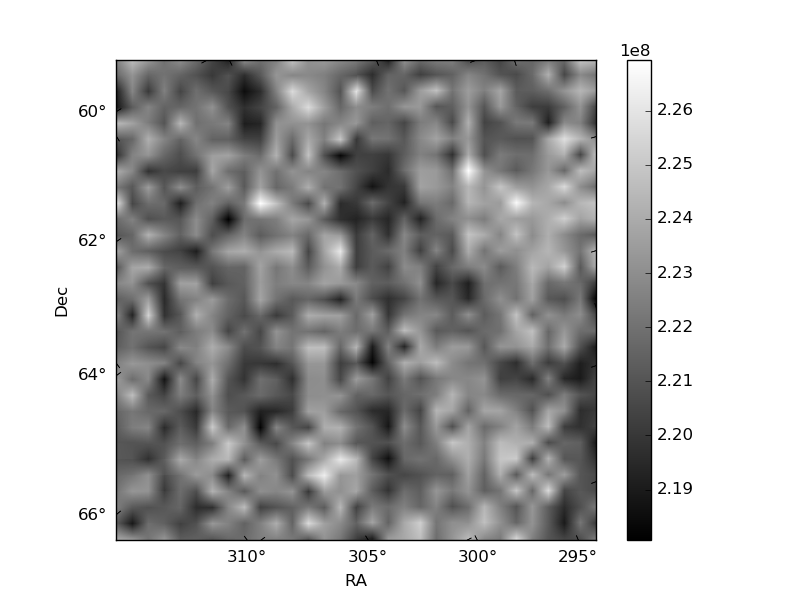
Histogram calculated using DETX and DETY for each event in the final _common_clean file
| Quadrant A | 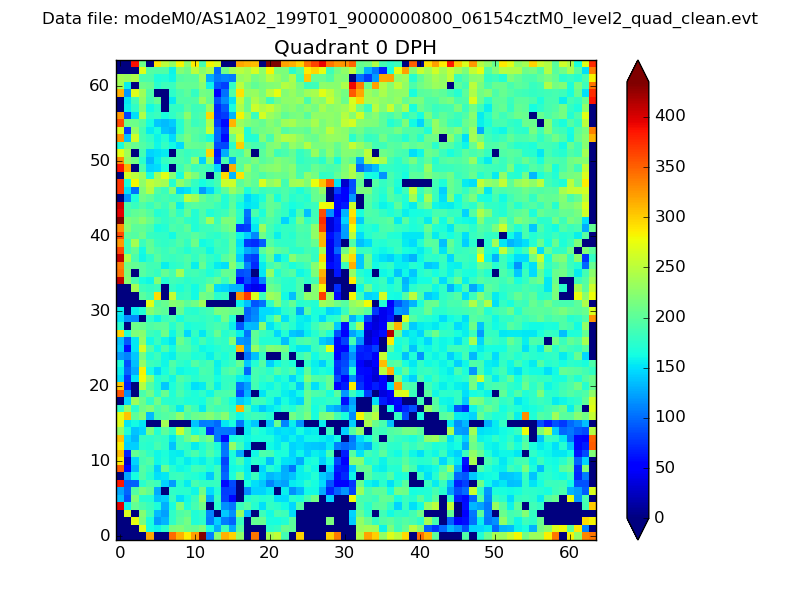 |
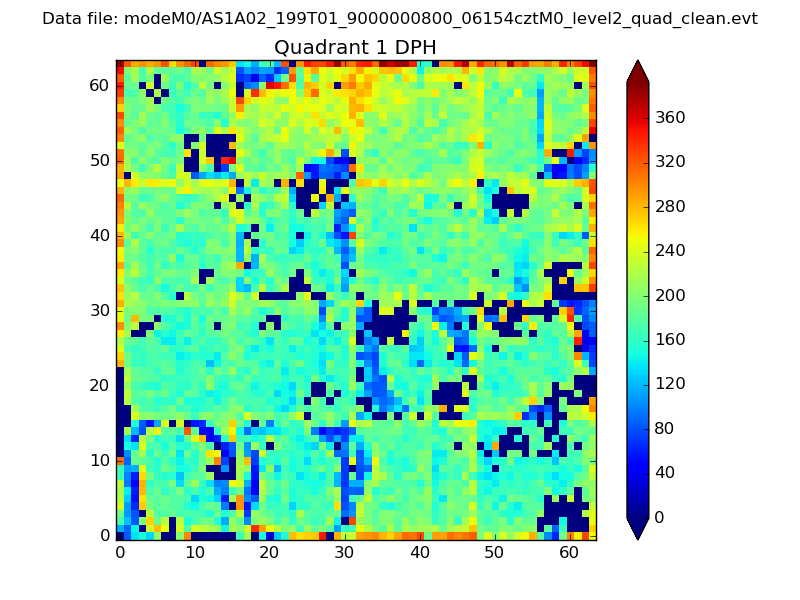 |
Quadrant B |
|---|---|---|---|
| Quadrant D | 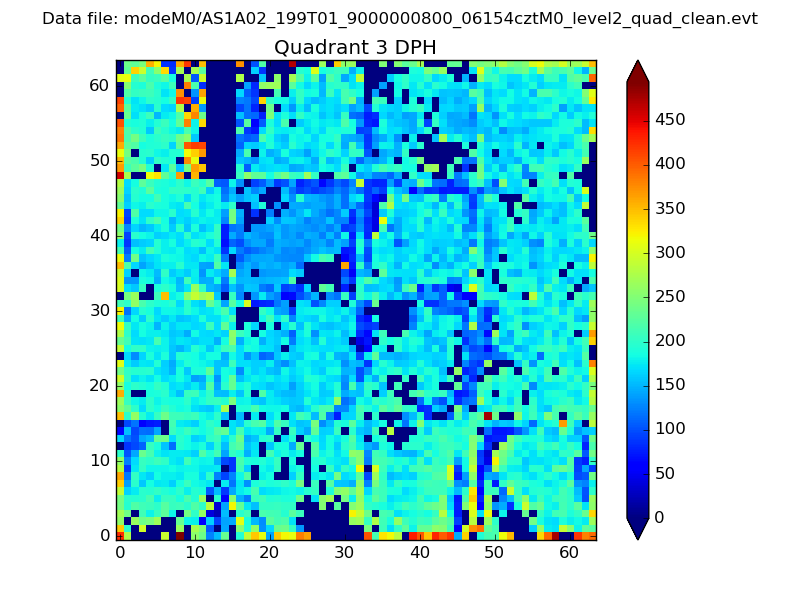 |
 |
Quadrant C |
| Plot type | Count rate plots | Images |
|---|---|---|
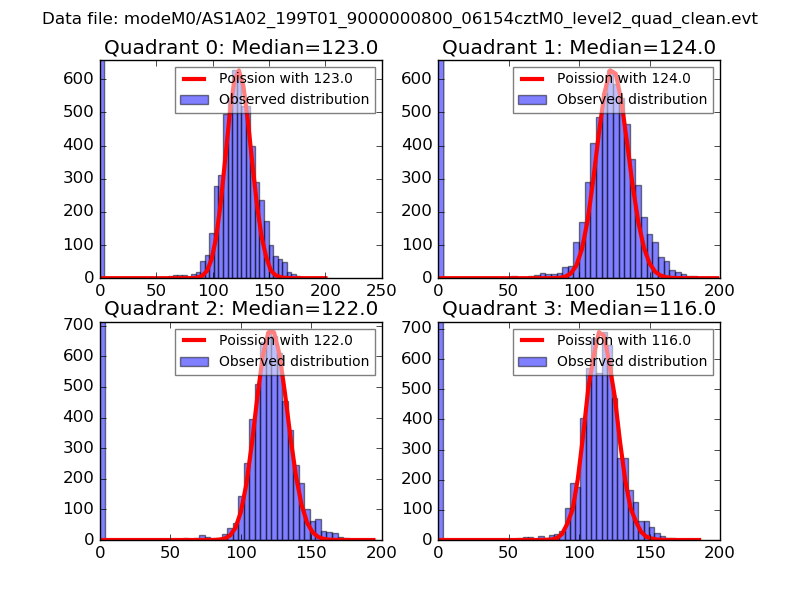
| Comparison with Poisson distribution Blue bars denote a histogram of data divided into 1 sec bins. Red curve is a Poisson curve with rate = median count rate of data. |
 |
 |
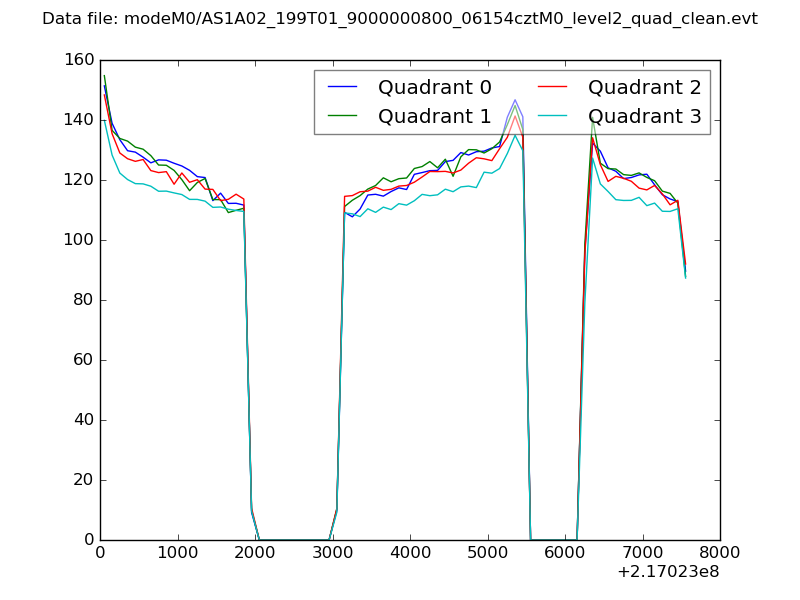
| Quadrant-wise count rates Data is divided into 100 sec bins |
 |
|
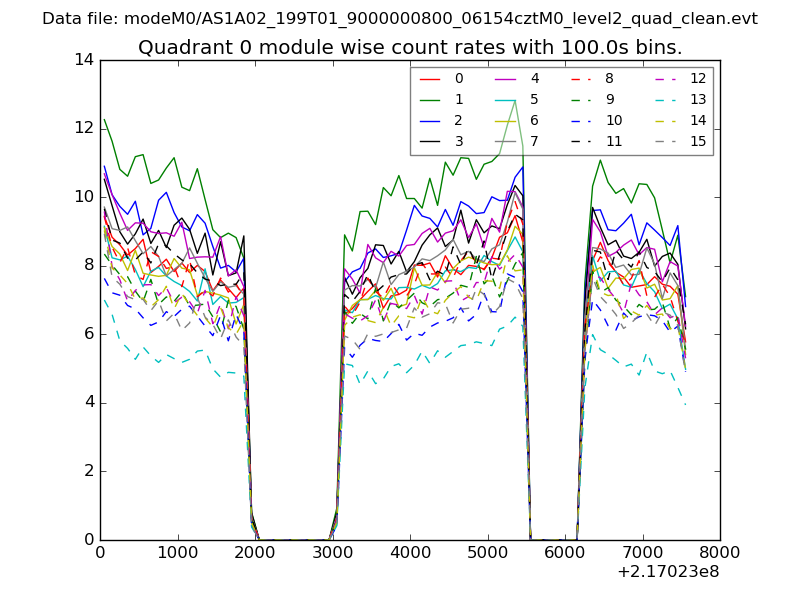
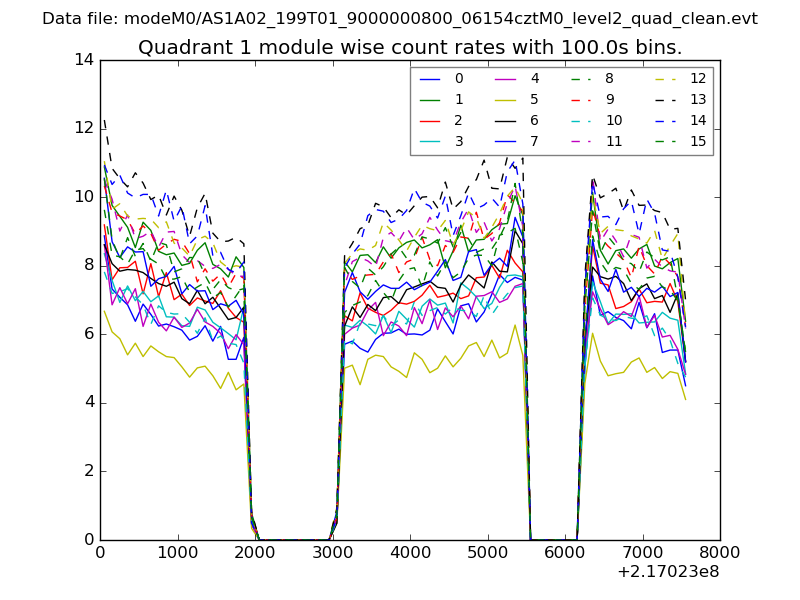
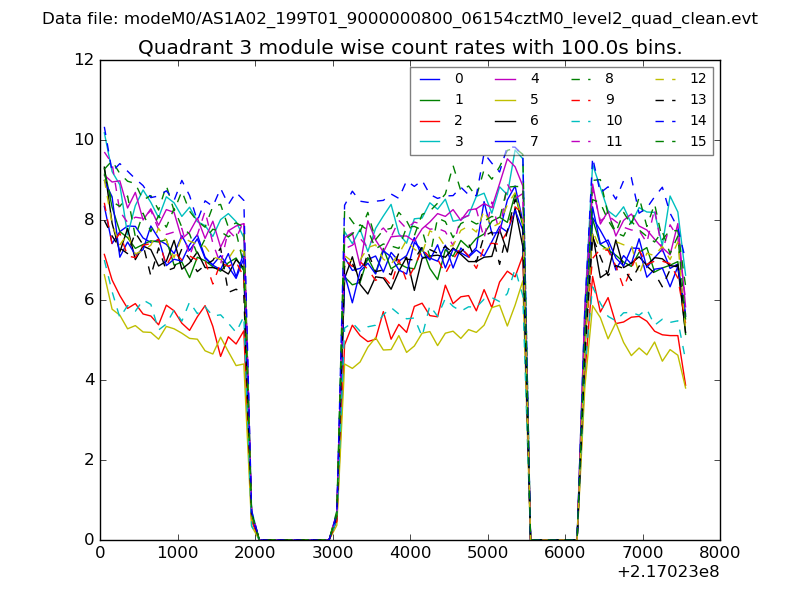
| Module-wise count rates for Quadrant A Data is divided into 100 sec bins |
 |
 |
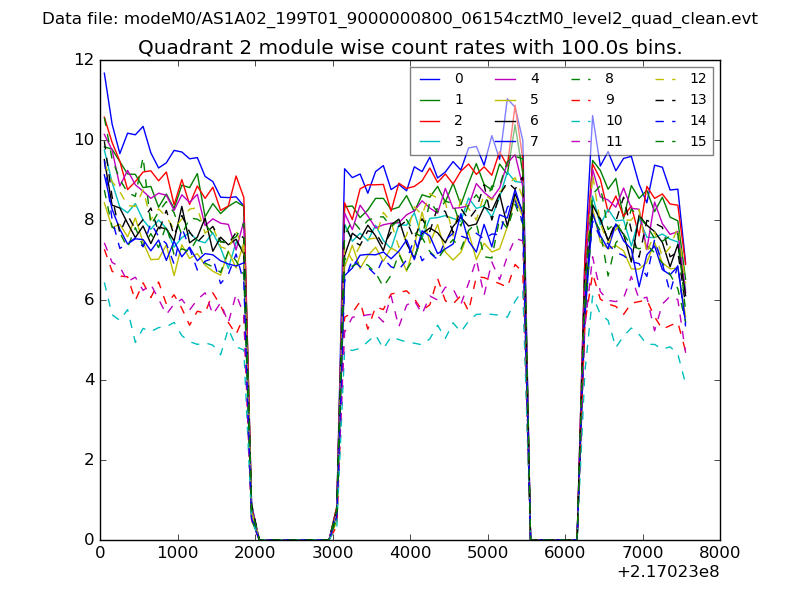
| Module-wise count rates for Quadrant B Data is divided into 100 sec bins |
 |
 |
| Module-wise count rates for Quadrant C Data is divided into 100 sec bins |
 |
 |
| Module-wise count rates for Quadrant D Data is divided into 100 sec bins |
 |
 |
| Parameter | Plot |
|---|---|
| CZT HV Monitor | 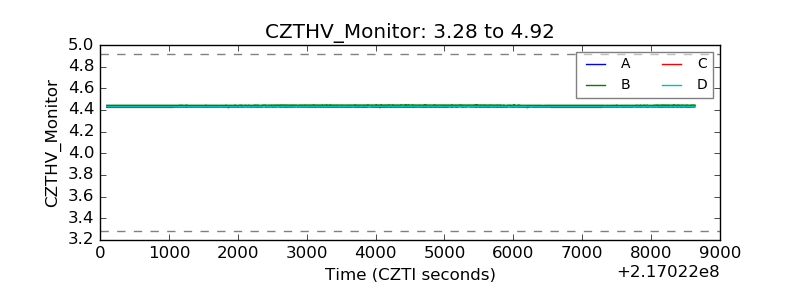 |
| D_VDD | 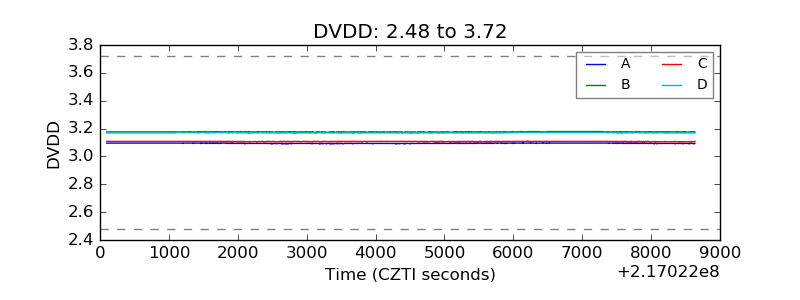 |
| Temperature 1 | 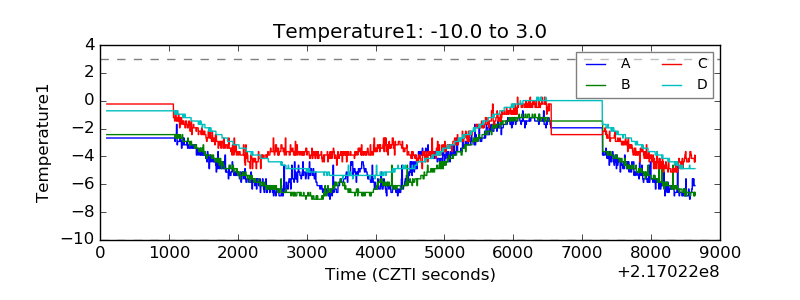 |
| Veto HV Monitor | 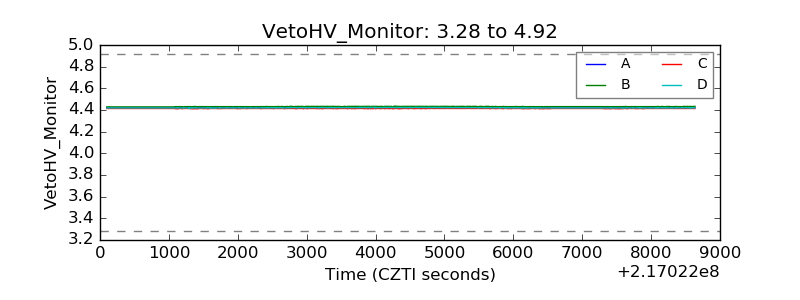 |
| Veto LLD | 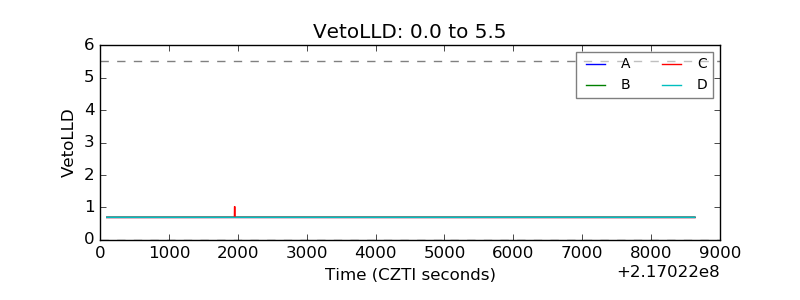 |
| Alpha Counter | 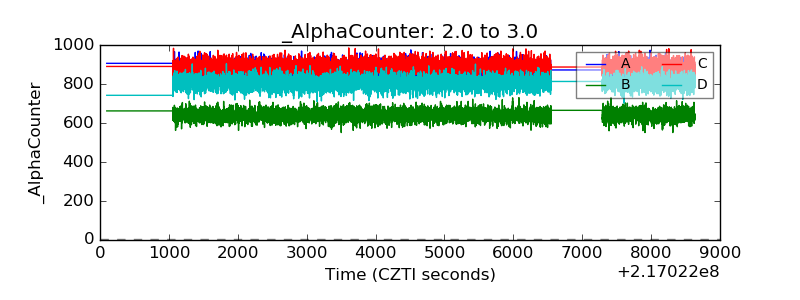 |
| _CPM_Rate | 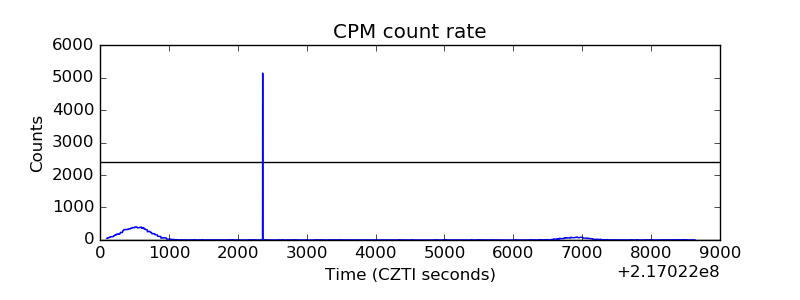 |
| CZT Counter | 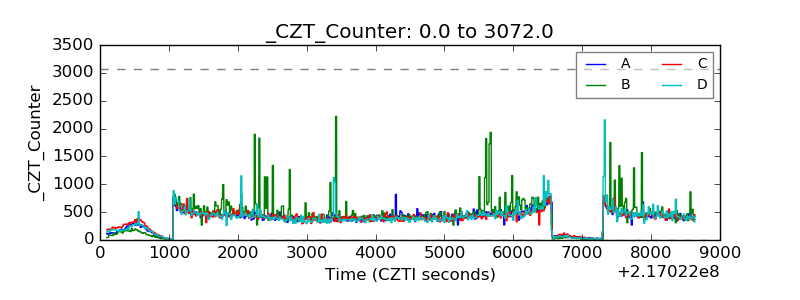 |
| +2.5 Volts monitor |  |
| +5 Volts monitor | 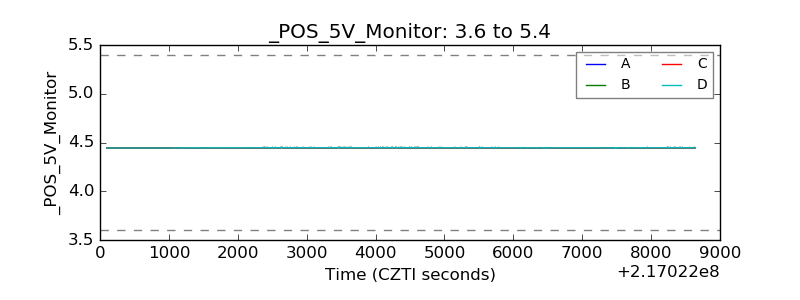 |
| _ROLL_ROT | 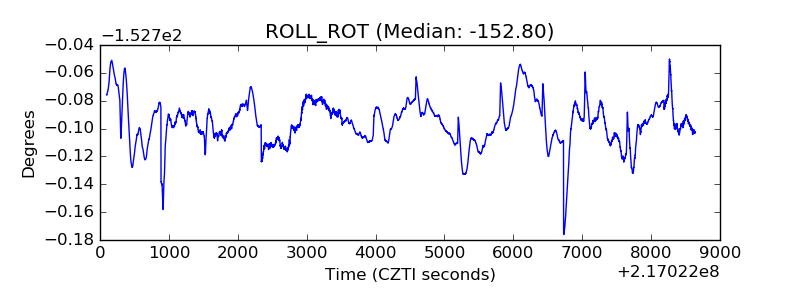 |
| _Roll_DEC | 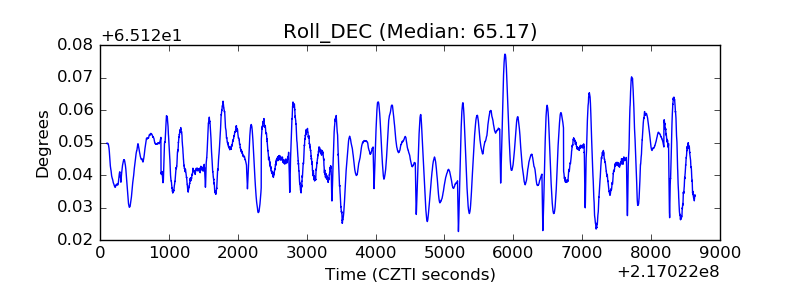 |
| _Roll_RA | 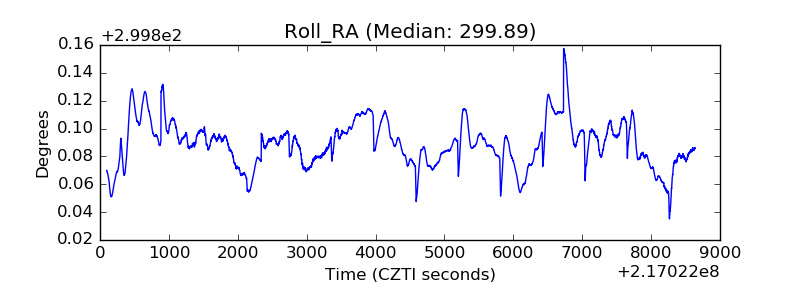 |
| Veto Counter | 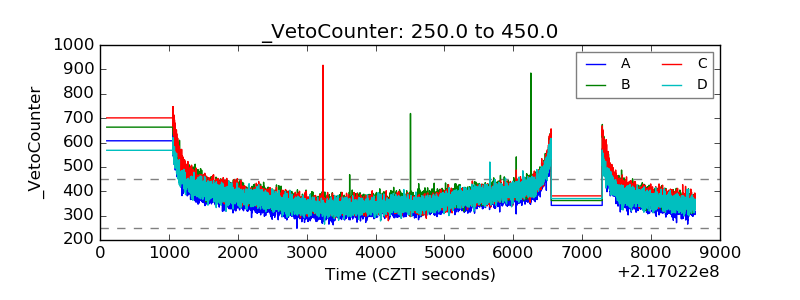 |