| Param | Original file | Final file |
|---|---|---|
| Filename | modeM0/AS1A02_199T01_9000000800_06155cztM0_level2.evt | modeM0/AS1A02_199T01_9000000800_06155cztM0_level2_quad_clean.evt |
| Size (bytes) | 514,909,440 | 115,122,240 |
| Size | 491.1 MB | 109.8 MB |
| Events in quadrant A | 3,640,523 | 753,469 |
| Events in quadrant B | 4,193,490 | 757,529 |
| Events in quadrant C | 3,412,011 | 742,530 |
| Events in quadrant D | 3,822,559 | 695,035 |
| Mode SS | |||
|---|---|---|---|
| Quadrant | BADHDUFLAG | Total packets | Discarded packets |
| A | 0 | 160 | 0 |
| B | 0 | 160 | 0 |
| C | 0 | 160 | 0 |
| D | 0 | 160 | 0 |
| Mode M9 | |||
|---|---|---|---|
| Quadrant | BADHDUFLAG | Total packets | Discarded packets |
| A | 0 | 10 | 0 |
| B | 0 | 10 | 0 |
| C | 0 | 10 | 0 |
| D | 0 | 10 | 0 |
| Mode M0 | |||
|---|---|---|---|
| Quadrant | BADHDUFLAG | Total packets | Discarded packets |
| A | 0 | 16433 | 3 |
| B | 0 | 17913 | 2 |
| C | 0 | 15871 | 2 |
| D | 0 | 17108 | 2 |
| Quadrant | Total seconds | Saturated seconds | Saturation percentage |
|---|---|---|---|
| A | 7730 | 67 | 0.866753% |
| B | 7730 | 194 | 2.509702% |
| C | 7730 | 43 | 0.556274% |
| D | 7730 | 175 | 2.263907% |
Noise dominated data is calculated using 1-second bins in cleaned event files. If a bin has >2000 counts, and if more than 50% of those come from <1% of pixels, then it is considered to be noise-dominated and hence unusable.
| Quadrant | # 1 sec bins | Bins with >0 counts | Bins with >2000 counts | High rate bins dominated by noise | Noise dominated (total time) | Noise dominated (detector-on time) | Marked lightcurve |
|---|---|---|---|---|---|---|---|
| A | 8750 | 7733 | 13 | 13 | 0.15% | 0.17% | 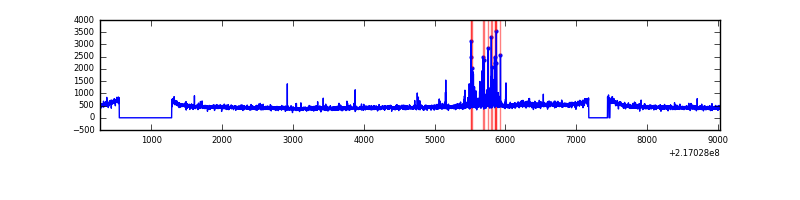 |
| B | 8750 | 7733 | 76 | 76 | 0.87% | 0.98% | 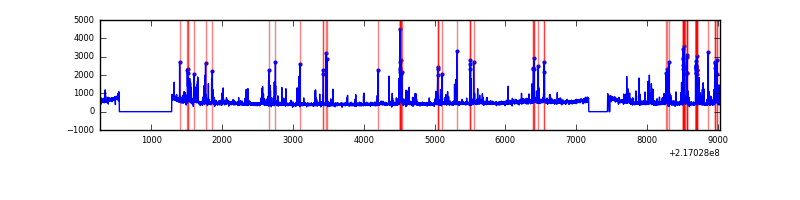 |
| C | 8750 | 7733 | 0 | 0 | 0.00% | 0.00% | 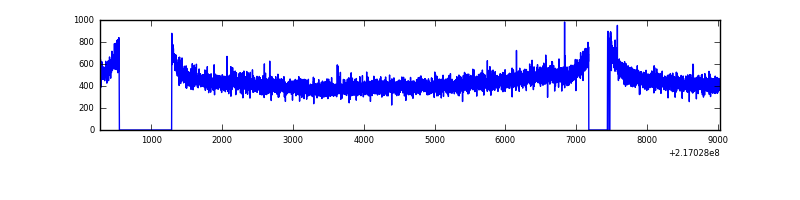 |
| D | 8750 | 7732 | 98 | 98 | 1.12% | 1.27% | 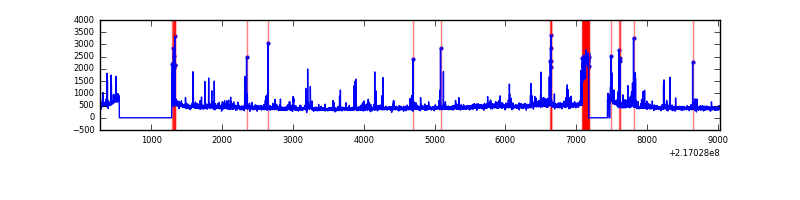 |
Top three noisy pixels from each quadrant. If the there are fewer than three noisy pixels in the level2.evt file, extra rows are filled as -1
| Pixel properties | Quadrant properties | ||||||
|---|---|---|---|---|---|---|---|
| Quadrant | DetID | PixID | Counts | Sigma | Mean | Median | Sigma |
| A | 8 | 15 | 233897 | 1290.16 | 884 | 864 | 180.6 |
| A | 0 | 226 | 8529 | 42.44 | 884 | 864 | 180.6 |
| A | 12 | 194 | 8337 | 41.37 | 884 | 864 | 180.6 |
| B | 3 | 64 | 607099 | 3602.67 | 889 | 868 | 168.3 |
| B | 0 | 214 | 48322 | 282.01 | 889 | 868 | 168.3 |
| B | 15 | 204 | 30988 | 178.99 | 889 | 868 | 168.3 |
| C | 1 | 16 | 15194 | 71.48 | 867 | 869 | 200.4 |
| C | 13 | 61 | 6797 | 29.58 | 867 | 869 | 200.4 |
| C | 8 | 128 | 5691 | 24.06 | 867 | 869 | 200.4 |
| D | 2 | 33 | 269558 | 1285.97 | 849 | 820 | 209.0 |
| D | 13 | 169 | 110643 | 525.53 | 849 | 820 | 209.0 |
| D | 5 | 97 | 87673 | 415.61 | 849 | 820 | 209.0 |
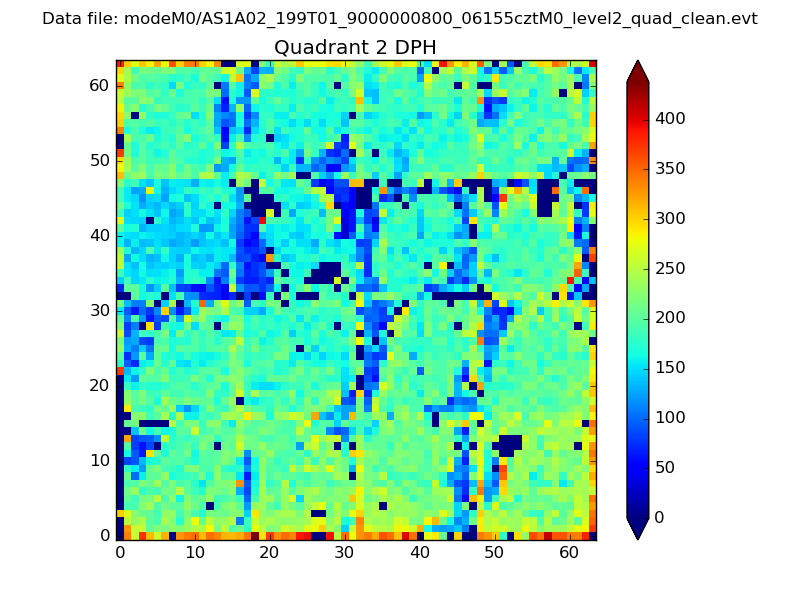
Histogram calculated using DETX and DETY for each event in the final _common_clean file
| Quadrant A | 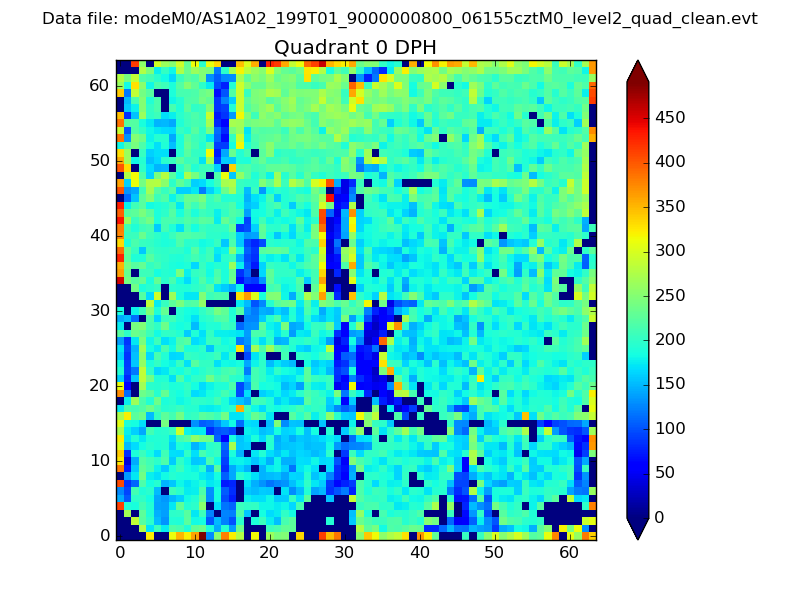 |
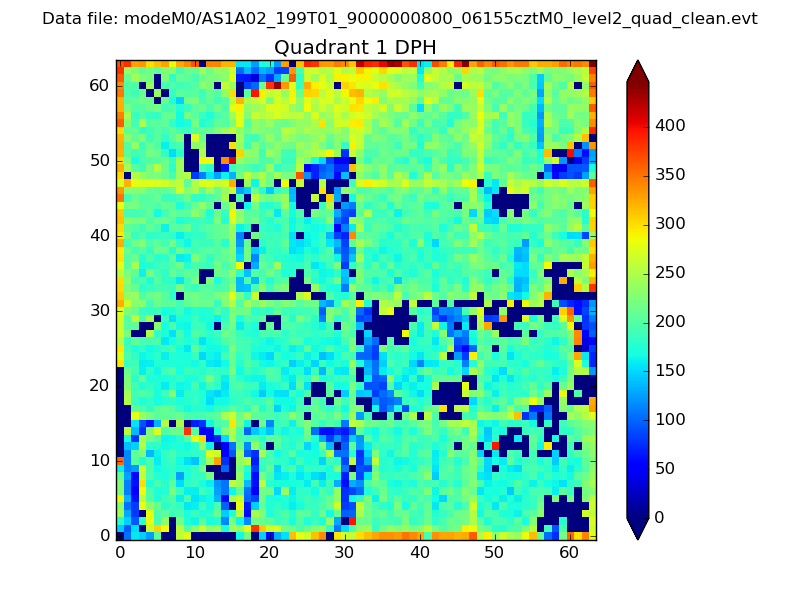 |
Quadrant B |
|---|---|---|---|
| Quadrant D | 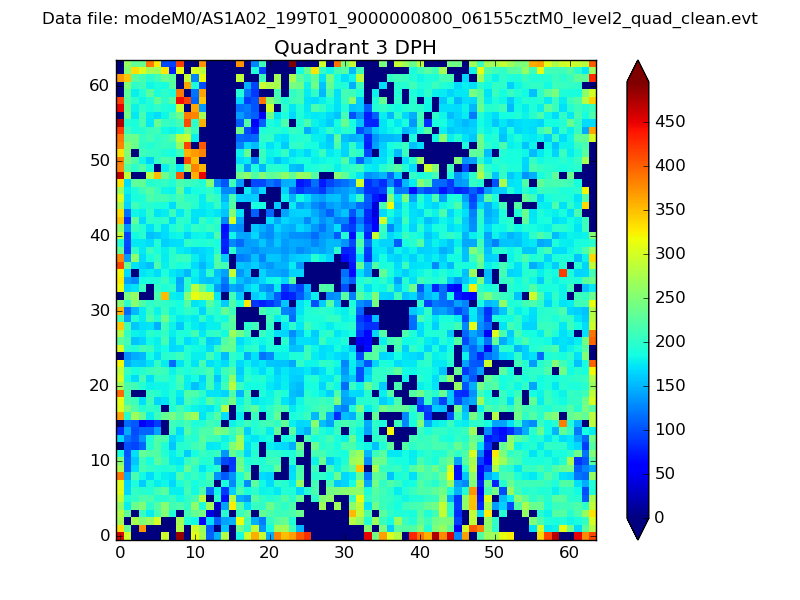 |
 |
Quadrant C |
| Plot type | Count rate plots | Images |
|---|---|---|
| Comparison with Poisson distribution Blue bars denote a histogram of data divided into 1 sec bins. Red curve is a Poisson curve with rate = median count rate of data. |
 |
 |
| Quadrant-wise count rates Data is divided into 100 sec bins |
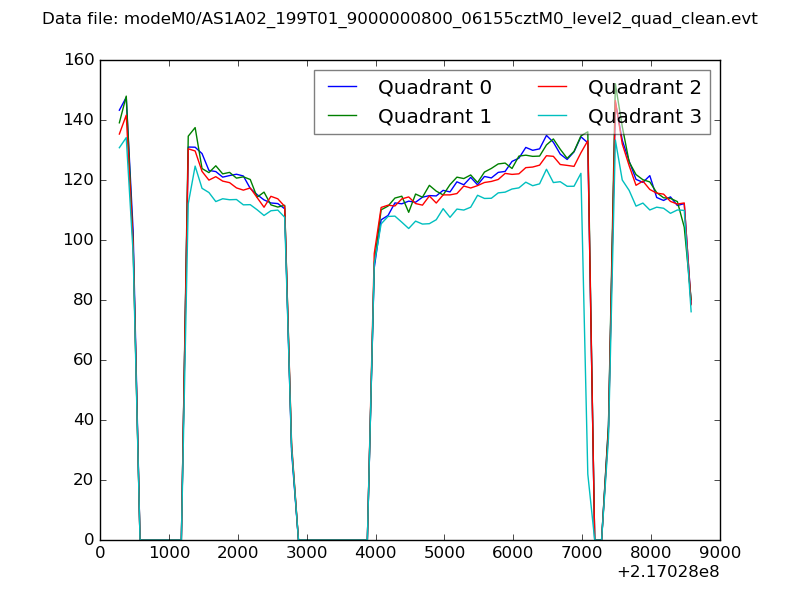 |
|
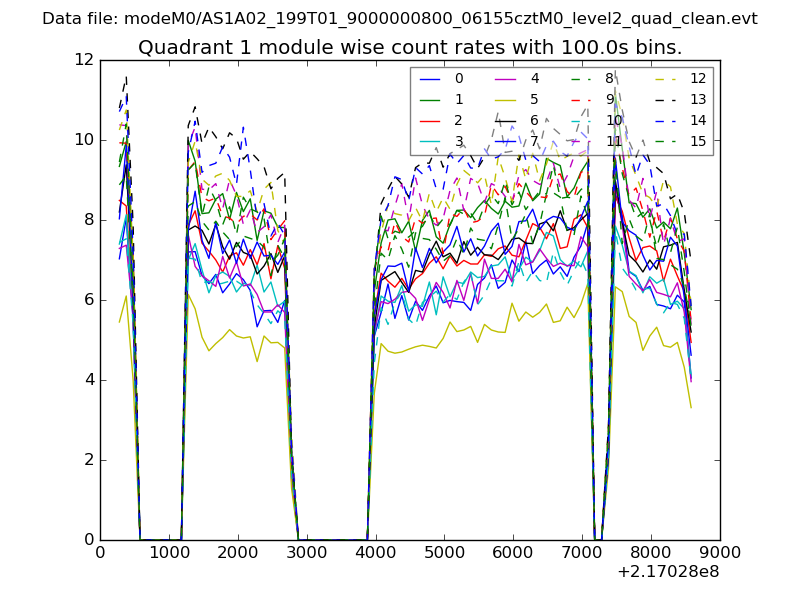
| Module-wise count rates for Quadrant A Data is divided into 100 sec bins |
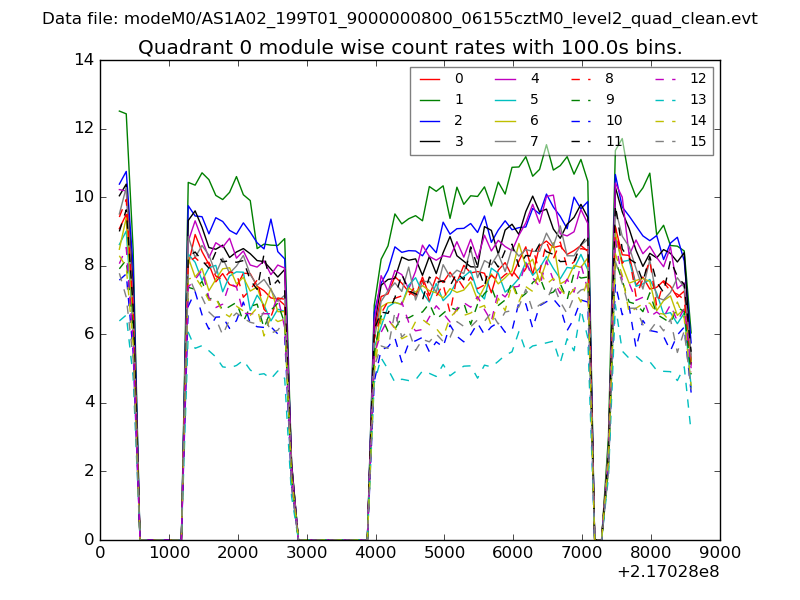 |
 |
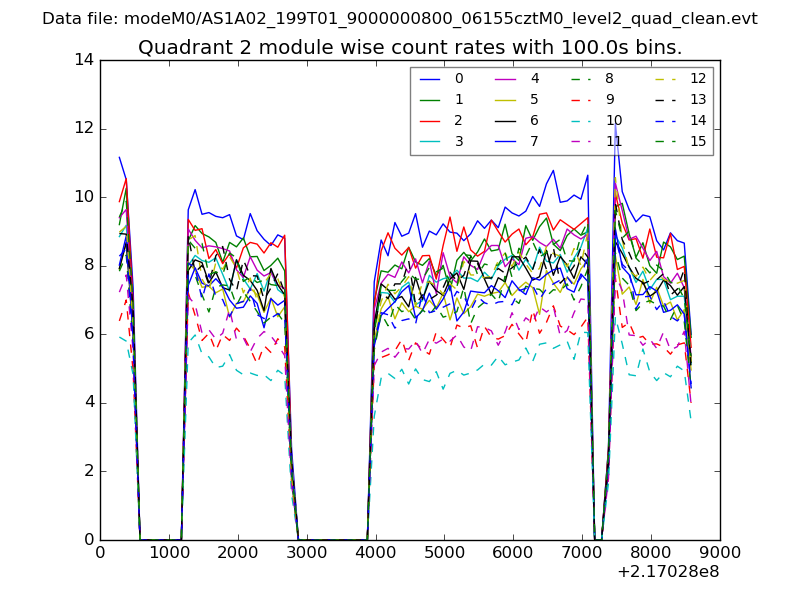
| Module-wise count rates for Quadrant B Data is divided into 100 sec bins |
 |
 |
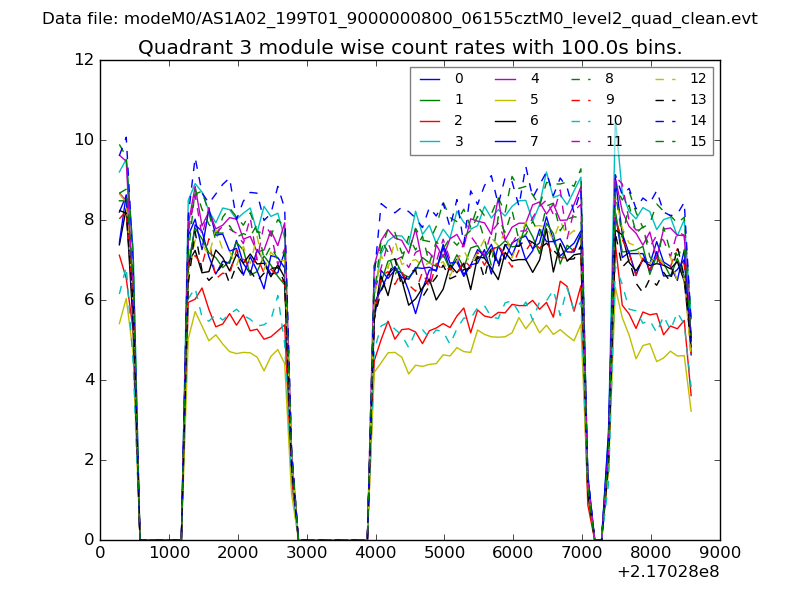
| Module-wise count rates for Quadrant C Data is divided into 100 sec bins |
 |
 |
| Module-wise count rates for Quadrant D Data is divided into 100 sec bins |
 |
 |
| Parameter | Plot |
|---|---|
| CZT HV Monitor | 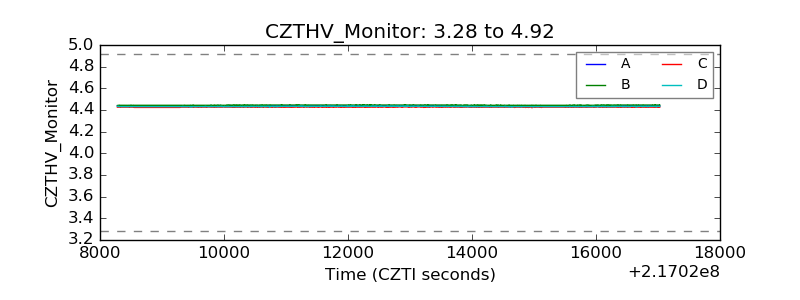 |
| D_VDD |  |
| Temperature 1 | 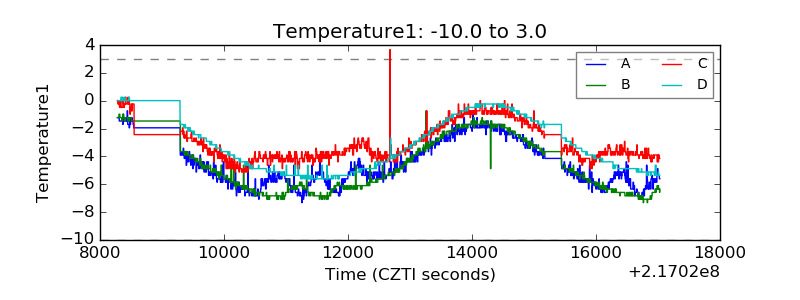 |
| Veto HV Monitor | 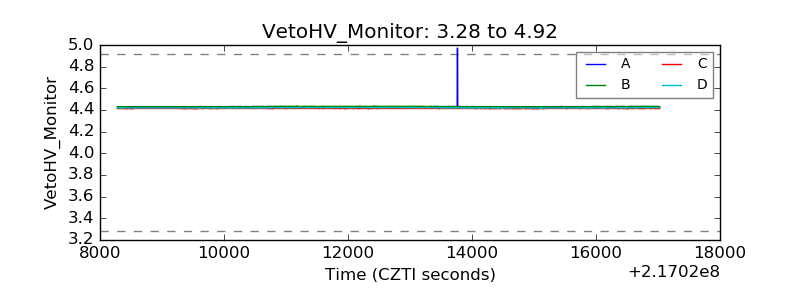 |
| Veto LLD | 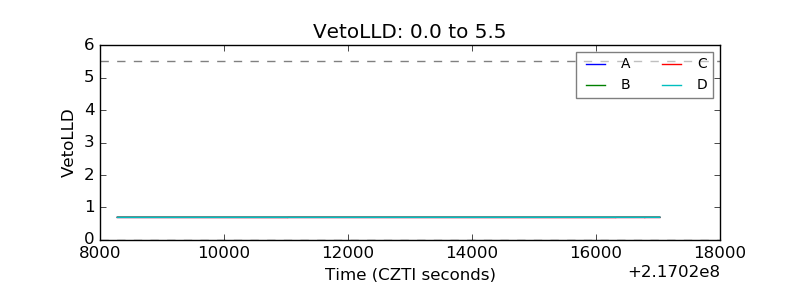 |
| Alpha Counter | 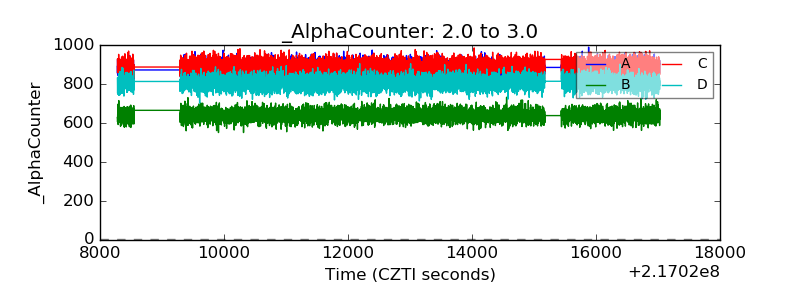 |
| _CPM_Rate | 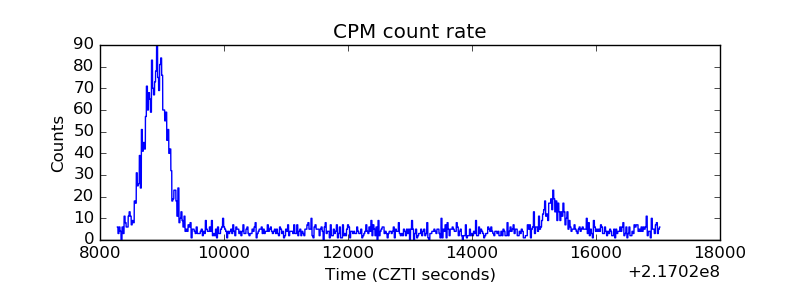 |
| CZT Counter | 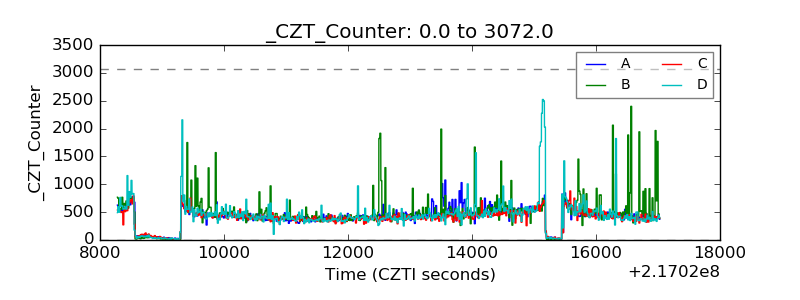 |
| +2.5 Volts monitor |  |
| +5 Volts monitor |  |
| _ROLL_ROT | 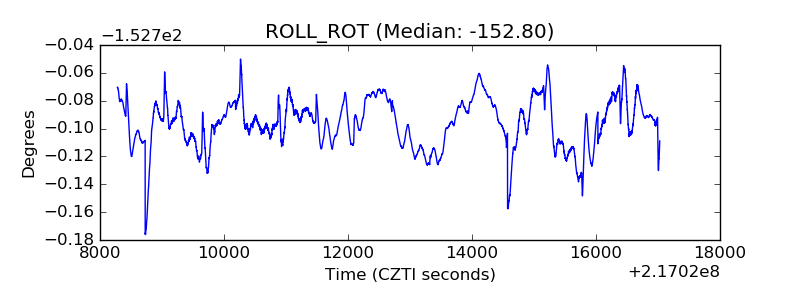 |
| _Roll_DEC | 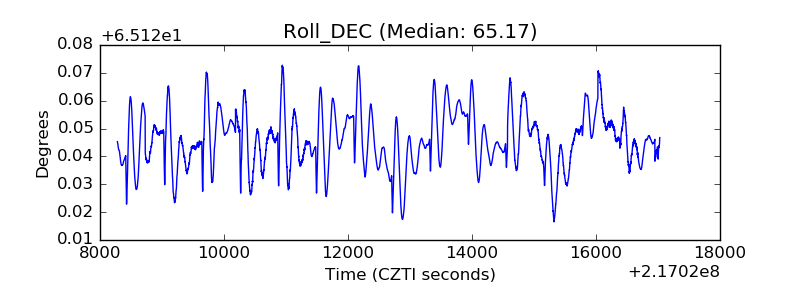 |
| _Roll_RA | 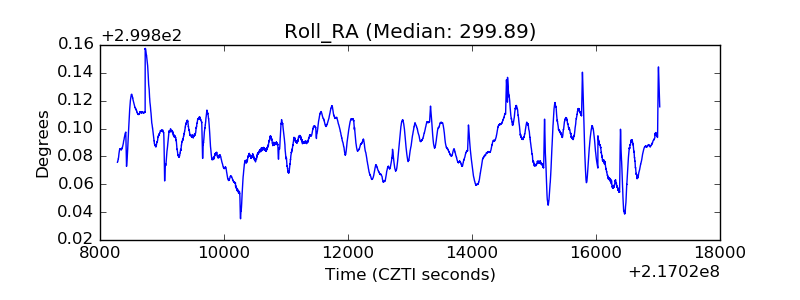 |
| Veto Counter | 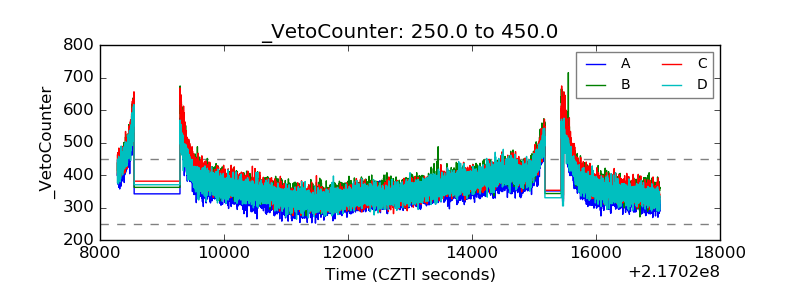 |