| Param | Original file | Final file |
|---|---|---|
| Filename | modeM0/AS1A02_199T01_9000000800_06156cztM0_level2.evt | modeM0/AS1A02_199T01_9000000800_06156cztM0_level2_quad_clean.evt |
| Size (bytes) | 607,060,800 | 123,649,920 |
| Size | 578.9 MB | 117.9 MB |
| Events in quadrant A | 4,082,031 | 805,874 |
| Events in quadrant B | 5,329,358 | 798,779 |
| Events in quadrant C | 4,004,913 | 792,555 |
| Events in quadrant D | 4,376,025 | 741,429 |
| Mode SS | |||
|---|---|---|---|
| Quadrant | BADHDUFLAG | Total packets | Discarded packets |
| A | 0 | 176 | 0 |
| B | 0 | 176 | 0 |
| C | 0 | 176 | 0 |
| D | 0 | 176 | 0 |
| Mode M9 | |||
|---|---|---|---|
| Quadrant | BADHDUFLAG | Total packets | Discarded packets |
| A | 0 | 3 | 0 |
| B | 0 | 3 | 0 |
| C | 0 | 3 | 0 |
| D | 0 | 3 | 0 |
| Mode M0 | |||
|---|---|---|---|
| Quadrant | BADHDUFLAG | Total packets | Discarded packets |
| A | 0 | 18465 | 47 |
| B | 0 | 21837 | 60 |
| C | 0 | 18214 | 45 |
| D | 0 | 19637 | 42 |
| Quadrant | Total seconds | Saturated seconds | Saturation percentage |
|---|---|---|---|
| A | 8734 | 109 | 1.247996% |
| B | 8733 | 514 | 5.885721% |
| C | 8732 | 62 | 0.710032% |
| D | 8736 | 201 | 2.300824% |
Noise dominated data is calculated using 1-second bins in cleaned event files. If a bin has >2000 counts, and if more than 50% of those come from <1% of pixels, then it is considered to be noise-dominated and hence unusable.
| Quadrant | # 1 sec bins | Bins with >0 counts | Bins with >2000 counts | High rate bins dominated by noise | Noise dominated (total time) | Noise dominated (detector-on time) | Marked lightcurve |
|---|---|---|---|---|---|---|---|
| A | 9033 | 8754 | 32 | 32 | 0.35% | 0.37% | 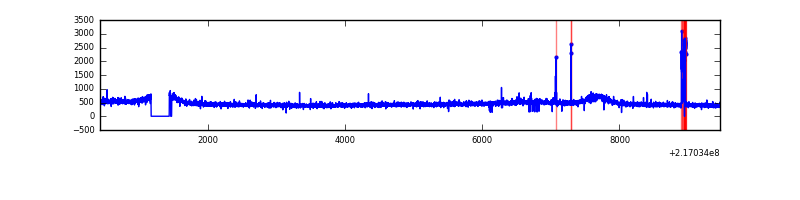 |
| B | 9033 | 8752 | 229 | 229 | 2.54% | 2.62% | 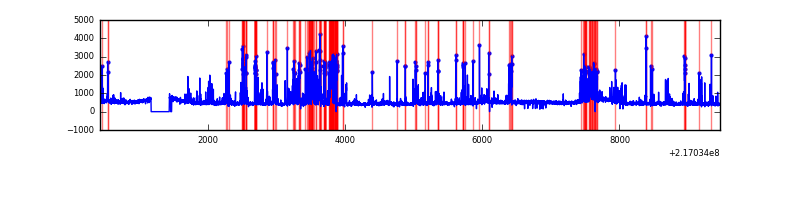 |
| C | 9033 | 8754 | 0 | 0 | 0.00% | 0.00% | 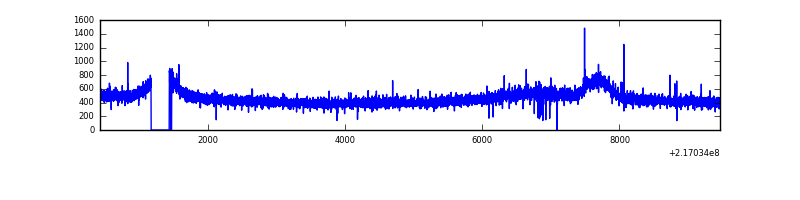 |
| D | 9033 | 8754 | 118 | 118 | 1.31% | 1.35% | 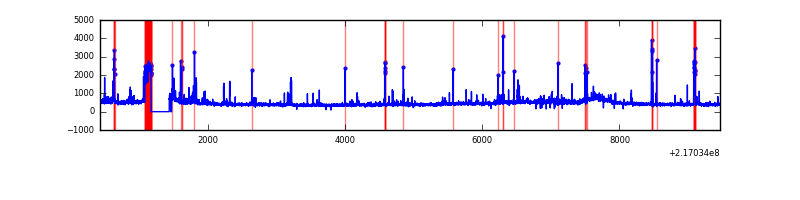 |
Top three noisy pixels from each quadrant. If the there are fewer than three noisy pixels in the level2.evt file, extra rows are filled as -1
| Pixel properties | Quadrant properties | ||||||
|---|---|---|---|---|---|---|---|
| Quadrant | DetID | PixID | Counts | Sigma | Mean | Median | Sigma |
| A | 8 | 15 | 104205 | 498.42 | 1010 | 985 | 207.1 |
| A | 0 | 254 | 90149 | 430.55 | 1010 | 985 | 207.1 |
| A | 12 | 194 | 9660 | 41.89 | 1010 | 985 | 207.1 |
| B | 3 | 64 | 1308503 | 6828.05 | 1006 | 980 | 191.5 |
| B | 0 | 214 | 53061 | 271.97 | 1006 | 980 | 191.5 |
| B | 15 | 204 | 24939 | 125.12 | 1006 | 980 | 191.5 |
| C | 1 | 16 | 89225 | 384.74 | 994 | 997 | 229.3 |
| C | 8 | 128 | 17015 | 69.85 | 994 | 997 | 229.3 |
| C | 8 | 112 | 8751 | 33.81 | 994 | 997 | 229.3 |
| D | 2 | 33 | 301974 | 1256.89 | 974 | 941 | 239.5 |
| D | 5 | 97 | 85738 | 354.05 | 974 | 941 | 239.5 |
| D | 8 | 195 | 74109 | 305.49 | 974 | 941 | 239.5 |
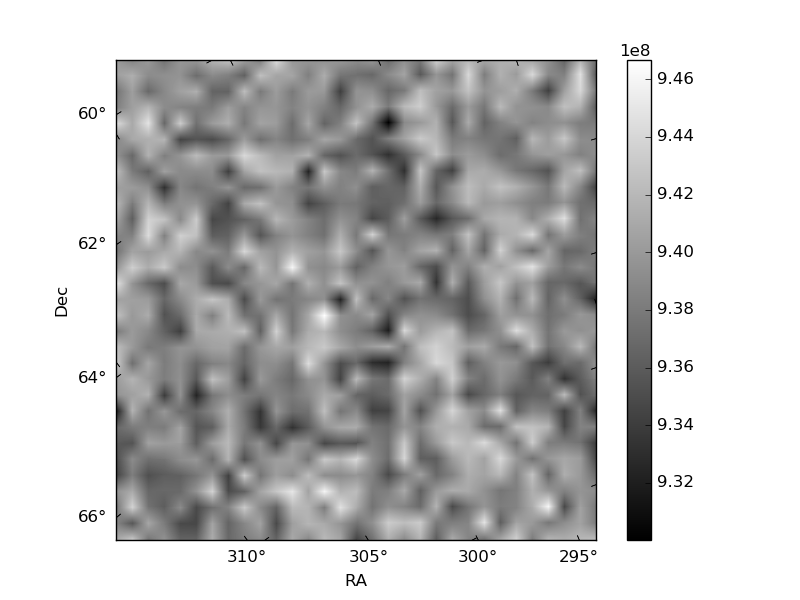
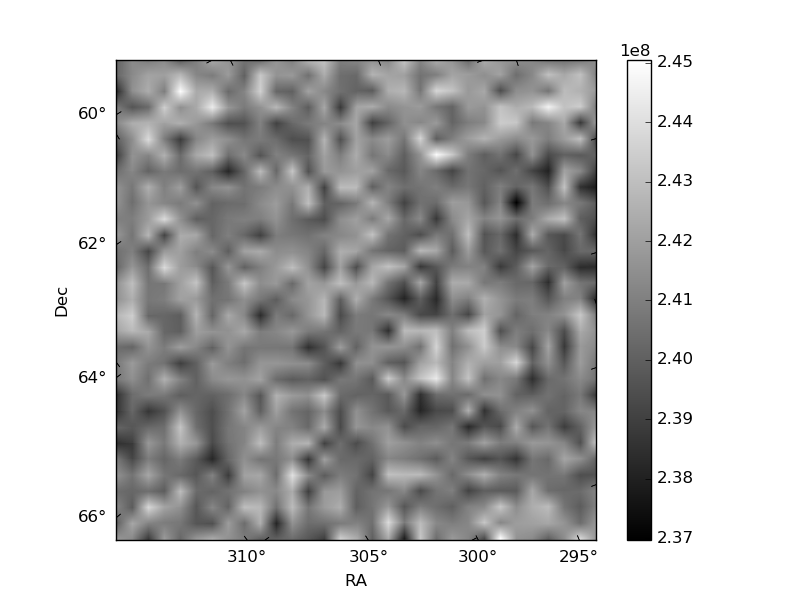
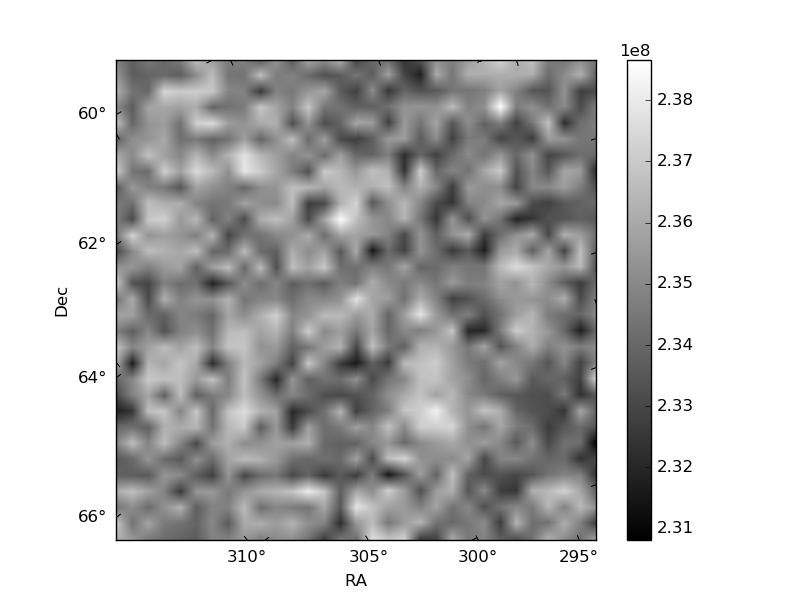
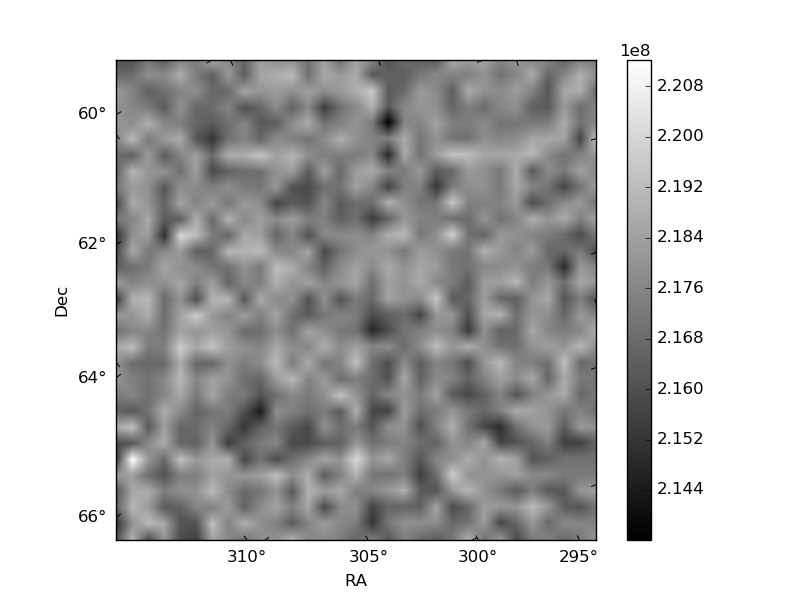
Histogram calculated using DETX and DETY for each event in the final _common_clean file
| Quadrant A | 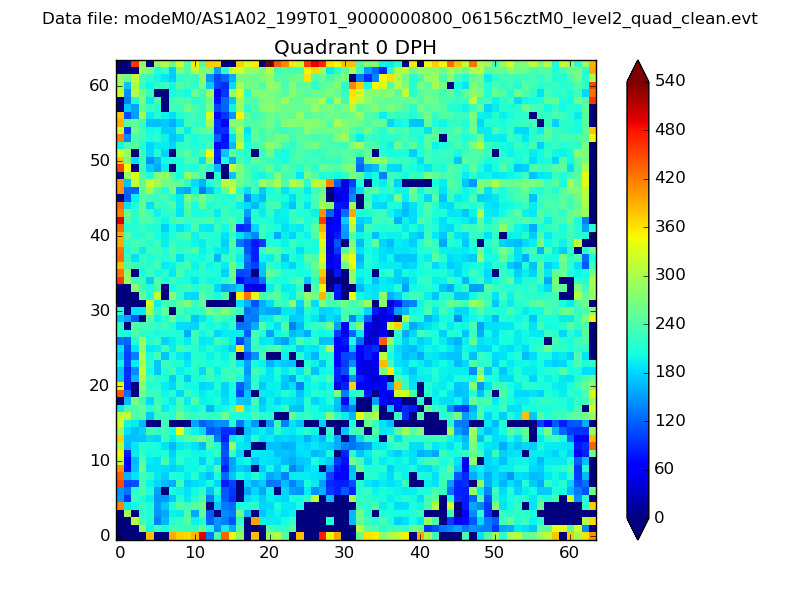 |
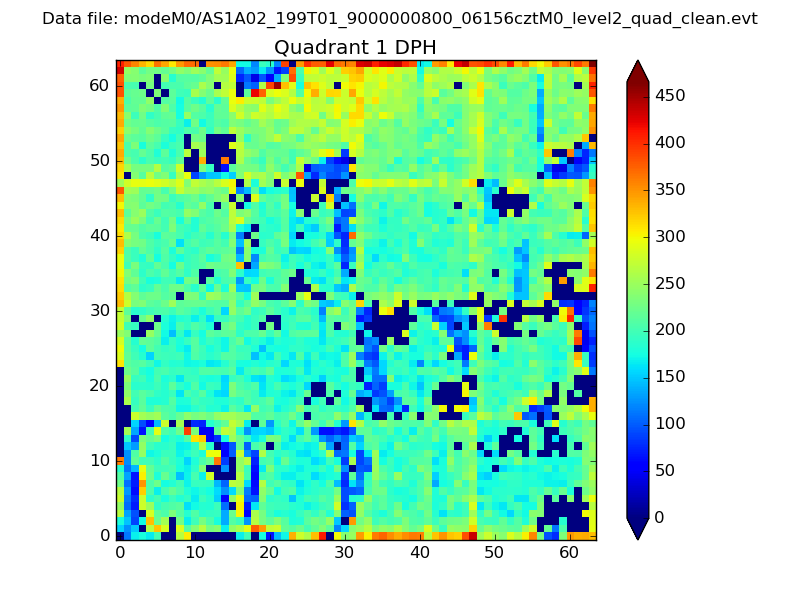 |
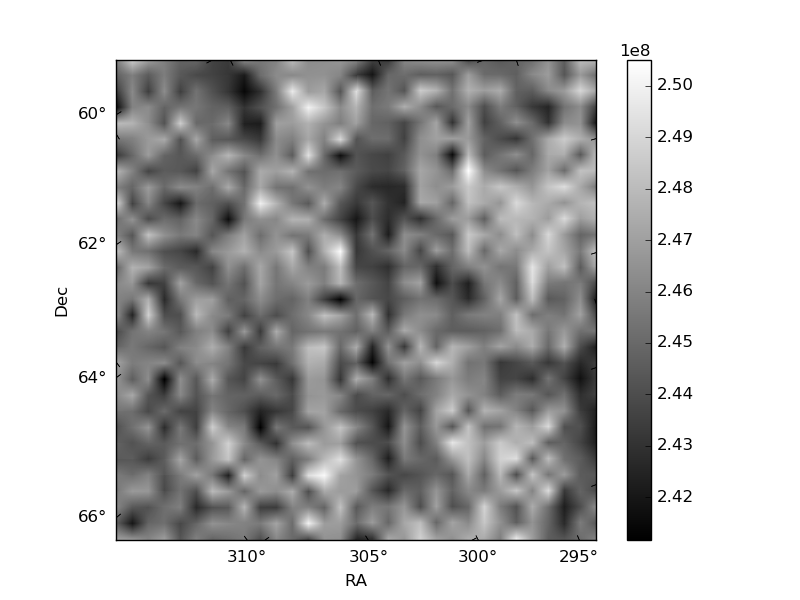
Quadrant B |
|---|---|---|---|
| Quadrant D | 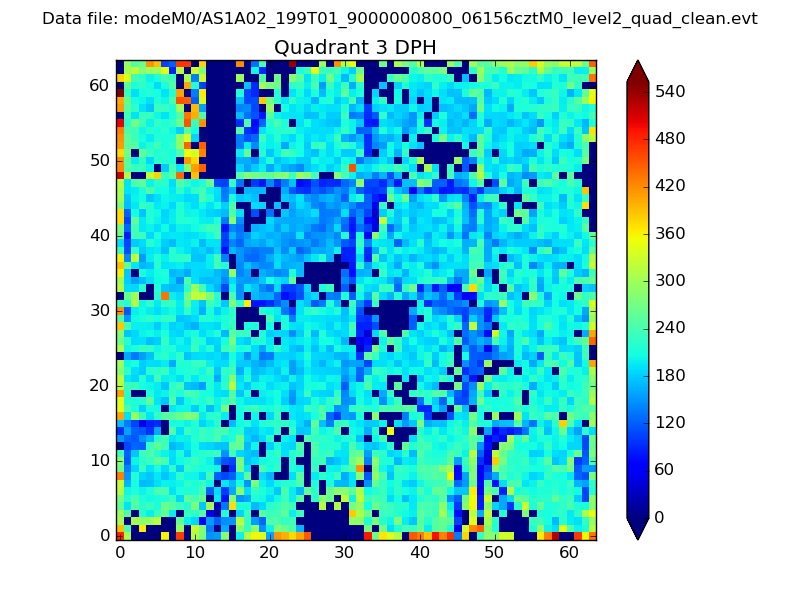 |
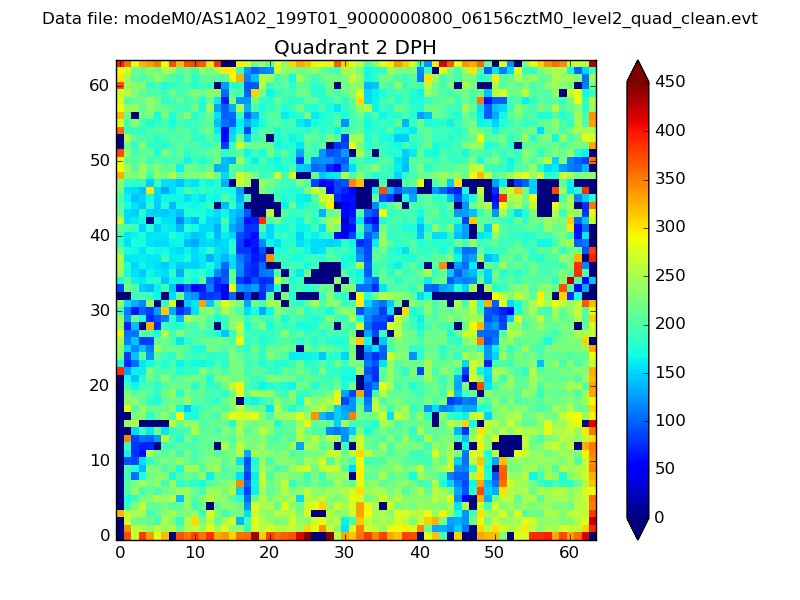 |
Quadrant C |
| Plot type | Count rate plots | Images |
|---|---|---|
| Comparison with Poisson distribution Blue bars denote a histogram of data divided into 1 sec bins. Red curve is a Poisson curve with rate = median count rate of data. |
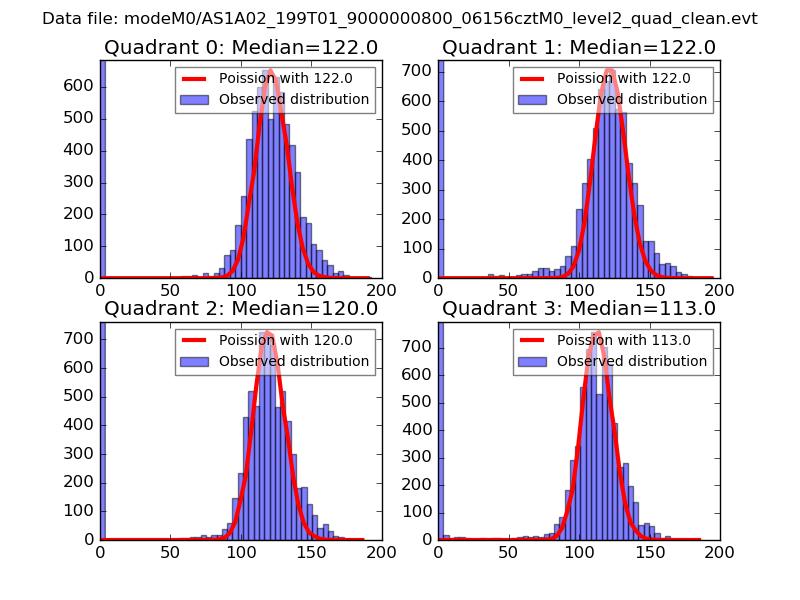 |
 |
| Quadrant-wise count rates Data is divided into 100 sec bins |
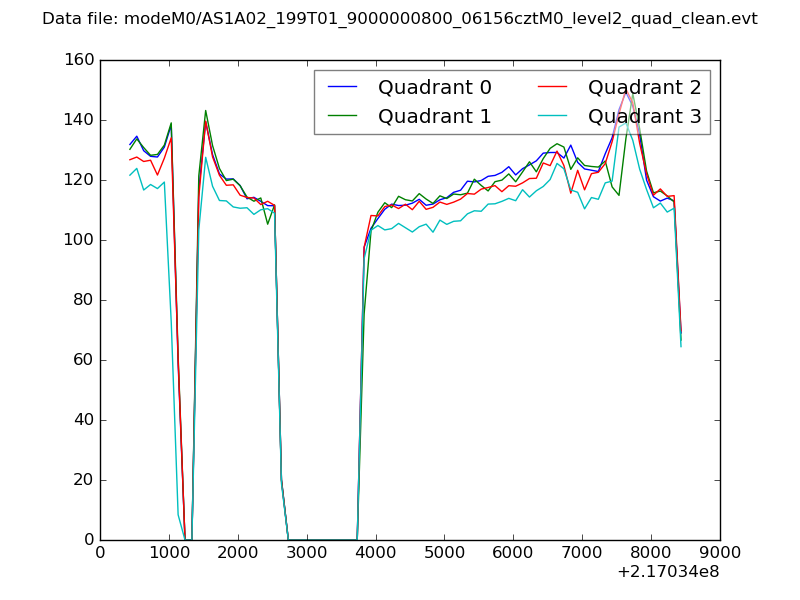 |
|
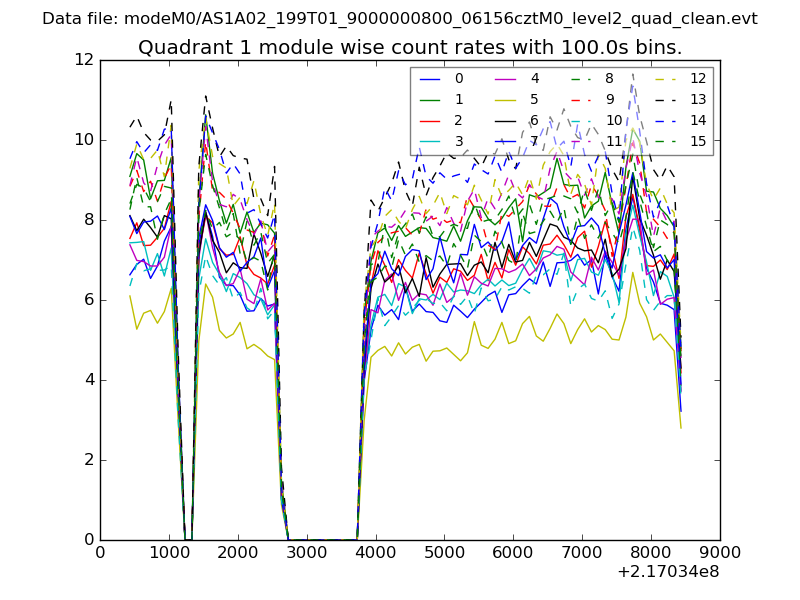
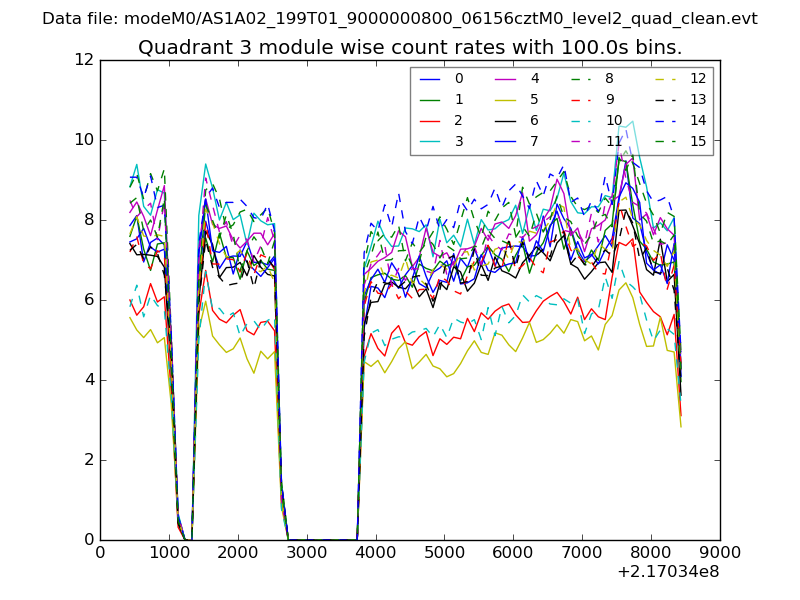
| Module-wise count rates for Quadrant A Data is divided into 100 sec bins |
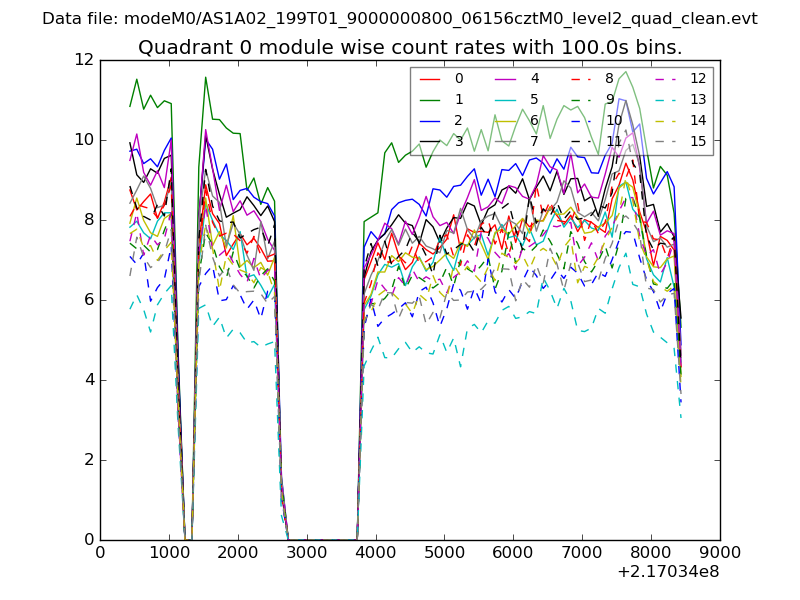 |
 |
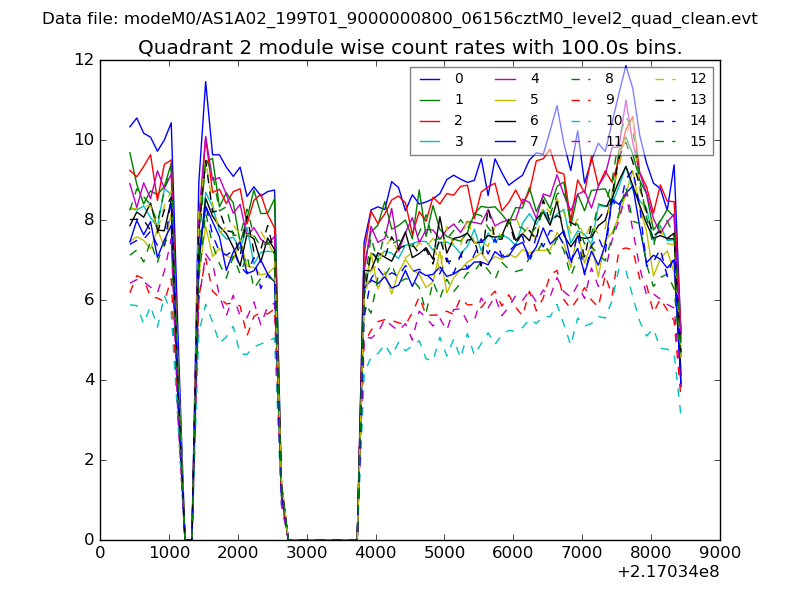
| Module-wise count rates for Quadrant B Data is divided into 100 sec bins |
 |
 |
| Module-wise count rates for Quadrant C Data is divided into 100 sec bins |
 |
 |
| Module-wise count rates for Quadrant D Data is divided into 100 sec bins |
 |
 |
| Parameter | Plot |
|---|---|
| CZT HV Monitor | 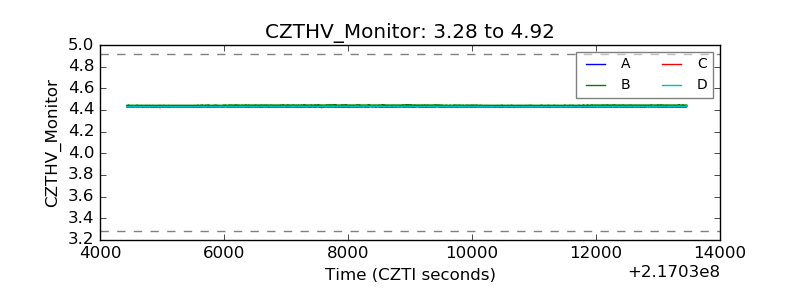 |
| D_VDD | 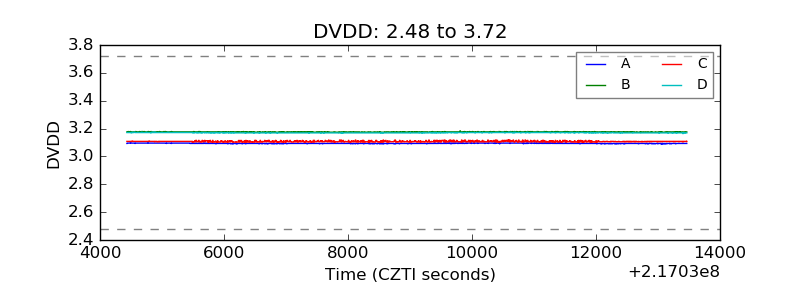 |
| Temperature 1 | 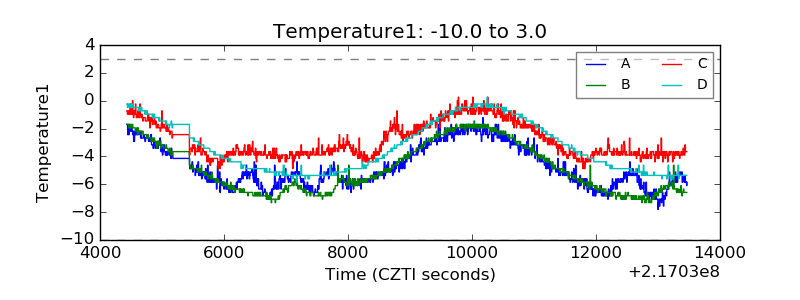 |
| Veto HV Monitor | 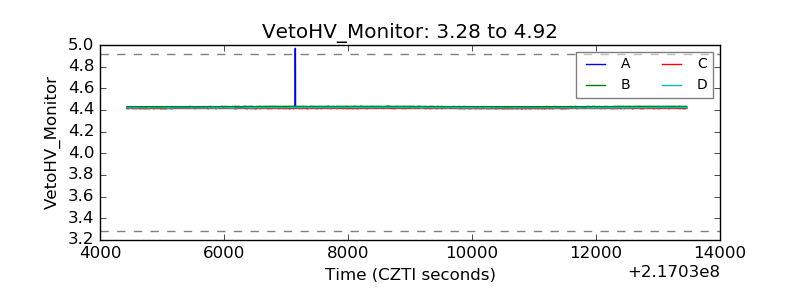 |
| Veto LLD | 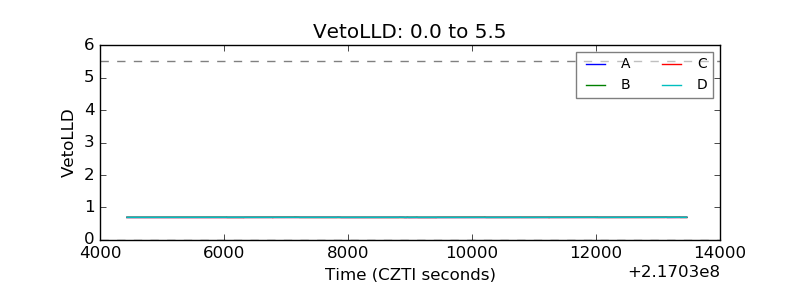 |
| Alpha Counter | 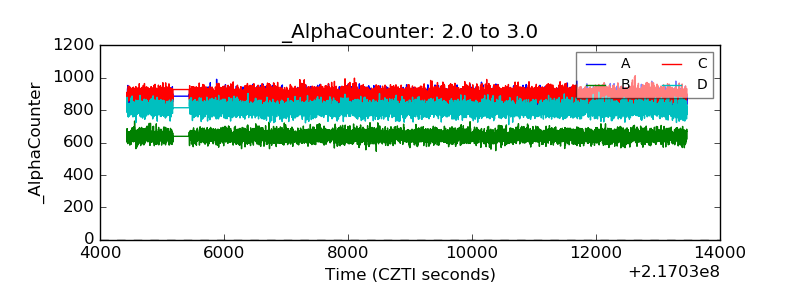 |
| _CPM_Rate | 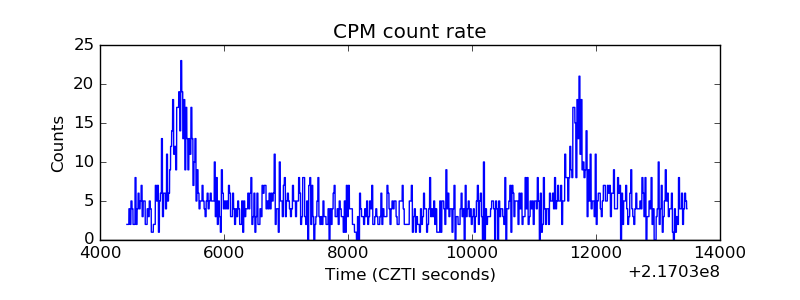 |
| CZT Counter | 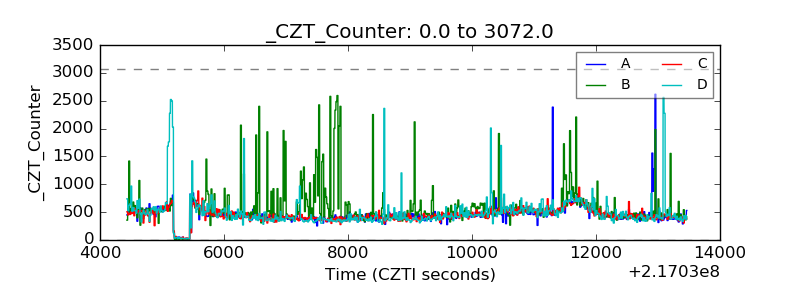 |
| +2.5 Volts monitor | 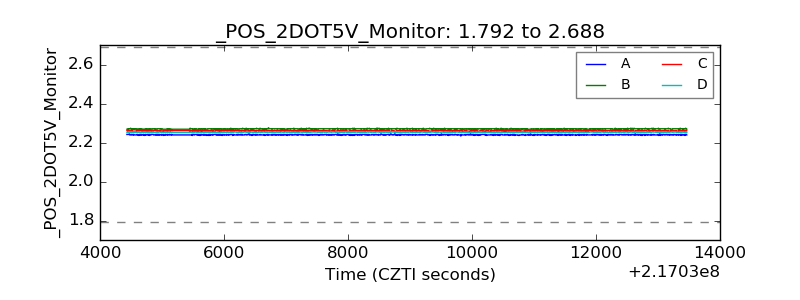 |
| +5 Volts monitor | 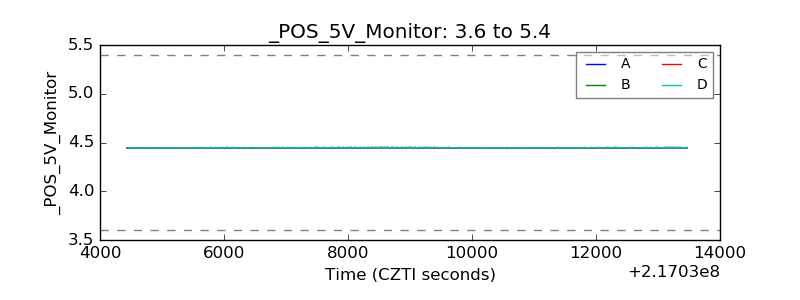 |
| _ROLL_ROT | 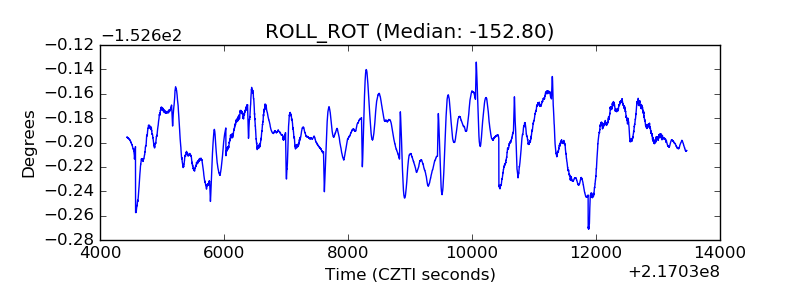 |
| _Roll_DEC | 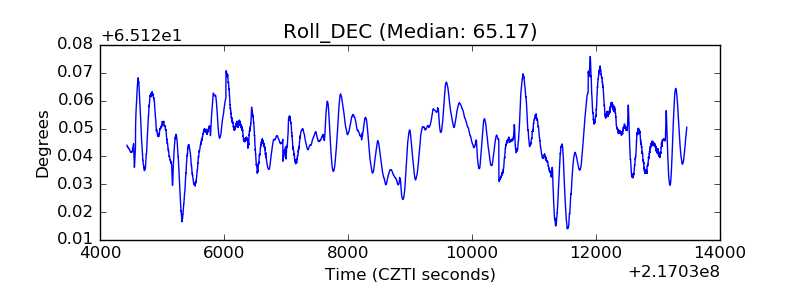 |
| _Roll_RA | 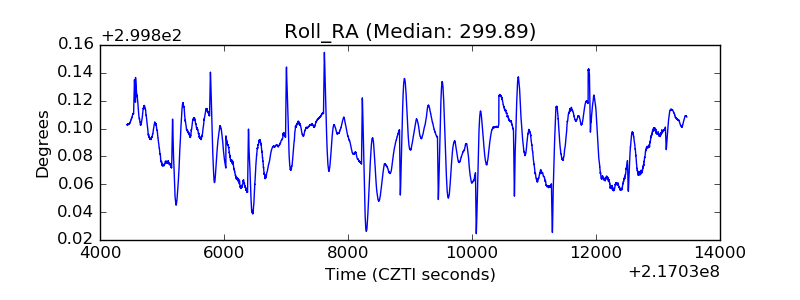 |
| Veto Counter | 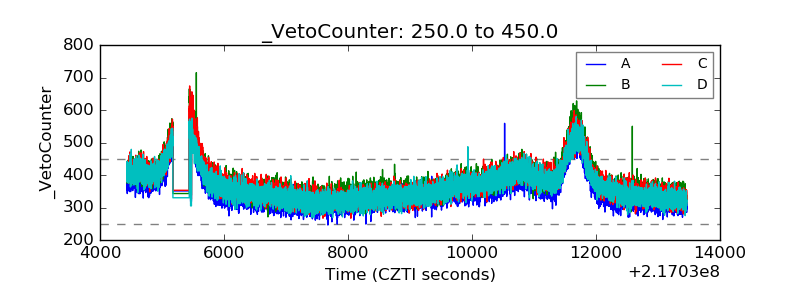 |