| Param | Original file | Final file |
|---|---|---|
| Filename | modeM0/AS1A02_199T01_9000000800_06160cztM0_level2.evt | modeM0/AS1A02_199T01_9000000800_06160cztM0_level2_quad_clean.evt |
| Size (bytes) | 161,824,320 | 41,376,960 |
| Size | 154.3 MB | 39.5 MB |
| Events in quadrant A | 1,130,720 | 269,266 |
| Events in quadrant B | 1,317,935 | 271,695 |
| Events in quadrant C | 1,086,111 | 266,729 |
| Events in quadrant D | 1,180,058 | 251,971 |
| Mode SS | |||
|---|---|---|---|
| Quadrant | BADHDUFLAG | Total packets | Discarded packets |
| A | 0 | 58 | 4 |
| B | 0 | 58 | 4 |
| C | 0 | 58 | 8 |
| D | 0 | 58 | 4 |
| Mode M0 | |||
|---|---|---|---|
| Quadrant | BADHDUFLAG | Total packets | Discarded packets |
| A | 0 | 5851 | 463 |
| B | 0 | 6326 | 540 |
| C | 0 | 5854 | 434 |
| D | 0 | 6082 | 467 |
| Quadrant | Total seconds | Saturated seconds | Saturation percentage |
|---|---|---|---|
| A | 2693 | 0 | 0.000000% |
| B | 2691 | 6 | 0.222965% |
| C | 2707 | 1 | 0.036941% |
| D | 2700 | 5 | 0.185185% |
Noise dominated data is calculated using 1-second bins in cleaned event files. If a bin has >2000 counts, and if more than 50% of those come from <1% of pixels, then it is considered to be noise-dominated and hence unusable.
| Quadrant | # 1 sec bins | Bins with >0 counts | Bins with >2000 counts | High rate bins dominated by noise | Noise dominated (total time) | Noise dominated (detector-on time) | Marked lightcurve |
|---|---|---|---|---|---|---|---|
| A | 2925 | 2846 | 0 | 0 | 0.00% | 0.00% | 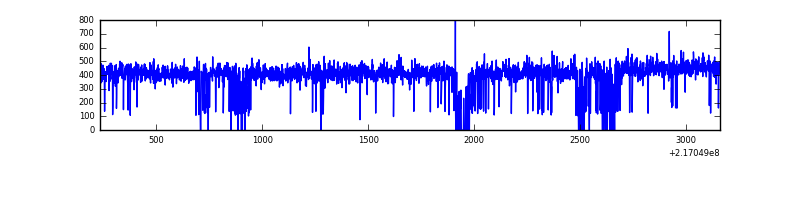 |
| B | 2924 | 2824 | 6 | 6 | 0.21% | 0.21% | 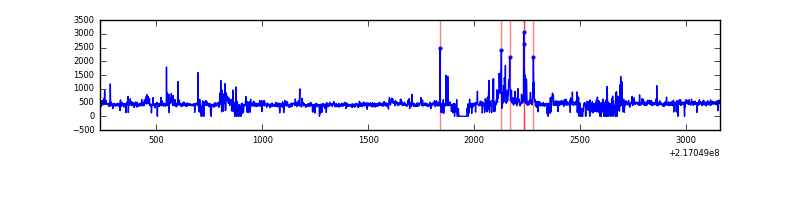 |
| C | 2925 | 2849 | 0 | 0 | 0.00% | 0.00% | 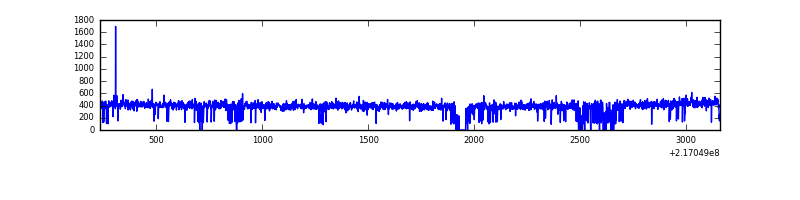 |
| D | 2925 | 2853 | 4 | 4 | 0.14% | 0.14% | 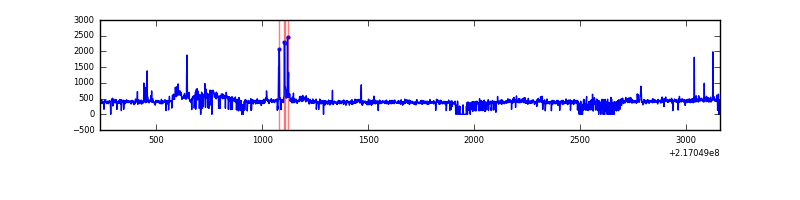 |
Top three noisy pixels from each quadrant. If the there are fewer than three noisy pixels in the level2.evt file, extra rows are filled as -1
| Pixel properties | Quadrant properties | ||||||
|---|---|---|---|---|---|---|---|
| Quadrant | DetID | PixID | Counts | Sigma | Mean | Median | Sigma |
| A | 8 | 15 | 30094 | 500.11 | 285 | 279 | 59.6 |
| A | 12 | 194 | 2793 | 42.17 | 285 | 279 | 59.6 |
| A | 0 | 226 | 2743 | 41.33 | 285 | 279 | 59.6 |
| B | 3 | 64 | 105943 | 1857.54 | 285 | 279 | 56.9 |
| B | 0 | 219 | 69505 | 1216.97 | 285 | 279 | 56.9 |
| B | 0 | 214 | 18496 | 320.25 | 285 | 279 | 56.9 |
| C | 1 | 16 | 11169 | 169.94 | 271 | 272 | 64.1 |
| C | 8 | 128 | 6951 | 104.16 | 271 | 272 | 64.1 |
| C | 8 | 112 | 3384 | 48.53 | 271 | 272 | 64.1 |
| D | 9 | 35 | 78981 | 1168.23 | 272 | 263 | 67.4 |
| D | 5 | 97 | 27263 | 400.7 | 272 | 263 | 67.4 |
| D | 1 | 20 | 23348 | 342.6 | 272 | 263 | 67.4 |
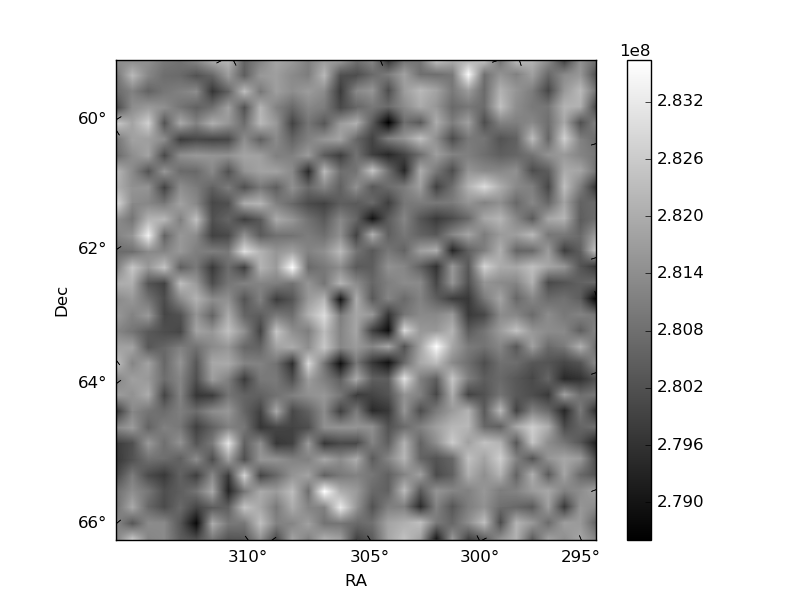
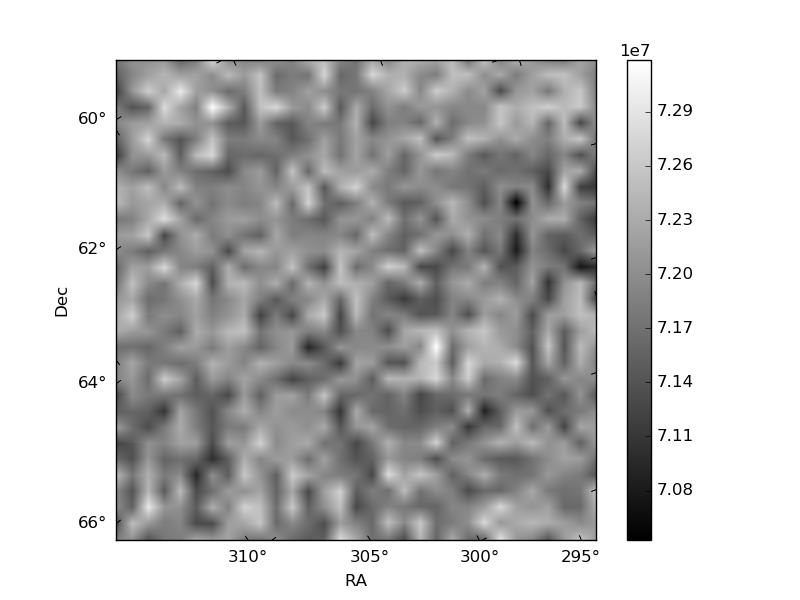
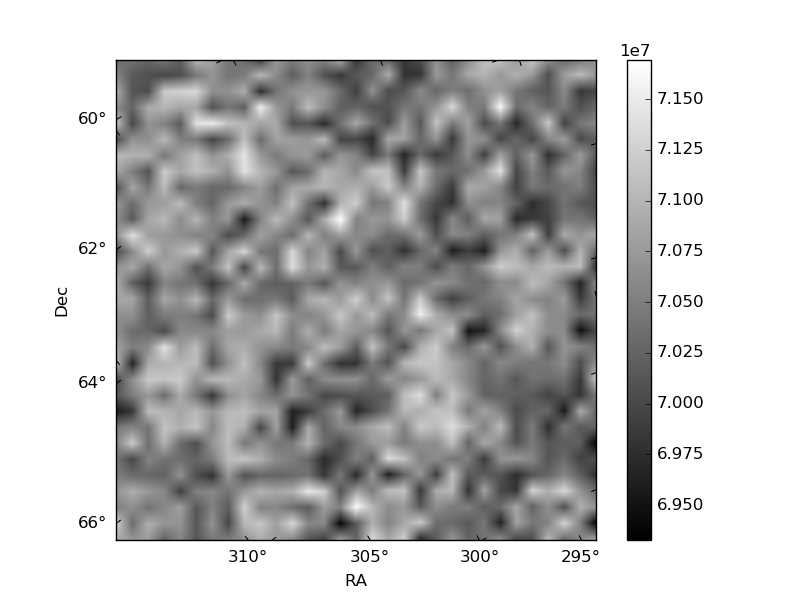
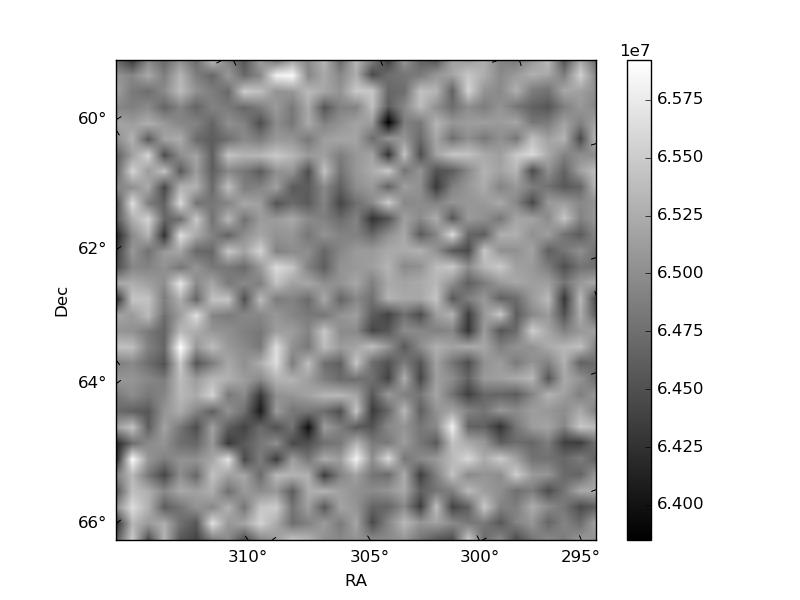
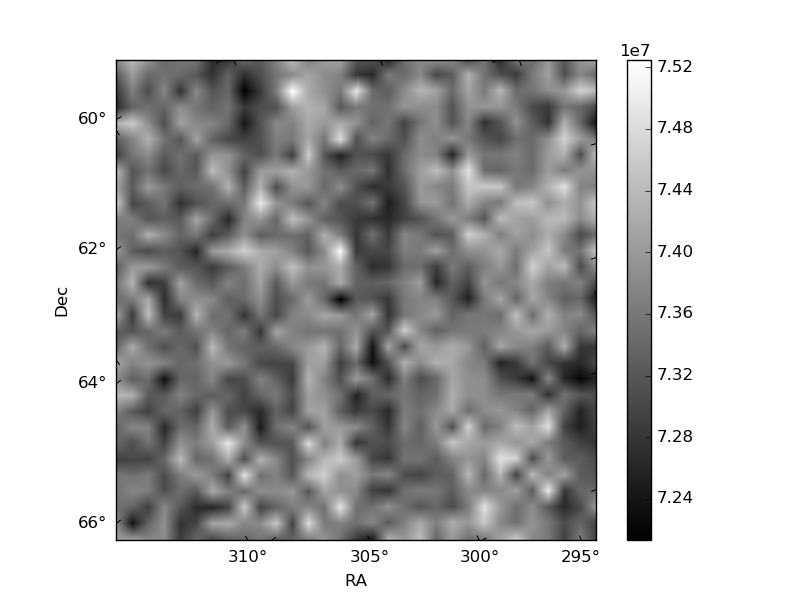
Histogram calculated using DETX and DETY for each event in the final _common_clean file
| Quadrant A | 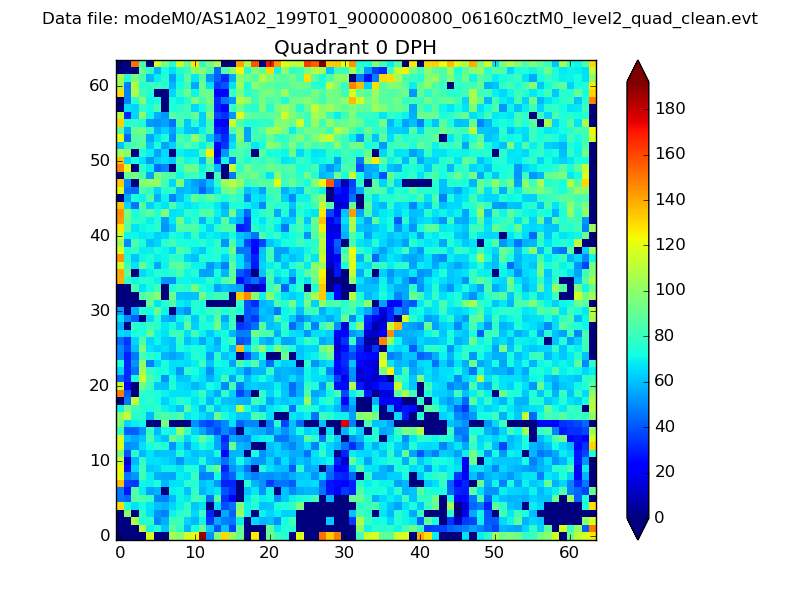 |
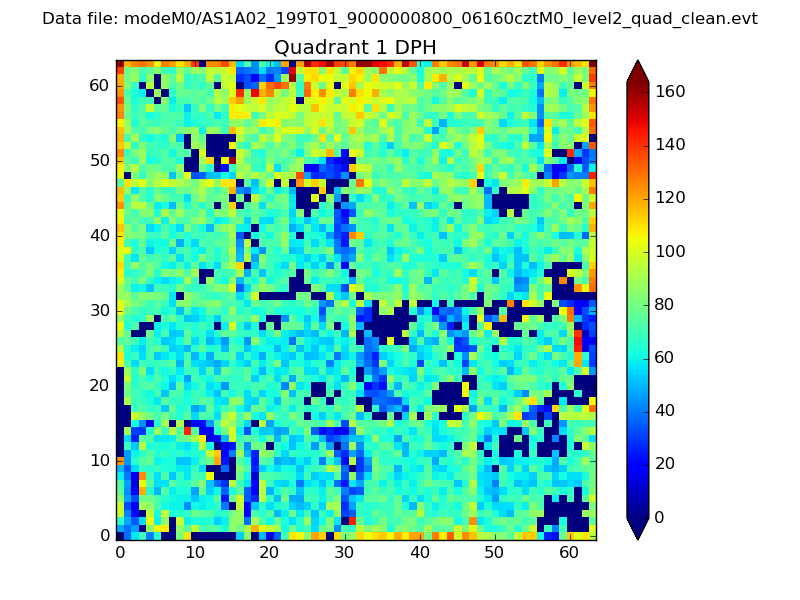 |
Quadrant B |
|---|---|---|---|
| Quadrant D | 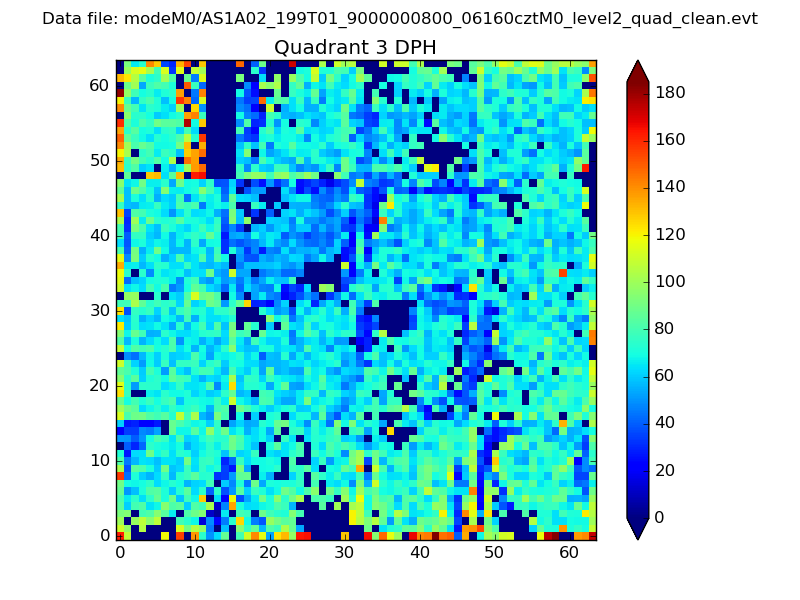 |
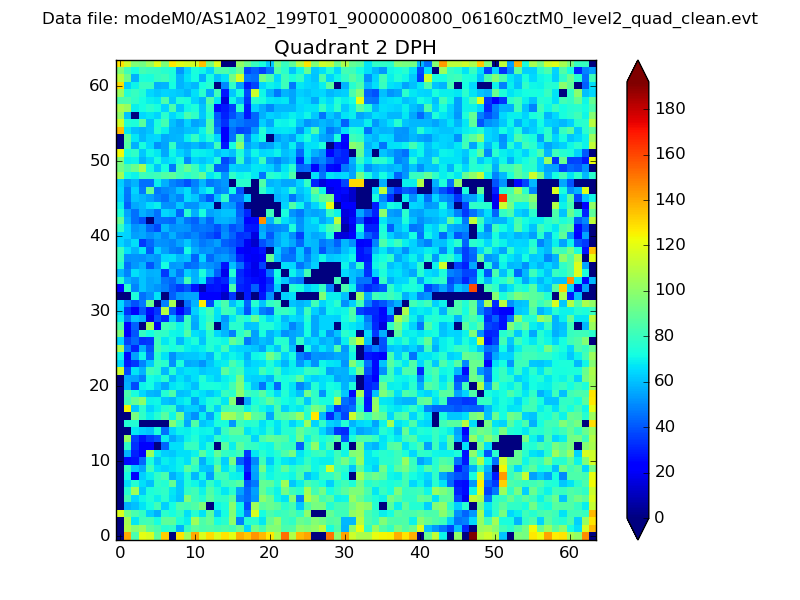 |
Quadrant C |
| Plot type | Count rate plots | Images |
|---|---|---|
| Comparison with Poisson distribution Blue bars denote a histogram of data divided into 1 sec bins. Red curve is a Poisson curve with rate = median count rate of data. |
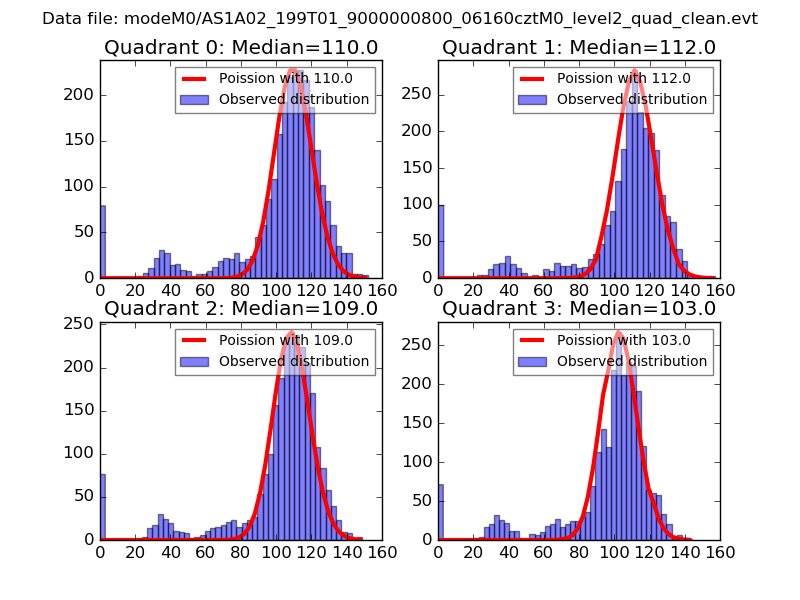 |
 |
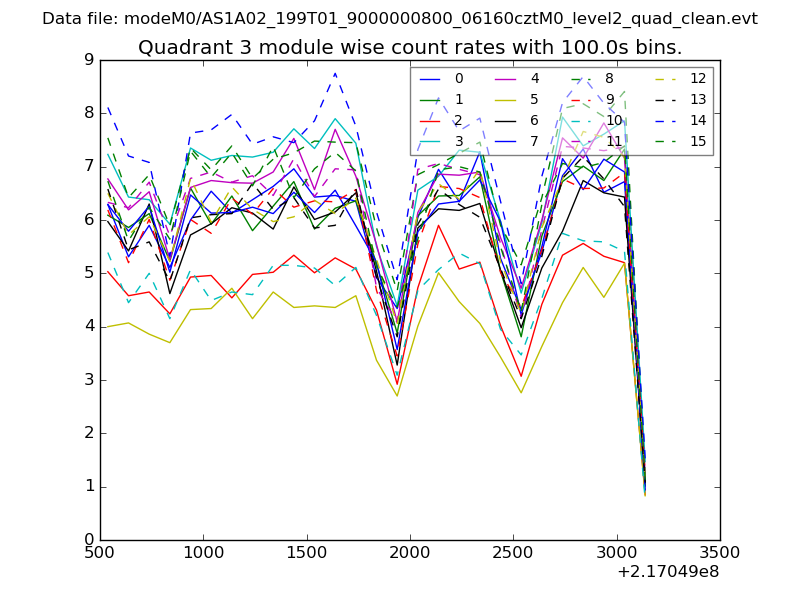
| Quadrant-wise count rates Data is divided into 100 sec bins |
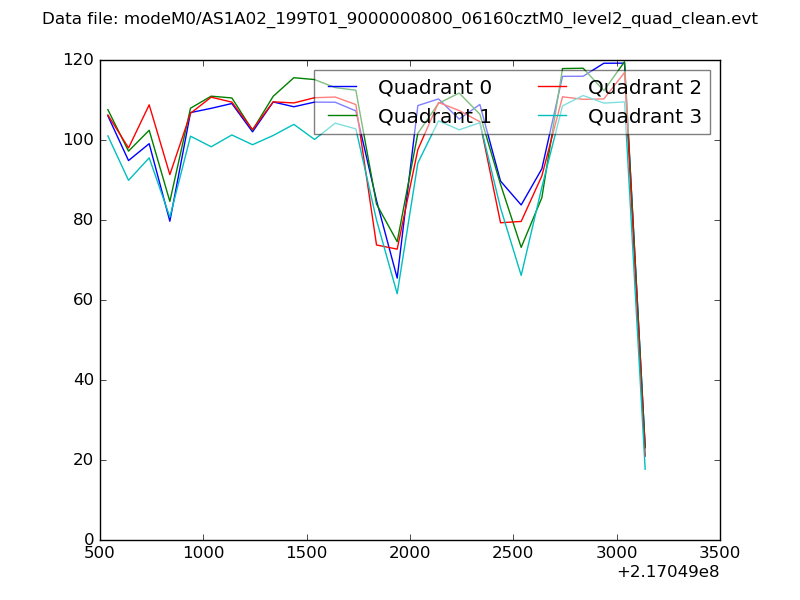 |
|
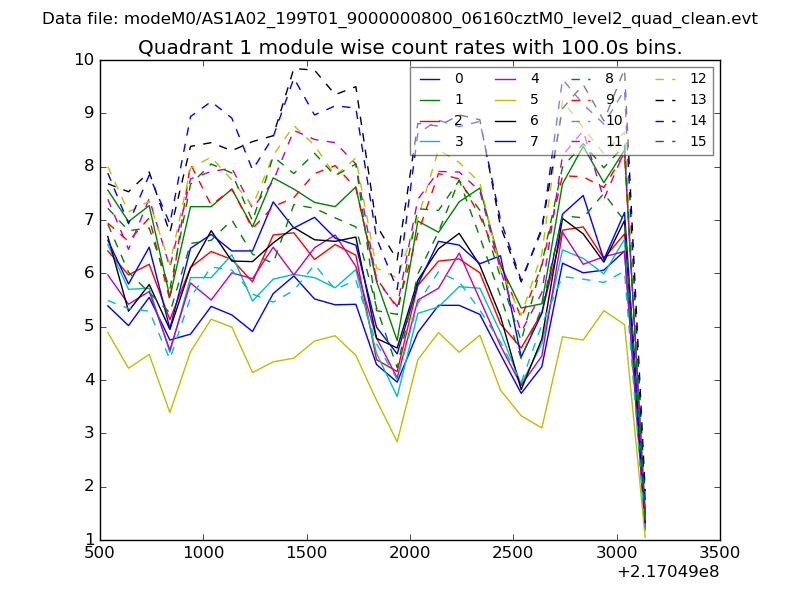
| Module-wise count rates for Quadrant A Data is divided into 100 sec bins |
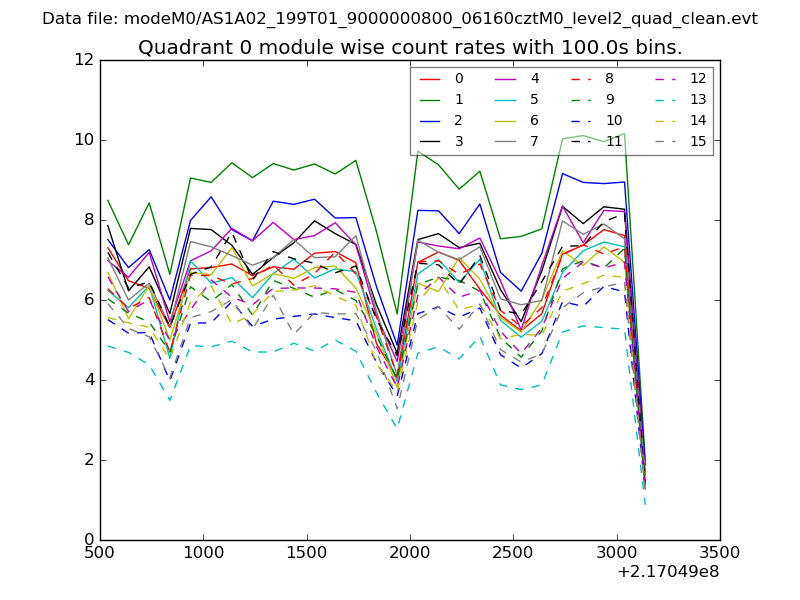 |
 |
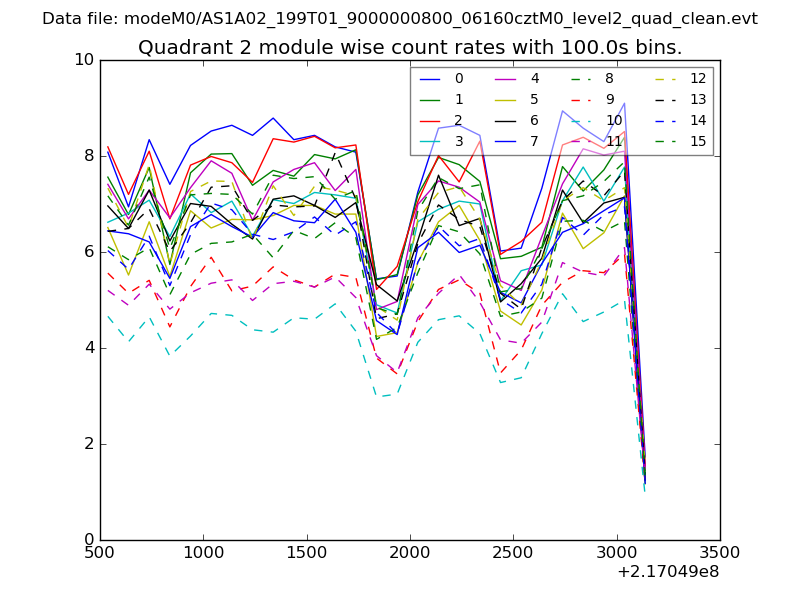
| Module-wise count rates for Quadrant B Data is divided into 100 sec bins |
 |
 |
| Module-wise count rates for Quadrant C Data is divided into 100 sec bins |
 |
 |
| Module-wise count rates for Quadrant D Data is divided into 100 sec bins |
 |
 |
| Parameter | Plot |
|---|---|
| CZT HV Monitor | 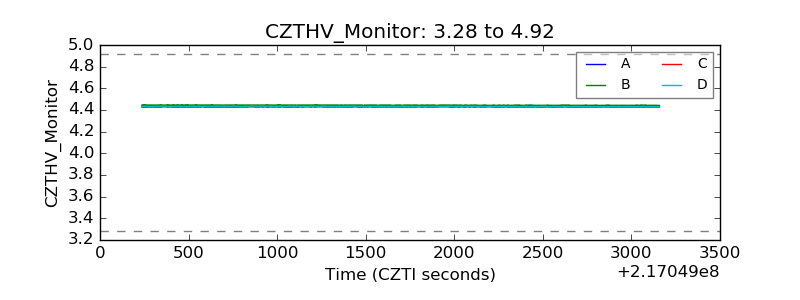 |
| D_VDD | 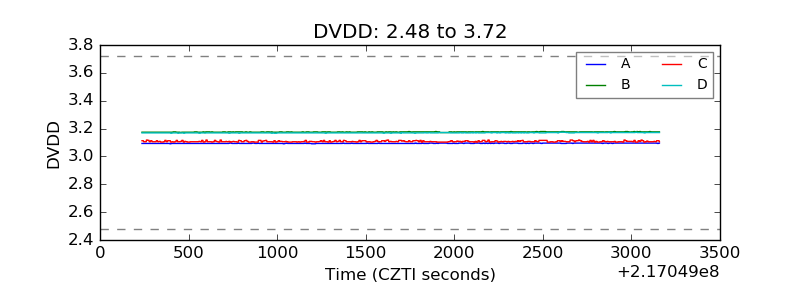 |
| Temperature 1 | 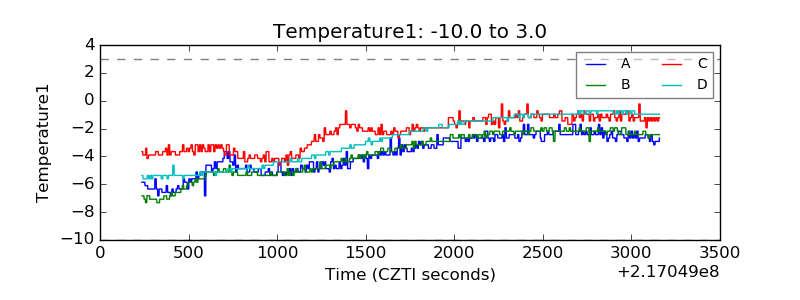 |
| Veto HV Monitor | 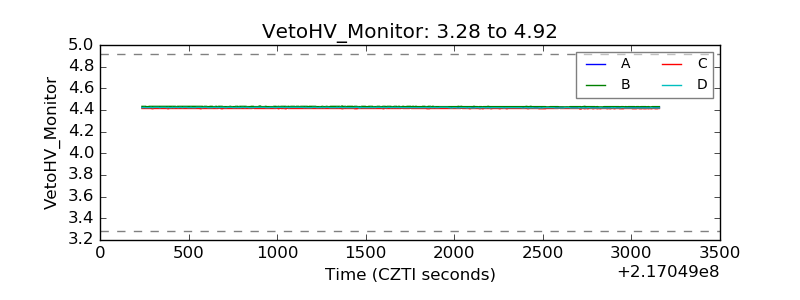 |
| Veto LLD | 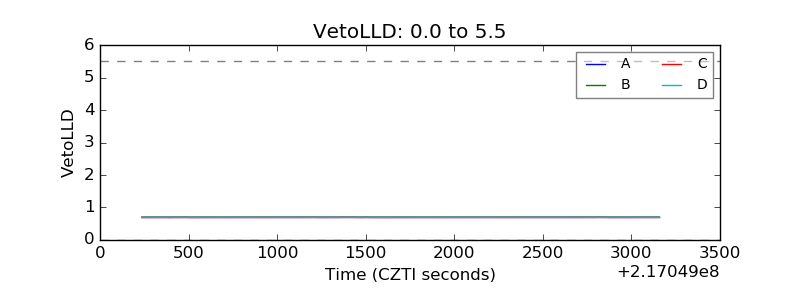 |
| Alpha Counter | 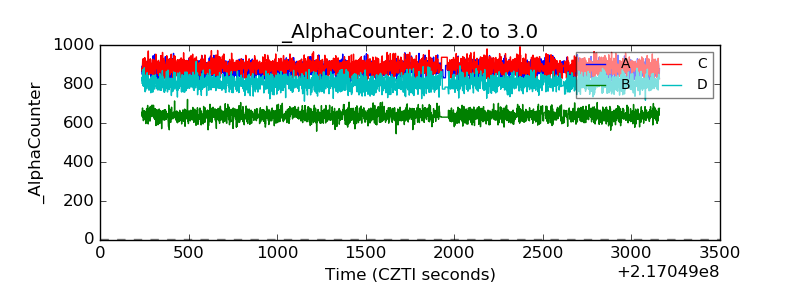 |
| _CPM_Rate | 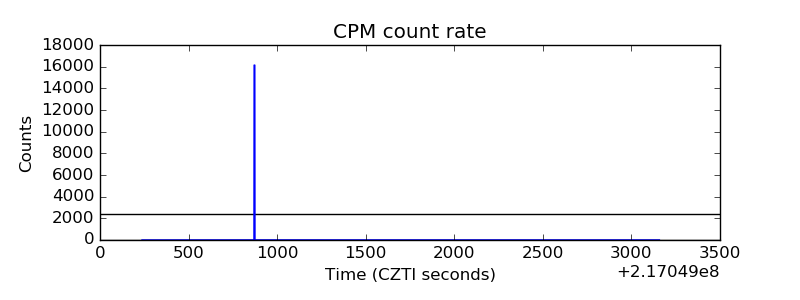 |
| CZT Counter | 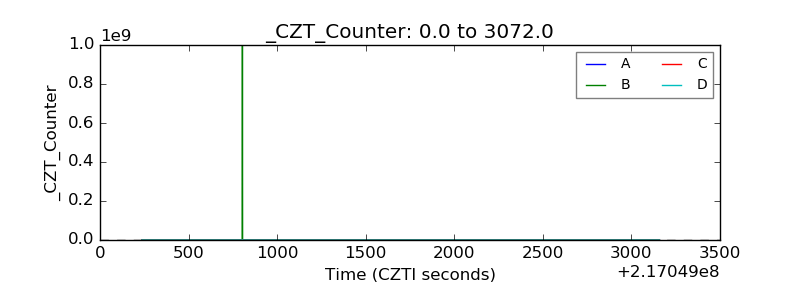 |
| +2.5 Volts monitor | 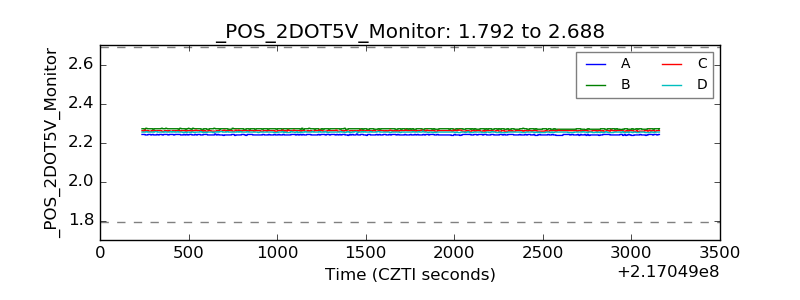 |
| +5 Volts monitor | 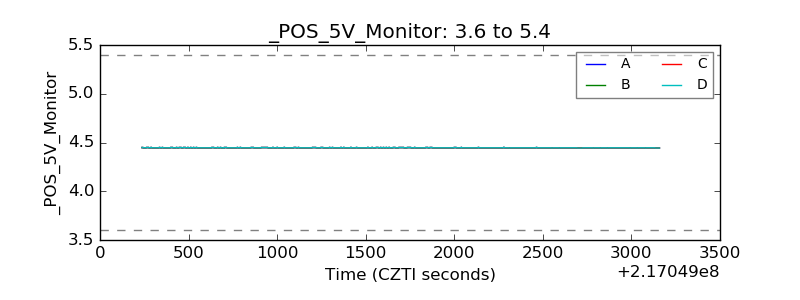 |
| _ROLL_ROT | 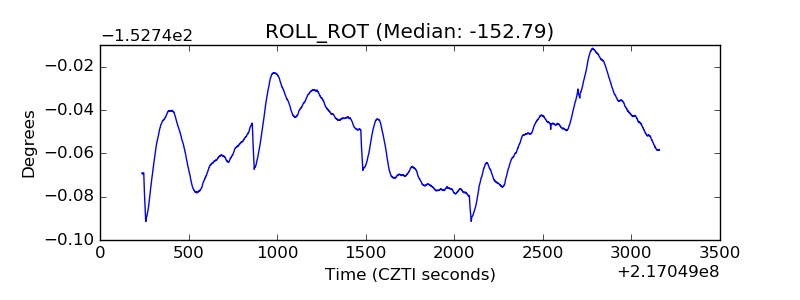 |
| _Roll_DEC | 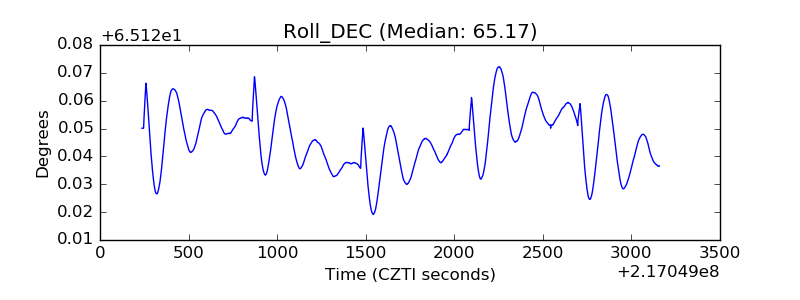 |
| _Roll_RA | 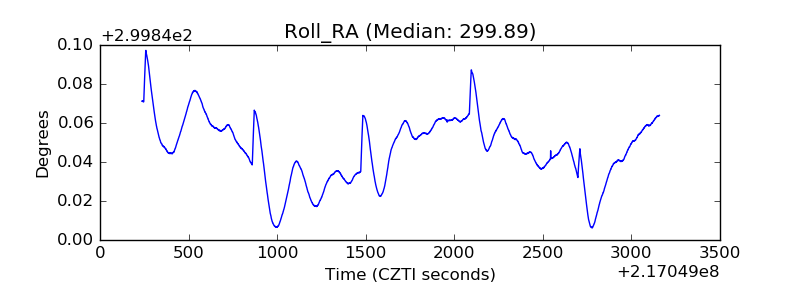 |
| Veto Counter | 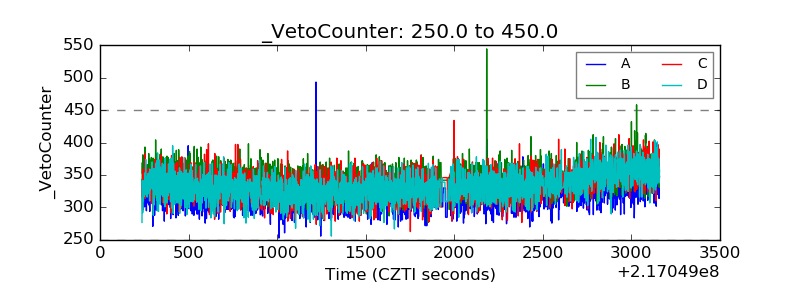 |