| Param | Original file | Final file |
|---|---|---|
| Filename | modeM0/AS1A02_199T01_9000000800_06161cztM0_level2.evt | modeM0/AS1A02_199T01_9000000800_06161cztM0_level2_quad_clean.evt |
| Size (bytes) | 108,567,360 | 26,691,840 |
| Size | 103.5 MB | 25.5 MB |
| Events in quadrant A | 762,507 | 169,595 |
| Events in quadrant B | 843,415 | 173,632 |
| Events in quadrant C | 733,980 | 170,095 |
| Events in quadrant D | 819,320 | 159,483 |
| Mode SS | |||
|---|---|---|---|
| Quadrant | BADHDUFLAG | Total packets | Discarded packets |
| A | 0 | 36 | 0 |
| B | 0 | 36 | 0 |
| C | 0 | 36 | 0 |
| D | 0 | 36 | 0 |
| Mode M0 | |||
|---|---|---|---|
| Quadrant | BADHDUFLAG | Total packets | Discarded packets |
| A | 0 | 3702 | 1 |
| B | 0 | 3855 | 4 |
| C | 0 | 3704 | 0 |
| D | 0 | 3905 | 0 |
| Quadrant | Total seconds | Saturated seconds | Saturation percentage |
|---|---|---|---|
| A | 1850 | 0 | 0.000000% |
| B | 1848 | 0 | 0.000000% |
| C | 1850 | 0 | 0.000000% |
| D | 1850 | 4 | 0.216216% |
Noise dominated data is calculated using 1-second bins in cleaned event files. If a bin has >2000 counts, and if more than 50% of those come from <1% of pixels, then it is considered to be noise-dominated and hence unusable.
| Quadrant | # 1 sec bins | Bins with >0 counts | Bins with >2000 counts | High rate bins dominated by noise | Noise dominated (total time) | Noise dominated (detector-on time) | Marked lightcurve |
|---|---|---|---|---|---|---|---|
| A | 1850 | 1850 | 0 | 0 | 0.00% | 0.00% | 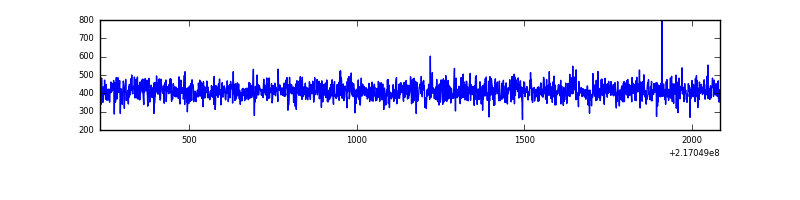 |
| B | 1850 | 1850 | 1 | 1 | 0.05% | 0.05% | 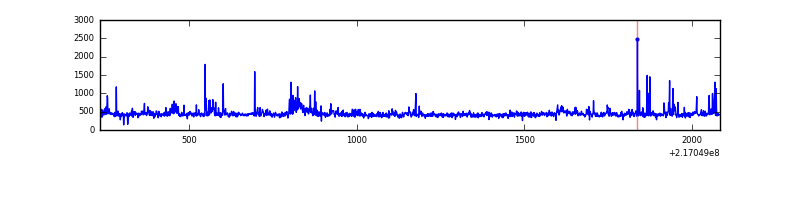 |
| C | 1850 | 1850 | 0 | 0 | 0.00% | 0.00% | 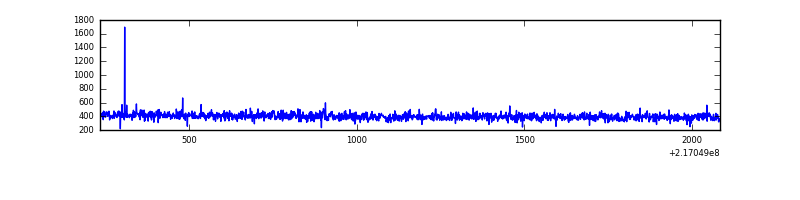 |
| D | 1850 | 1850 | 4 | 4 | 0.22% | 0.22% | 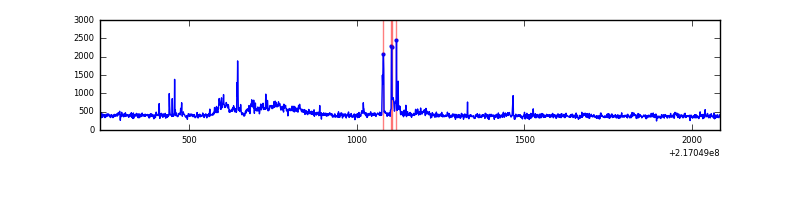 |
Top three noisy pixels from each quadrant. If the there are fewer than three noisy pixels in the level2.evt file, extra rows are filled as -1
| Pixel properties | Quadrant properties | ||||||
|---|---|---|---|---|---|---|---|
| Quadrant | DetID | PixID | Counts | Sigma | Mean | Median | Sigma |
| A | 8 | 15 | 17951 | 426.82 | 193 | 189 | 41.6 |
| A | 12 | 194 | 1812 | 39.0 | 193 | 189 | 41.6 |
| A | 0 | 226 | 1807 | 38.88 | 193 | 189 | 41.6 |
| B | 0 | 219 | 55814 | 1398.51 | 194 | 190 | 39.8 |
| B | 3 | 64 | 23275 | 580.41 | 194 | 190 | 39.8 |
| B | 15 | 204 | 8469 | 208.15 | 194 | 190 | 39.8 |
| C | 1 | 16 | 7280 | 159.94 | 183 | 184 | 44.4 |
| C | 8 | 128 | 5030 | 109.23 | 183 | 184 | 44.4 |
| C | 8 | 112 | 2270 | 47.02 | 183 | 184 | 44.4 |
| D | 9 | 35 | 85164 | 1863.24 | 182 | 175 | 45.6 |
| D | 5 | 97 | 23164 | 504.0 | 182 | 175 | 45.6 |
| D | 8 | 195 | 14050 | 304.19 | 182 | 175 | 45.6 |
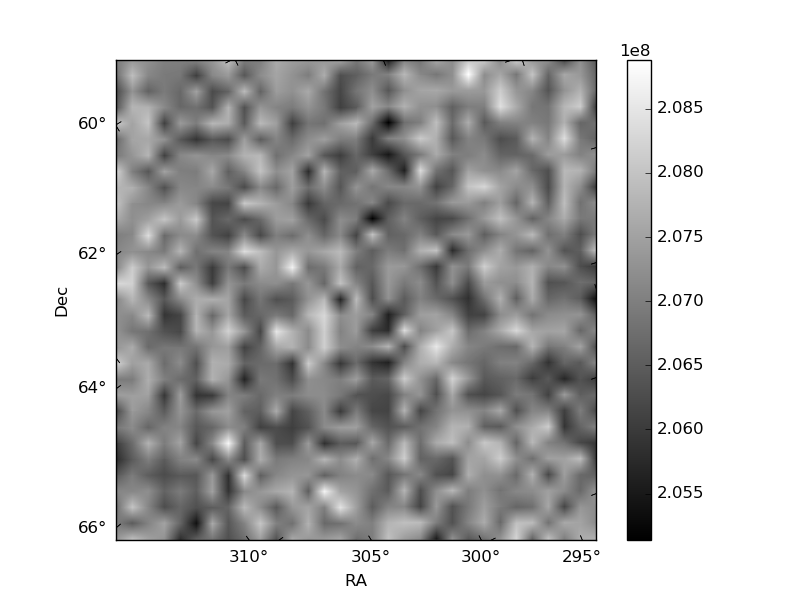
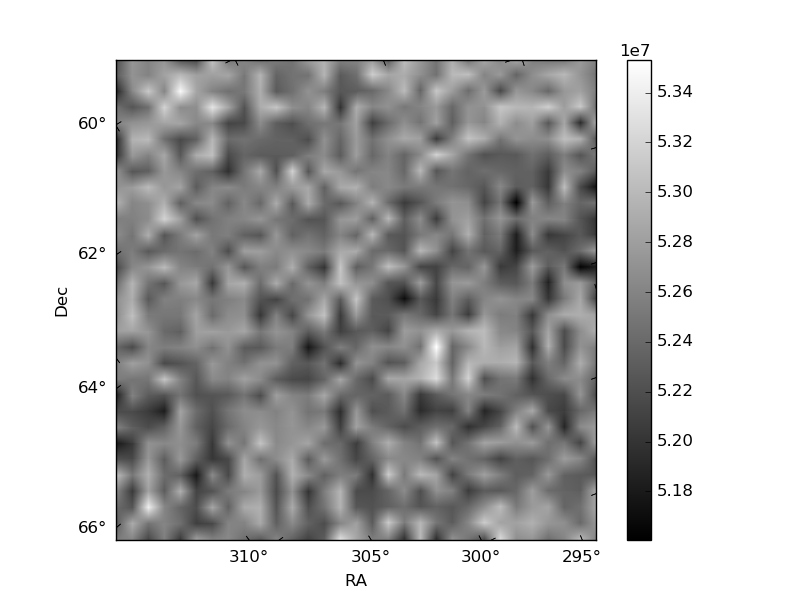
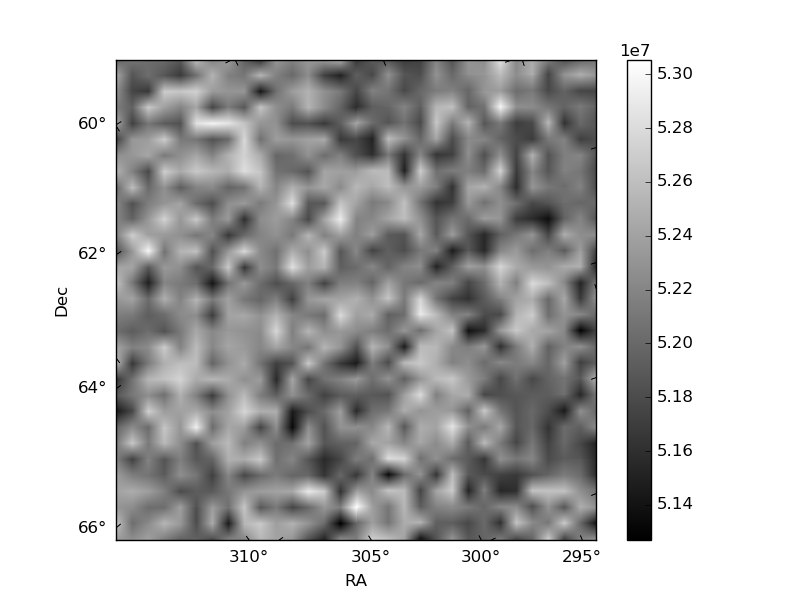
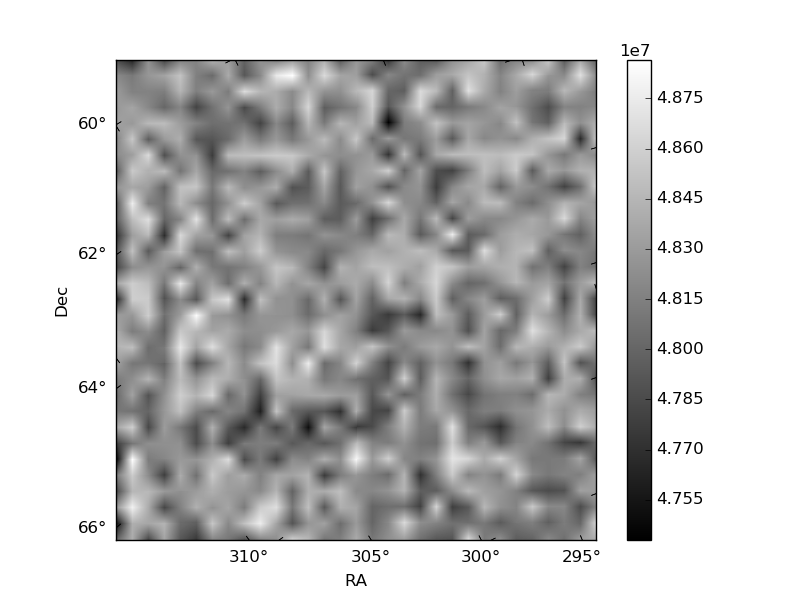
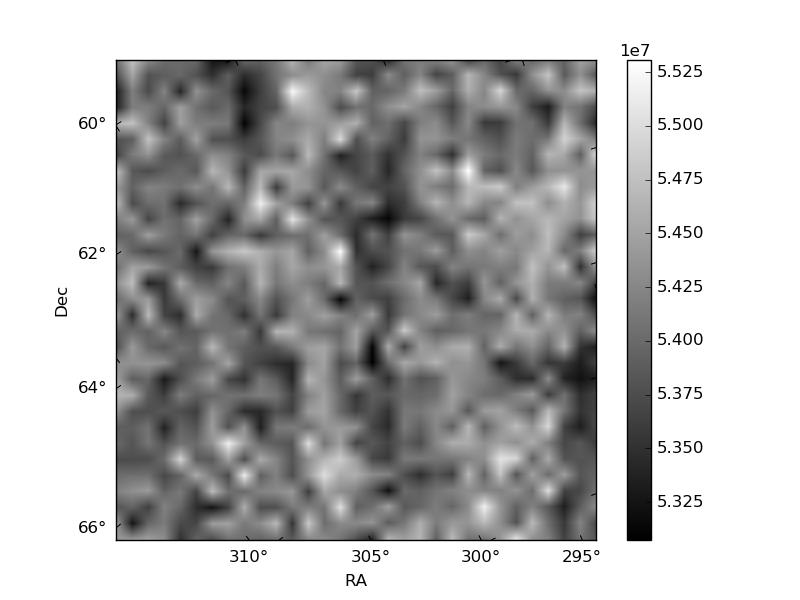
Histogram calculated using DETX and DETY for each event in the final _common_clean file
| Quadrant A | 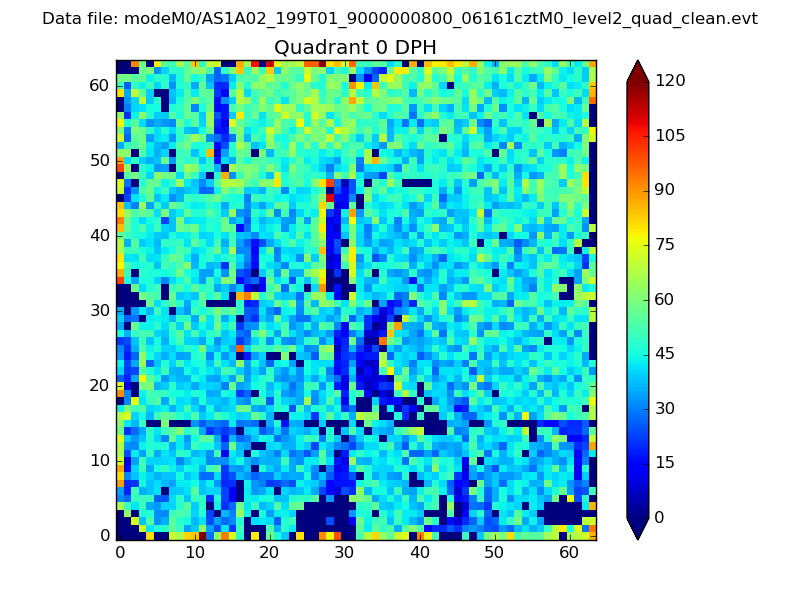 |
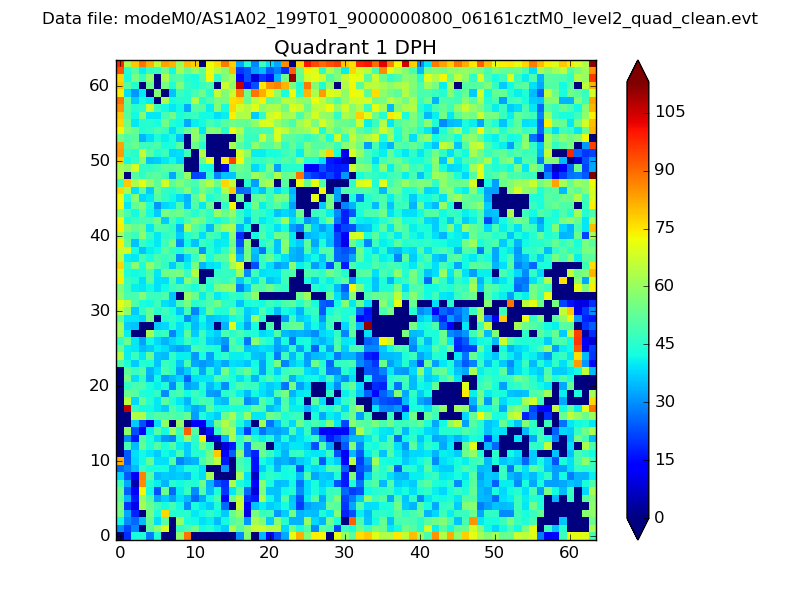 |
Quadrant B |
|---|---|---|---|
| Quadrant D | 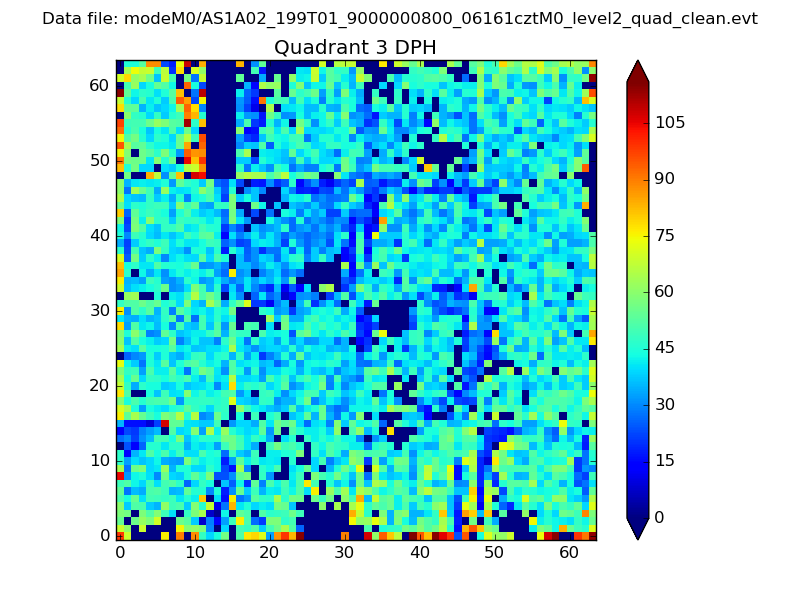 |
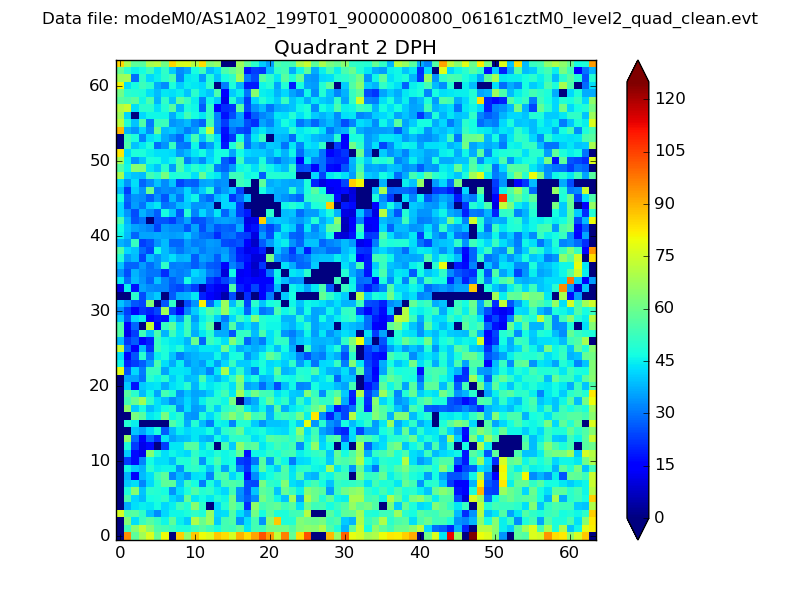 |
Quadrant C |
| Plot type | Count rate plots | Images |
|---|---|---|
| Comparison with Poisson distribution Blue bars denote a histogram of data divided into 1 sec bins. Red curve is a Poisson curve with rate = median count rate of data. |
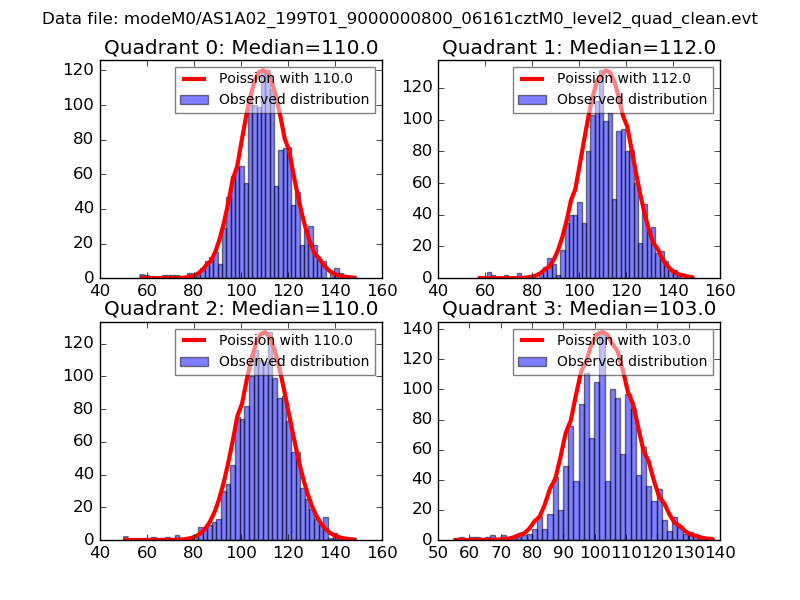 |
 |
| Quadrant-wise count rates Data is divided into 100 sec bins |
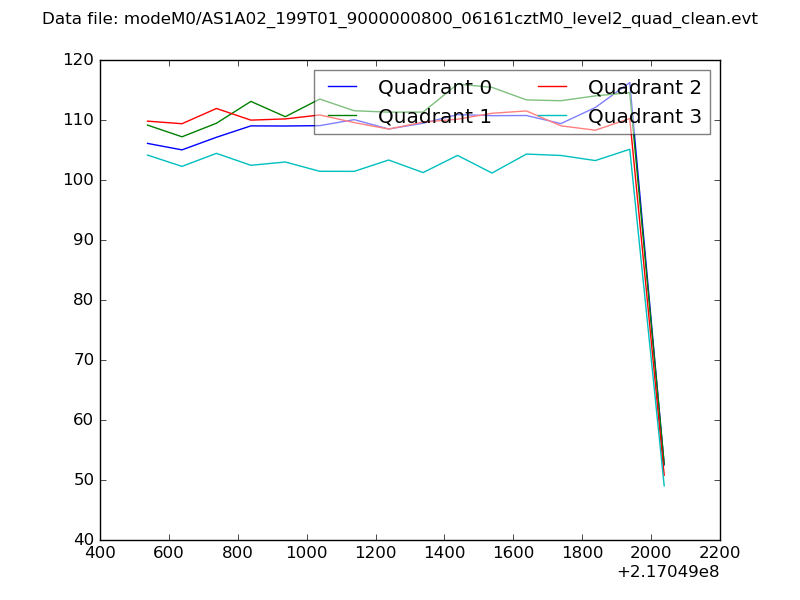 |
|
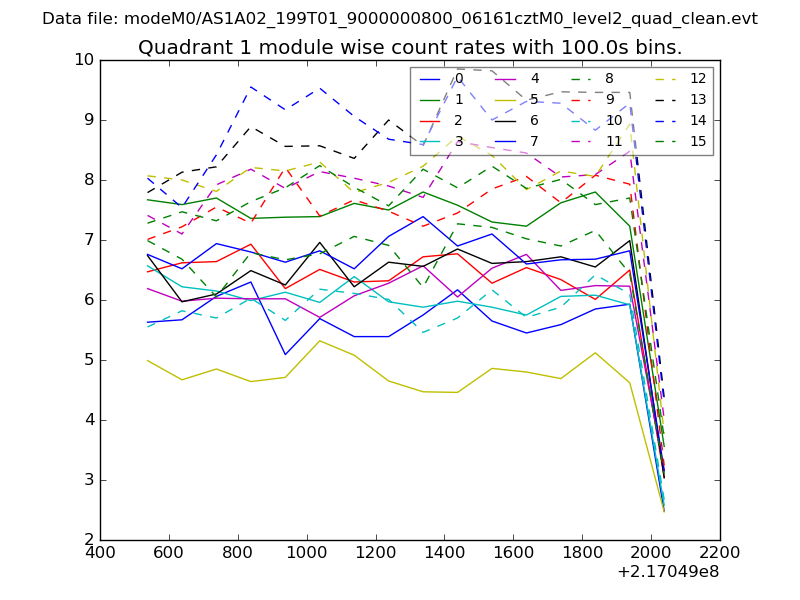
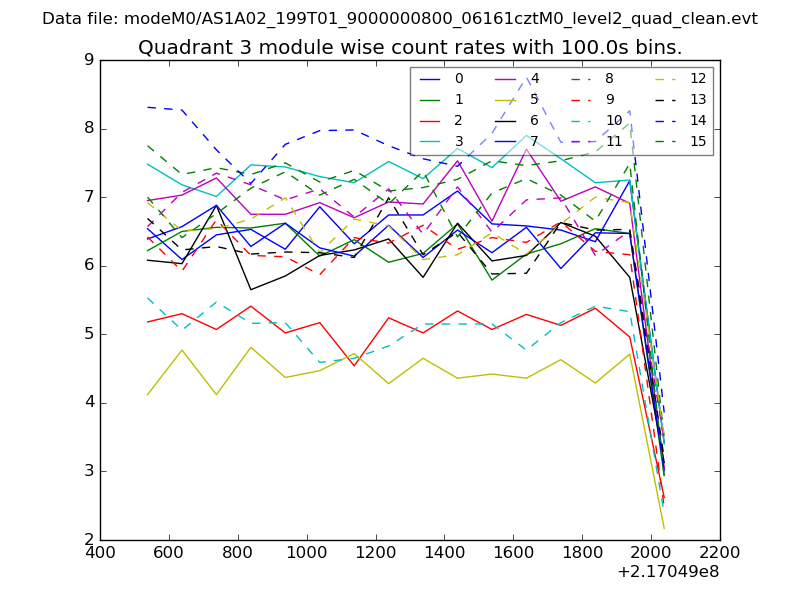
| Module-wise count rates for Quadrant A Data is divided into 100 sec bins |
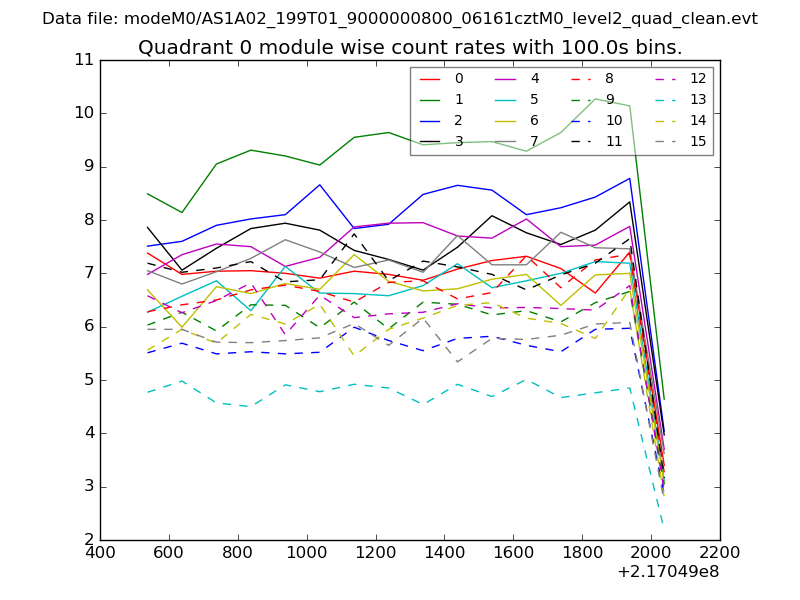 |
 |
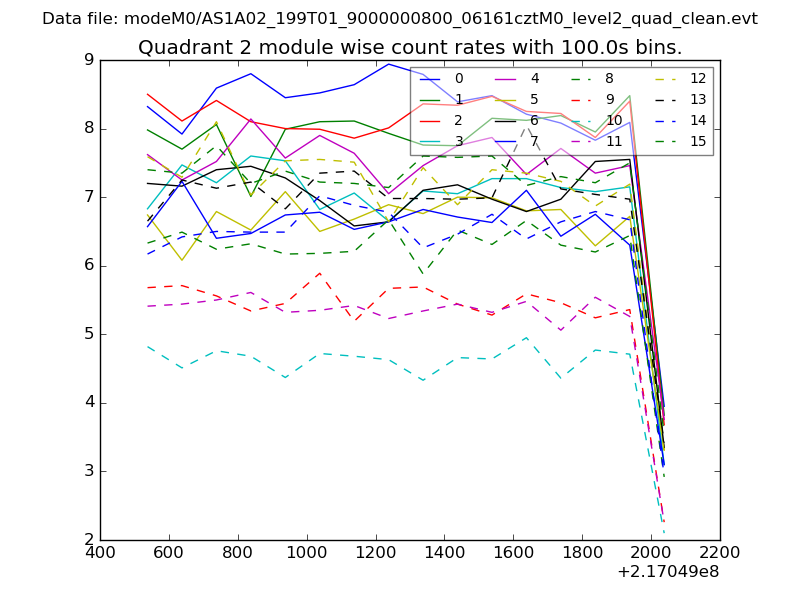
| Module-wise count rates for Quadrant B Data is divided into 100 sec bins |
 |
 |
| Module-wise count rates for Quadrant C Data is divided into 100 sec bins |
 |
 |
| Module-wise count rates for Quadrant D Data is divided into 100 sec bins |
 |
 |
| Parameter | Plot |
|---|---|
| CZT HV Monitor | 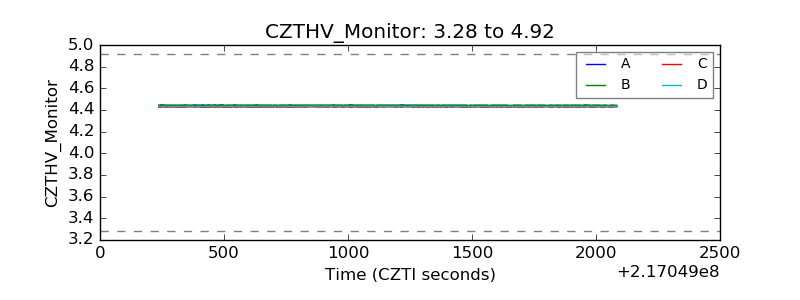 |
| D_VDD | 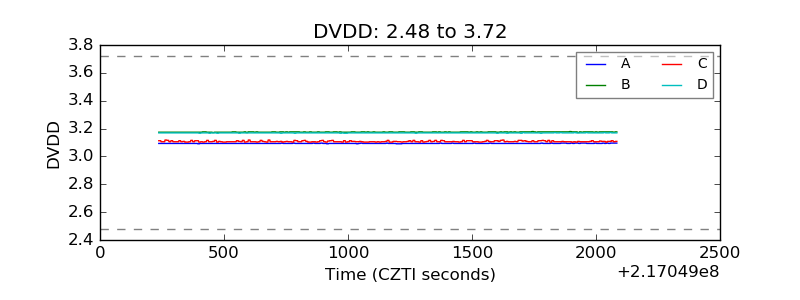 |
| Temperature 1 | 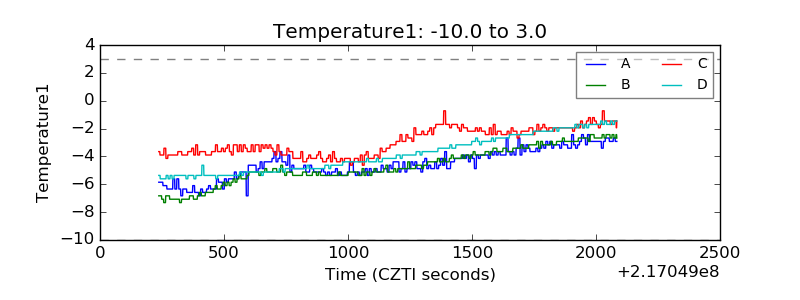 |
| Veto HV Monitor | 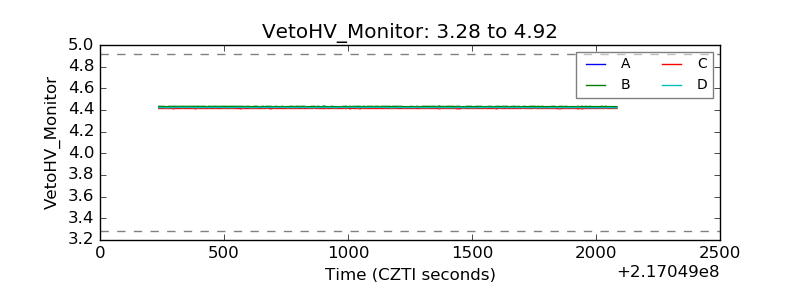 |
| Veto LLD | 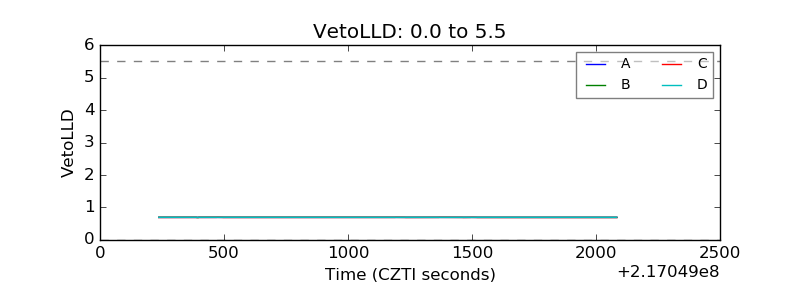 |
| Alpha Counter | 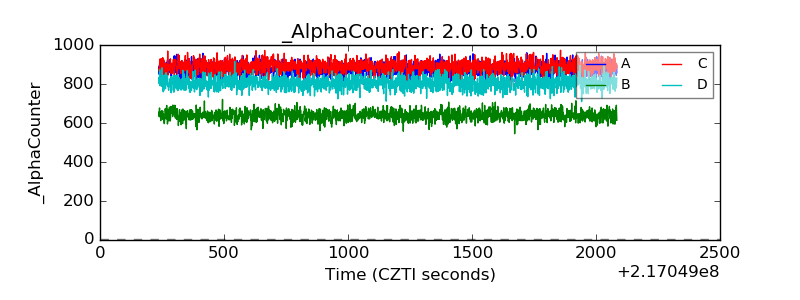 |
| _CPM_Rate | 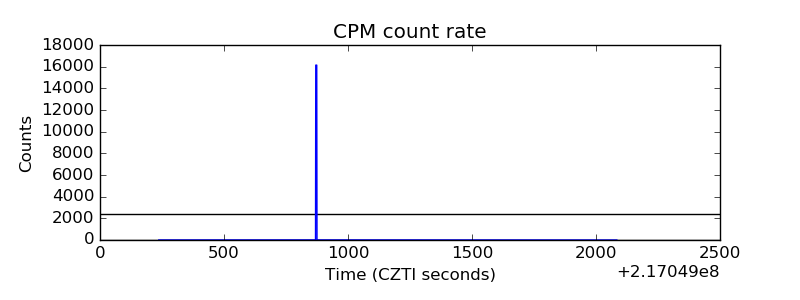 |
| CZT Counter | 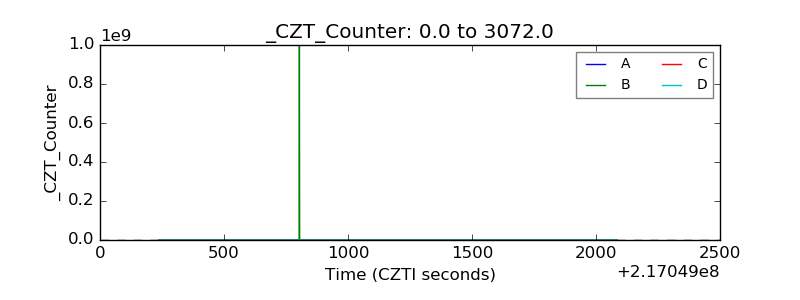 |
| +2.5 Volts monitor |  |
| +5 Volts monitor |  |
| _ROLL_ROT | 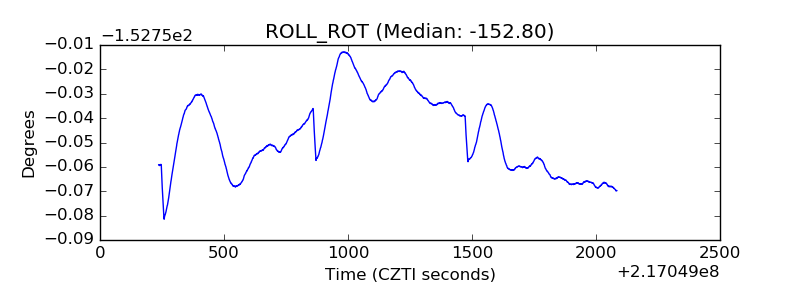 |
| _Roll_DEC | 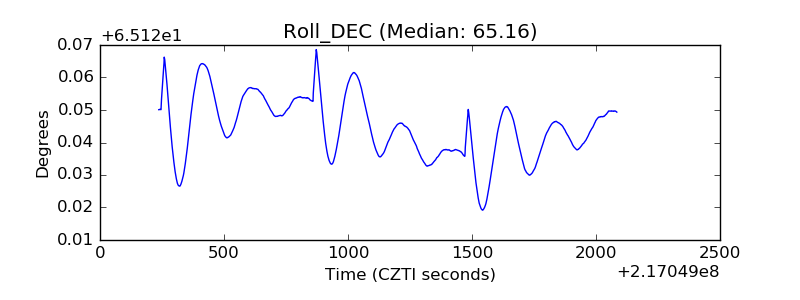 |
| _Roll_RA | 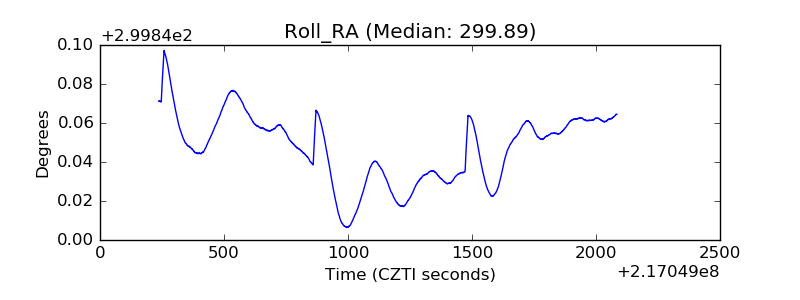 |
| Veto Counter | 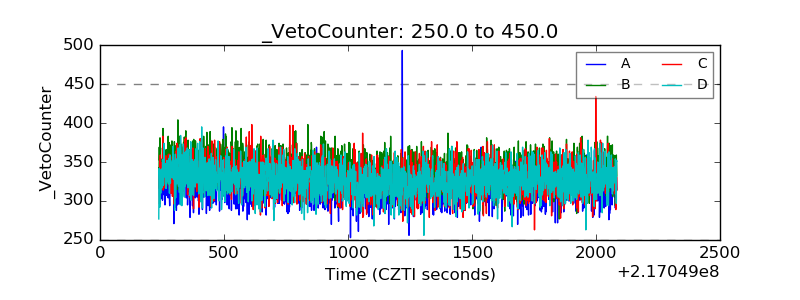 |