| Param | Original file | Final file |
|---|---|---|
| Filename | modeM0/AS1A02_006T01_9000000802cztM0_level2.fits | modeM0/AS1A02_006T01_9000000802cztM0_level2_quad_clean.evt |
| Size (bytes) | 418,740,480 | 459,383,040 |
| Size | 399.3 MB | 438.1 MB |
| Events in quadrant A | 2,524,452 | 2,836,112 |
| Events in quadrant B | 2,457,703 | 2,830,819 |
| Events in quadrant C | 2,485,920 | 2,680,762 |
| Events in quadrant D | 2,145,574 | 2,499,218 |
| Mode M0 | |||
|---|---|---|---|
| Quadrant | BADHDUFLAG | Total packets | Discarded packets |
| A | 0 | 94386 | 0 |
| B | 0 | 97394 | 0 |
| C | 0 | 93170 | 0 |
| D | 0 | 94878 | 0 |
| Mode SS | |||
|---|---|---|---|
| Quadrant | BADHDUFLAG | Total packets | Discarded packets |
| A | 0 | 922 | 0 |
| B | 0 | 925 | 0 |
| C | 0 | 904 | 0 |
| D | 0 | 920 | 0 |
| Mode M9 | |||
|---|---|---|---|
| Quadrant | BADHDUFLAG | Total packets | Discarded packets |
| A | 0 | 99 | 0 |
| B | 0 | 98 | 0 |
| C | 0 | 100 | 0 |
| D | 0 | 96 | 0 |
| Quadrant | Total seconds | Saturated seconds | Saturation percentage |
|---|---|---|---|
| A | 44652 | 550 | 1.231748% |
| B | 44569 | 753 | 1.689515% |
| C | 44667 | 389 | 0.870889% |
| D | 44655 | 521 | 1.166723% |
Noise dominated data is calculated using 1-second bins in cleaned event files. If a bin has >2000 counts, and if more than 50% of those come from <1% of pixels, then it is considered to be noise-dominated and hence unusable.
| Quadrant | # 1 sec bins | Bins with >0 counts | Bins with >2000 counts | High rate bins dominated by noise | Noise dominated (total time) | Noise dominated (detector-on time) | Marked lightcurve |
|---|---|---|---|---|---|---|---|
| A | 59499 | 46133 | 0 | 0 | 0.00% | 0.00% | 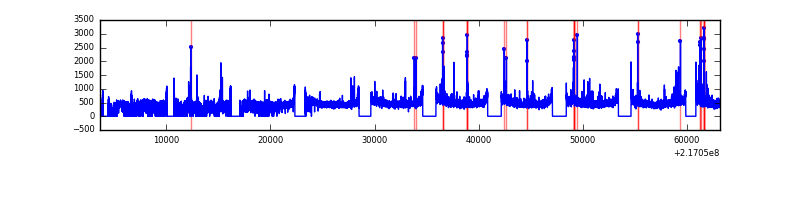 |
| B | 59521 | 46058 | 0 | 0 | 0.00% | 0.00% | 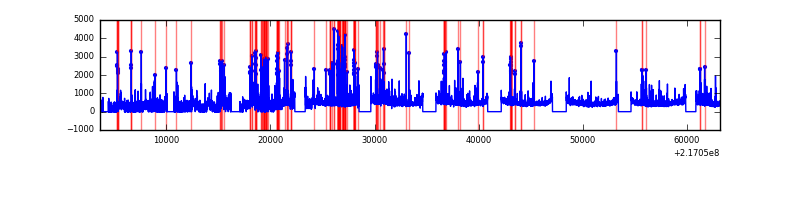 |
| C | 59488 | 46174 | 0 | 0 | 0.00% | 0.00% | 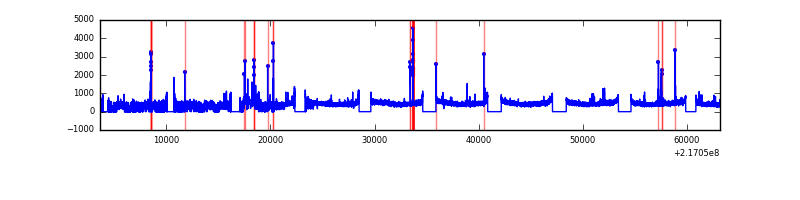 |
| D | 59489 | 46128 | 0 | 0 | 0.00% | 0.00% | 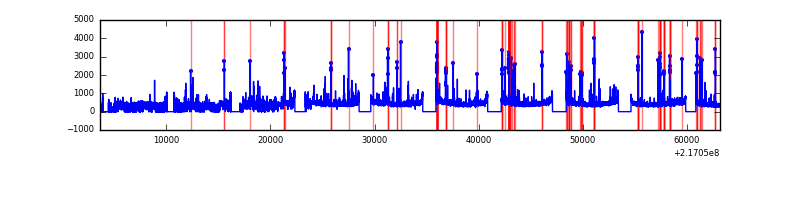 |
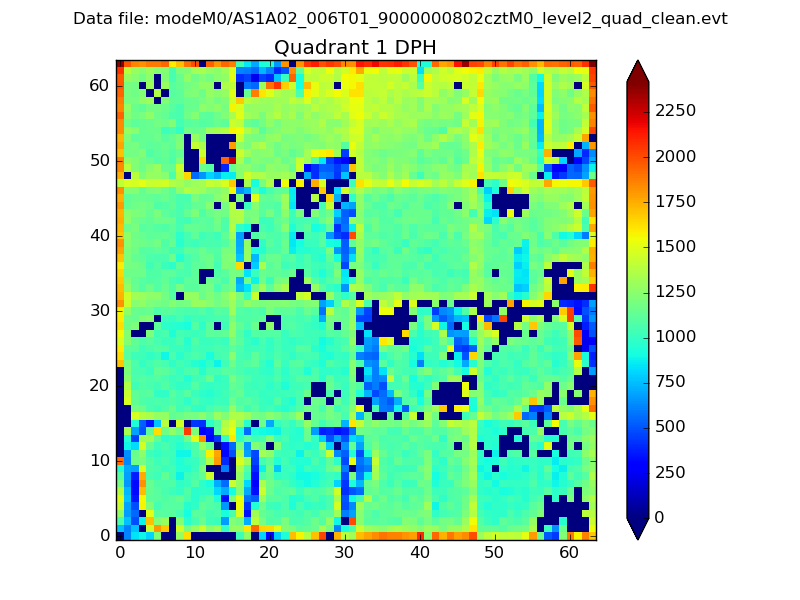
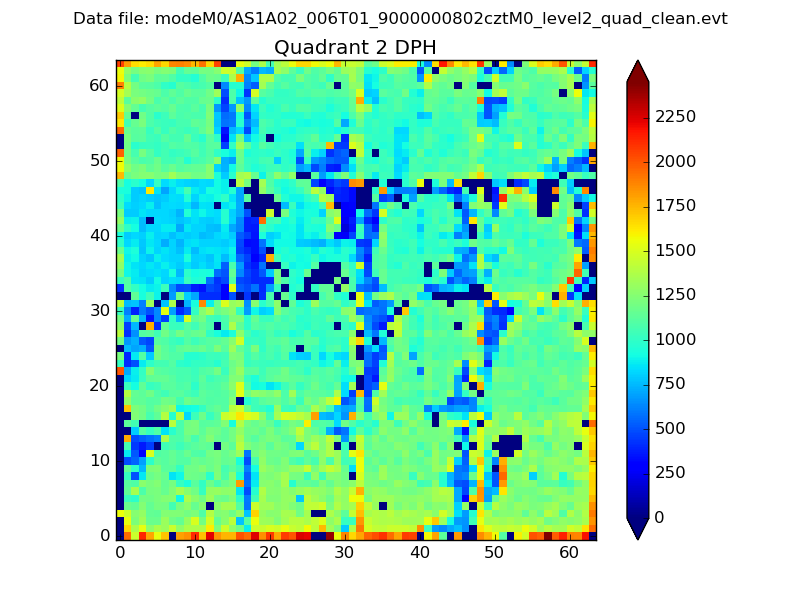
Top three noisy pixels from each quadrant. If the there are fewer than three noisy pixels in the level2.evt file, extra rows are filled as -1
| Pixel properties | Quadrant properties | ||||||
|---|---|---|---|---|---|---|---|
| Quadrant | DetID | PixID | Counts | Sigma | Mean | Median | Sigma |
| A | 14 | 188 | 2466 | 11.16 | 655 | 614 | 166.0 |
| A | 0 | 29 | 2421 | 10.89 | 655 | 614 | 166.0 |
| A | 14 | 204 | 2159 | 9.31 | 655 | 614 | 166.0 |
| B | 2 | 9 | 2096 | 11.44 | 647 | 617 | 129.3 |
| B | 12 | 226 | 1690 | 8.3 | 647 | 617 | 129.3 |
| B | 14 | 254 | 1673 | 8.17 | 647 | 617 | 129.3 |
| C | 1 | 80 | 1856 | 7.13 | 657 | 610 | 174.7 |
| C | 1 | 81 | 1815 | 6.9 | 657 | 610 | 174.7 |
| C | 12 | 241 | 1756 | 6.56 | 657 | 610 | 174.7 |
| D | 3 | 14 | 1680 | 6.78 | 611 | 553 | 166.3 |
| D | 11 | 82 | 1588 | 6.22 | 611 | 553 | 166.3 |
| D | 7 | 5 | 1568 | 6.1 | 611 | 553 | 166.3 |
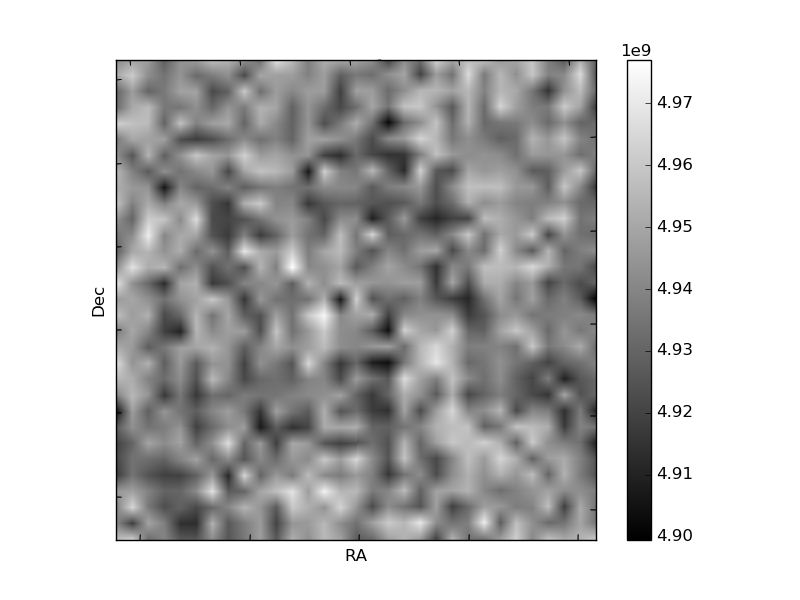
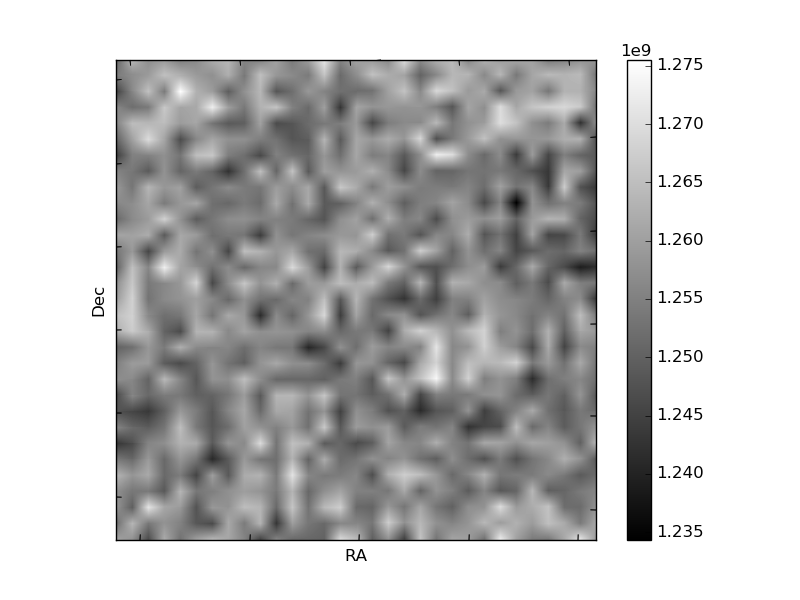
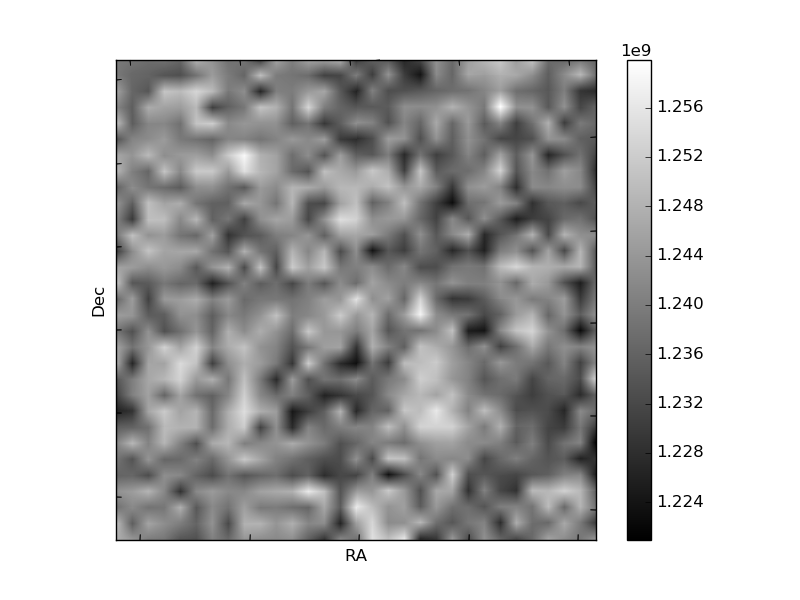
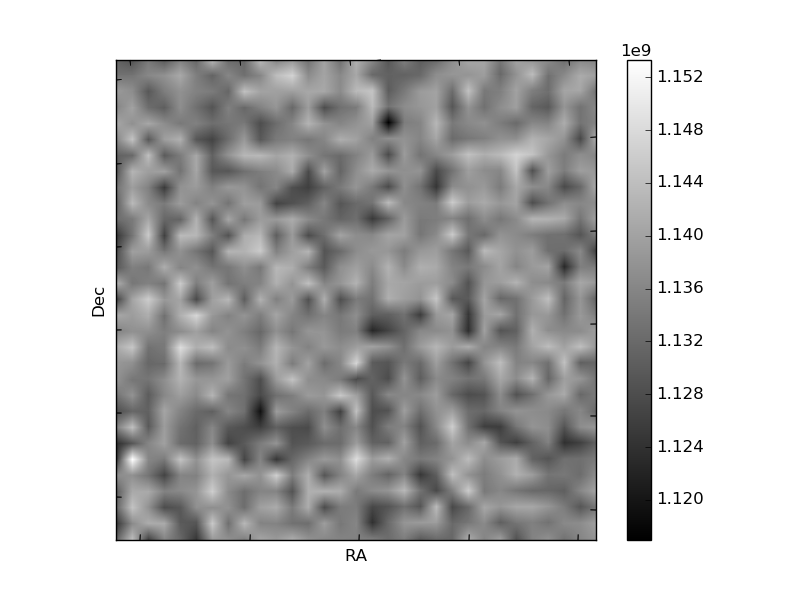
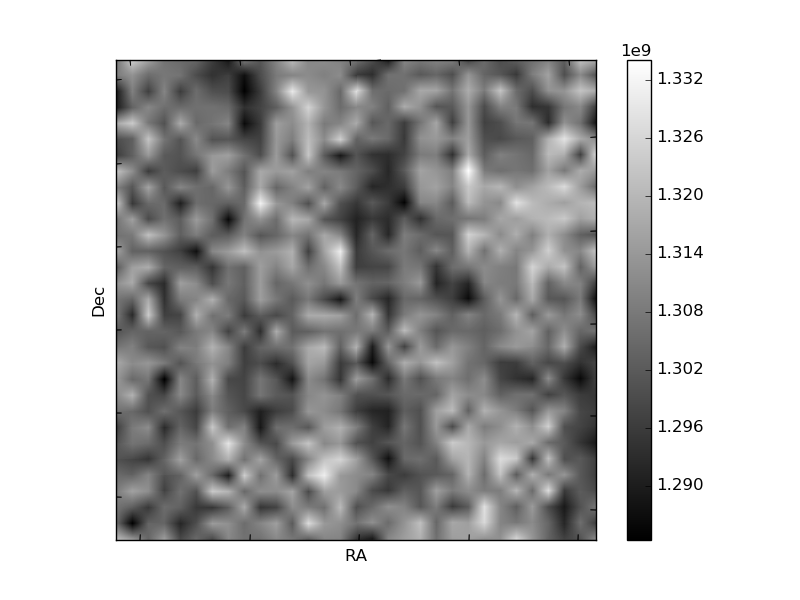
Histogram calculated using DETX and DETY for each event in the final _common_clean file
| Quadrant A | 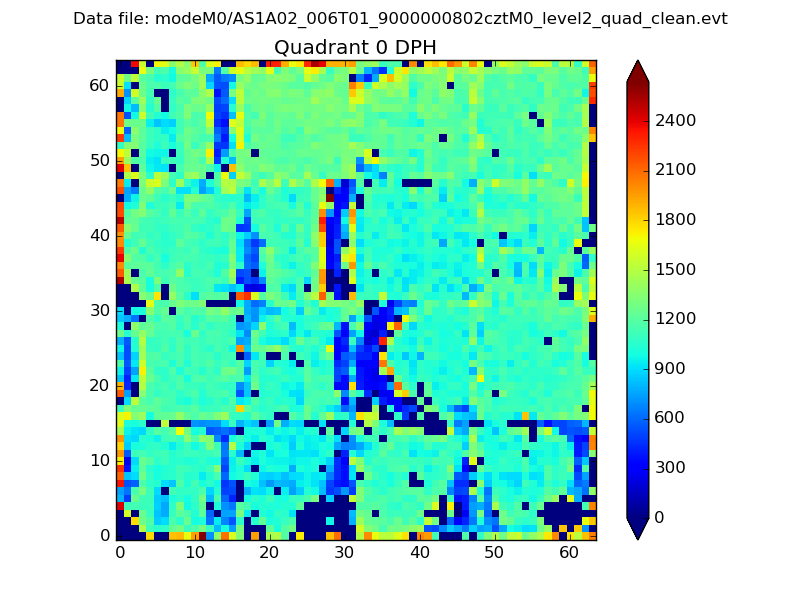 |
 |
Quadrant B |
|---|---|---|---|
| Quadrant D | 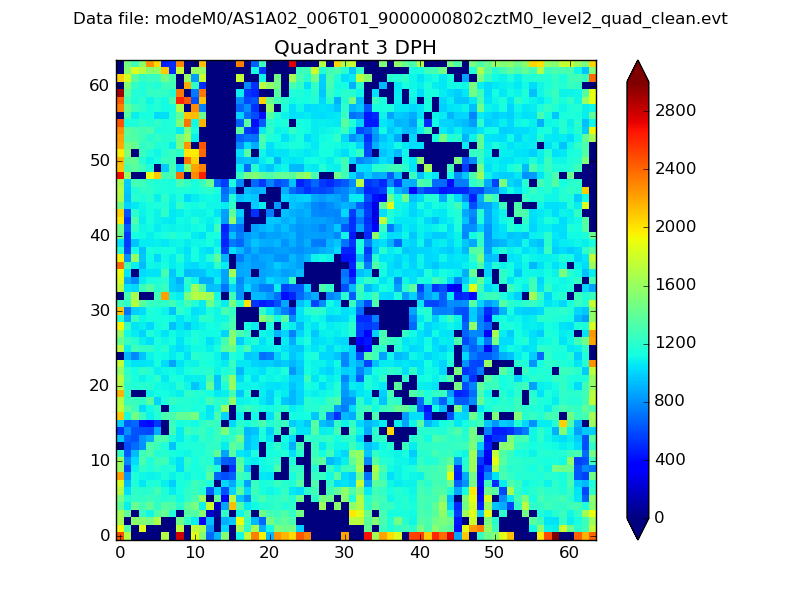 |
 |
Quadrant C |
| Plot type | Count rate plots | Images |
|---|---|---|
| Comparison with Poisson distribution Blue bars denote a histogram of data divided into 1 sec bins. Red curve is a Poisson curve with rate = median count rate of data. |
 |
 |
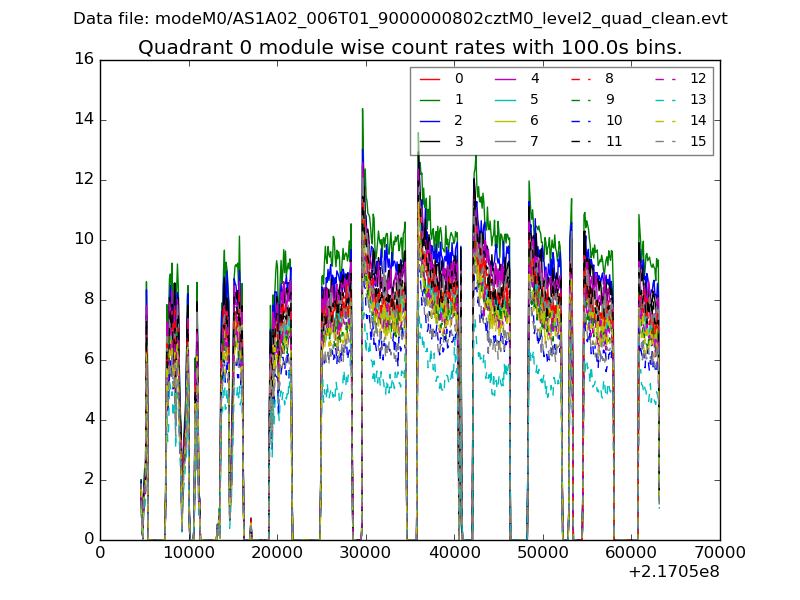
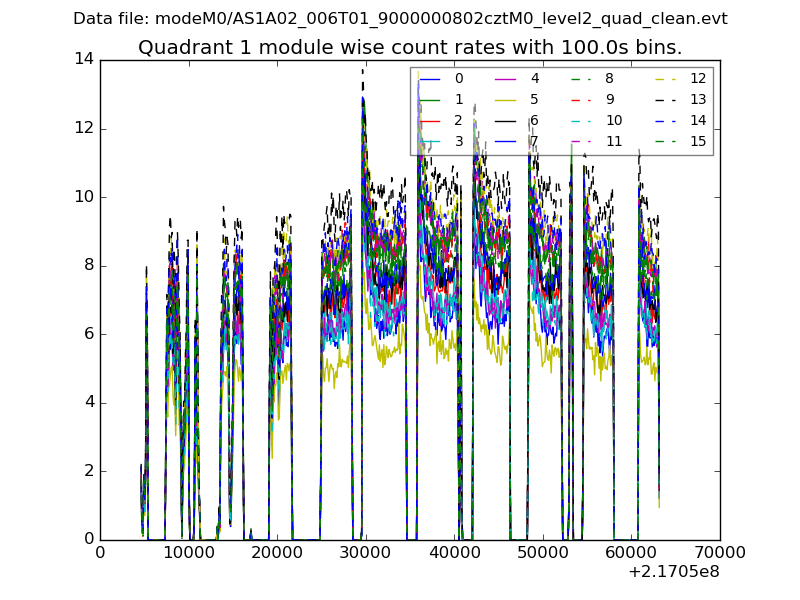
| Quadrant-wise count rates Data is divided into 100 sec bins |
 |
|
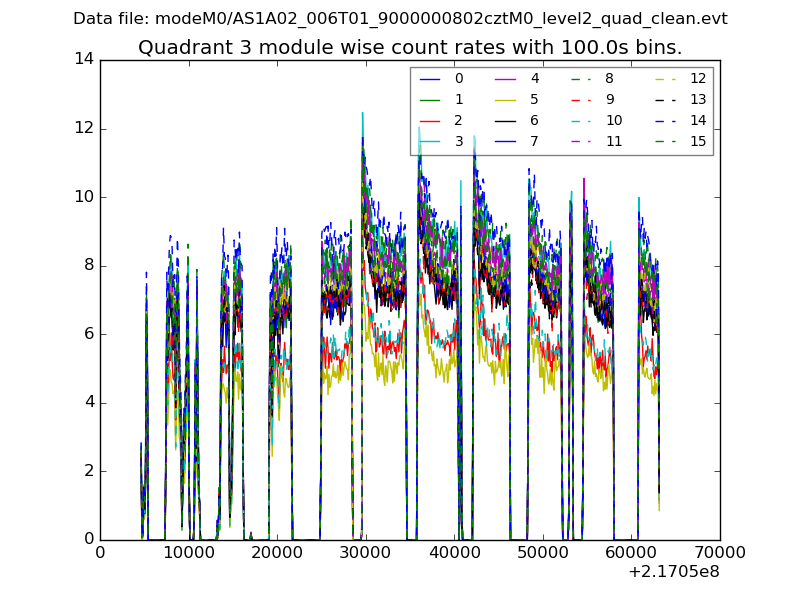
| Module-wise count rates for Quadrant A Data is divided into 100 sec bins |
 |
 |
| Module-wise count rates for Quadrant B Data is divided into 100 sec bins |
 |
 |
| Module-wise count rates for Quadrant C Data is divided into 100 sec bins |
 |
 |
| Module-wise count rates for Quadrant D Data is divided into 100 sec bins |
 |
 |
| Parameter | Plot |
|---|---|
| CZT HV Monitor | 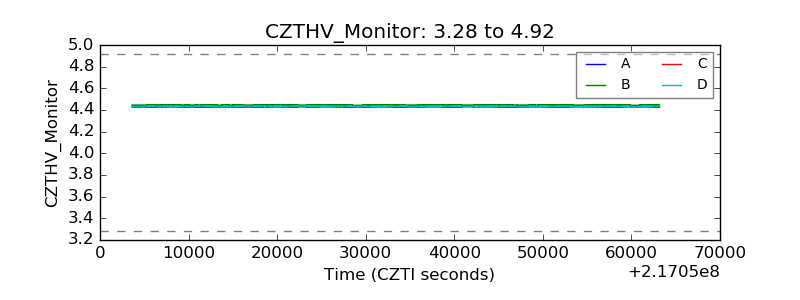 |
| D_VDD | 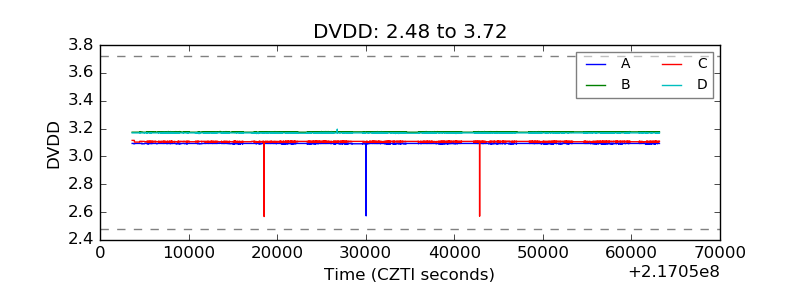 |
| Temperature 1 | 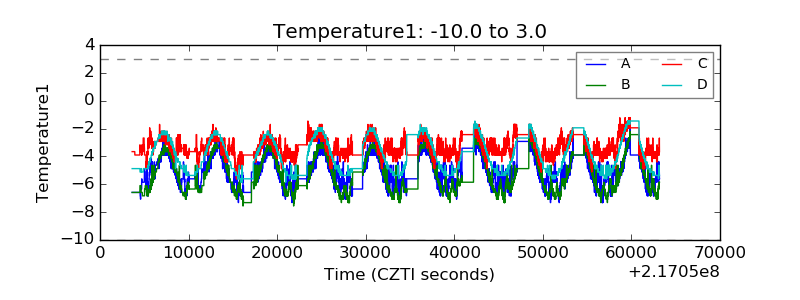 |
| Veto HV Monitor |  |
| Veto LLD | 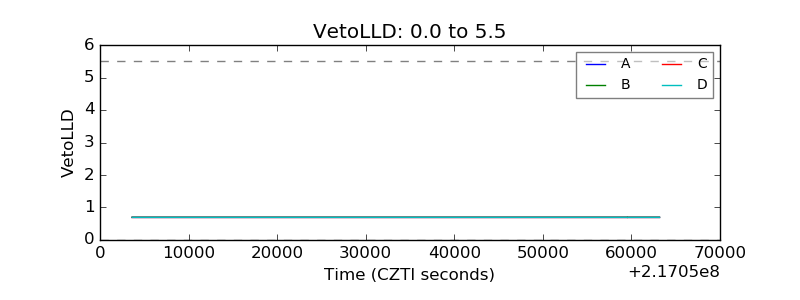 |
| Alpha Counter | 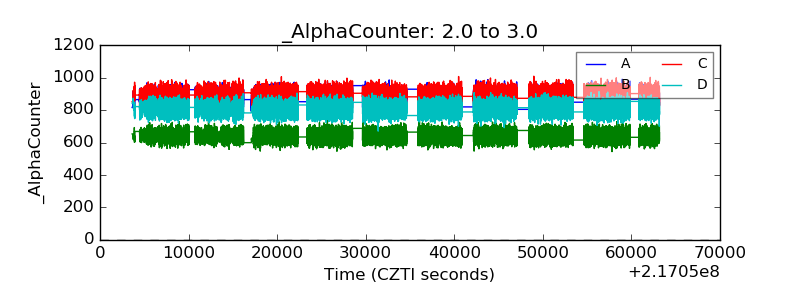 |
| _CPM_Rate | 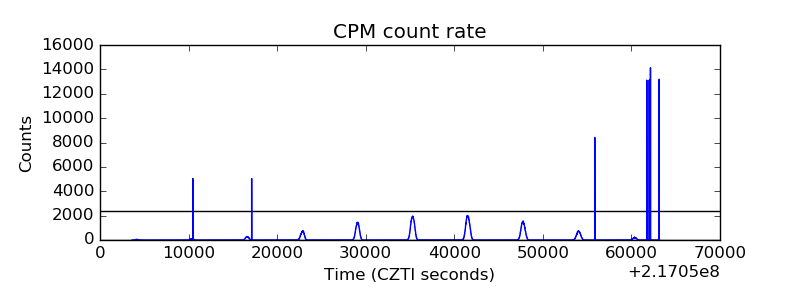 |
| CZT Counter |  |
| +2.5 Volts monitor |  |
| +5 Volts monitor | 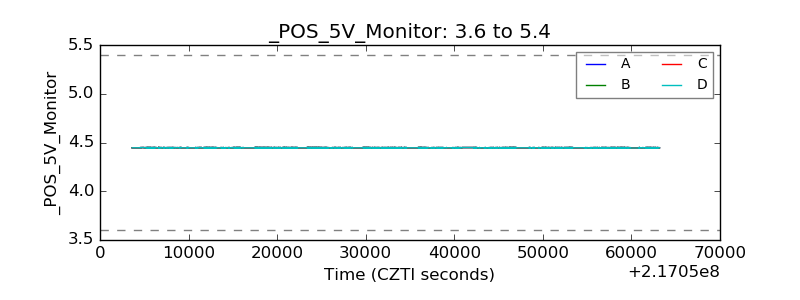 |
| _ROLL_ROT |  |
| _Roll_DEC | 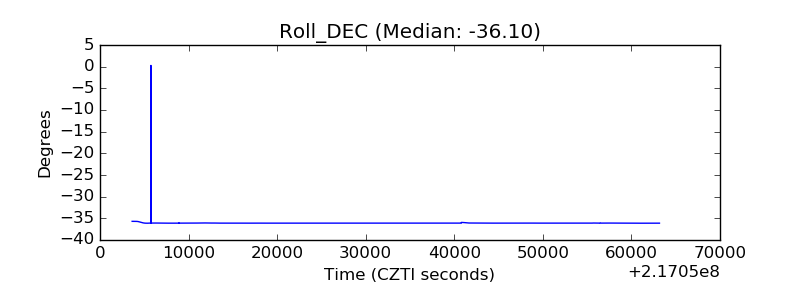 |
| _Roll_RA | 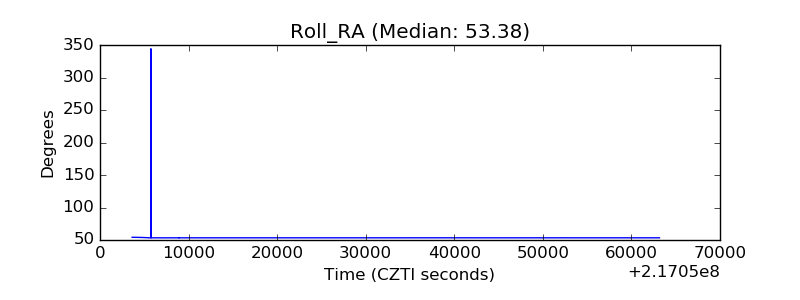 |
| Veto Counter | 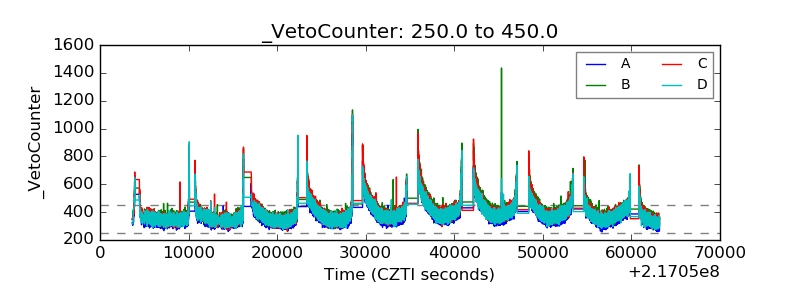 |