| Param | Original file | Final file |
|---|---|---|
| Filename | modeM0/AS1A02_006T01_9000000802_06160cztM0_level2.evt | modeM0/AS1A02_006T01_9000000802_06160cztM0_level2_quad_clean.evt |
| Size (bytes) | 709,830,720 | 120,277,440 |
| Size | 676.9 MB | 114.7 MB |
| Events in quadrant A | 5,182,186 | 727,573 |
| Events in quadrant B | 5,457,258 | 728,313 |
| Events in quadrant C | 5,227,505 | 719,858 |
| Events in quadrant D | 4,879,615 | 701,681 |
| Mode M0 | |||
|---|---|---|---|
| Quadrant | BADHDUFLAG | Total packets | Discarded packets |
| A | 0 | 26854 | 3980 |
| B | 0 | 27916 | 4328 |
| C | 0 | 27507 | 4141 |
| D | 0 | 26779 | 4098 |
| Mode SS | |||
|---|---|---|---|
| Quadrant | BADHDUFLAG | Total packets | Discarded packets |
| A | 0 | 266 | 40 |
| B | 0 | 266 | 40 |
| C | 0 | 266 | 32 |
| D | 0 | 266 | 46 |
| Mode M9 | |||
|---|---|---|---|
| Quadrant | BADHDUFLAG | Total packets | Discarded packets |
| A | 0 | 19 | 6 |
| B | 0 | 19 | 5 |
| C | 0 | 19 | 1 |
| D | 0 | 19 | 1 |
| Quadrant | Total seconds | Saturated seconds | Saturation percentage |
|---|---|---|---|
| A | 11084 | 153 | 1.380368% |
| B | 10997 | 213 | 1.936892% |
| C | 11027 | 164 | 1.487259% |
| D | 11029 | 129 | 1.169644% |
Noise dominated data is calculated using 1-second bins in cleaned event files. If a bin has >2000 counts, and if more than 50% of those come from <1% of pixels, then it is considered to be noise-dominated and hence unusable.
| Quadrant | # 1 sec bins | Bins with >0 counts | Bins with >2000 counts | High rate bins dominated by noise | Noise dominated (total time) | Noise dominated (detector-on time) | Marked lightcurve |
|---|---|---|---|---|---|---|---|
| A | 14937 | 11880 | 2 | 2 | 0.01% | 0.02% | 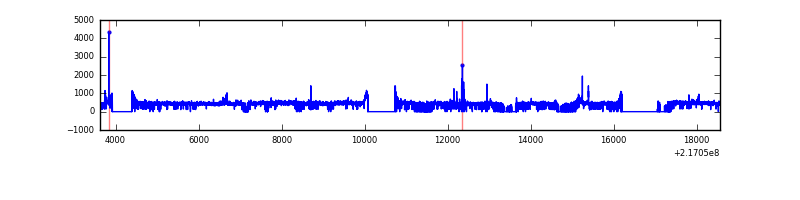 |
| B | 14937 | 11810 | 38 | 38 | 0.25% | 0.32% | 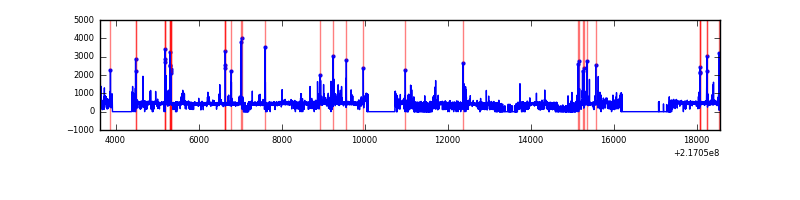 |
| C | 14937 | 11828 | 29 | 29 | 0.19% | 0.25% | 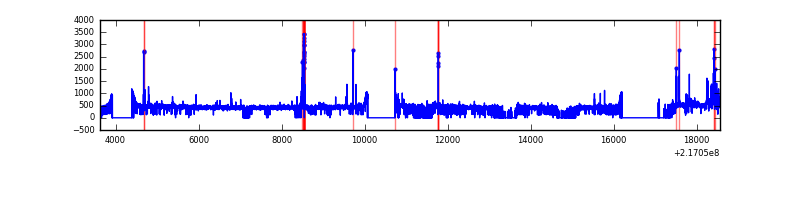 |
| D | 14937 | 11833 | 5 | 5 | 0.03% | 0.04% | 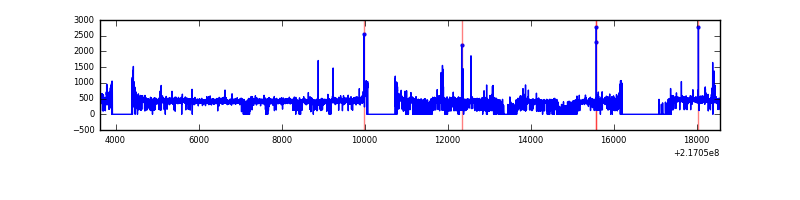 |
Top three noisy pixels from each quadrant. If the there are fewer than three noisy pixels in the level2.evt file, extra rows are filled as -1
| Pixel properties | Quadrant properties | ||||||
|---|---|---|---|---|---|---|---|
| Quadrant | DetID | PixID | Counts | Sigma | Mean | Median | Sigma |
| A | 8 | 15 | 168451 | 640.88 | 1276 | 1246 | 260.9 |
| A | 13 | 251 | 56737 | 212.69 | 1276 | 1246 | 260.9 |
| A | 15 | 174 | 21912 | 79.21 | 1276 | 1246 | 260.9 |
| B | 3 | 64 | 403051 | 1626.61 | 1277 | 1243 | 247.0 |
| B | 0 | 219 | 33826 | 131.9 | 1277 | 1243 | 247.0 |
| B | 15 | 204 | 31709 | 123.33 | 1277 | 1243 | 247.0 |
| C | 12 | 16 | 139995 | 478.85 | 1248 | 1256 | 289.7 |
| C | 1 | 16 | 106036 | 361.65 | 1248 | 1256 | 289.7 |
| C | 7 | 159 | 59733 | 201.83 | 1248 | 1256 | 289.7 |
| D | 5 | 97 | 49698 | 159.51 | 1245 | 1205 | 304.0 |
| D | 8 | 195 | 39235 | 125.09 | 1245 | 1205 | 304.0 |
| D | 14 | 173 | 32804 | 103.94 | 1245 | 1205 | 304.0 |
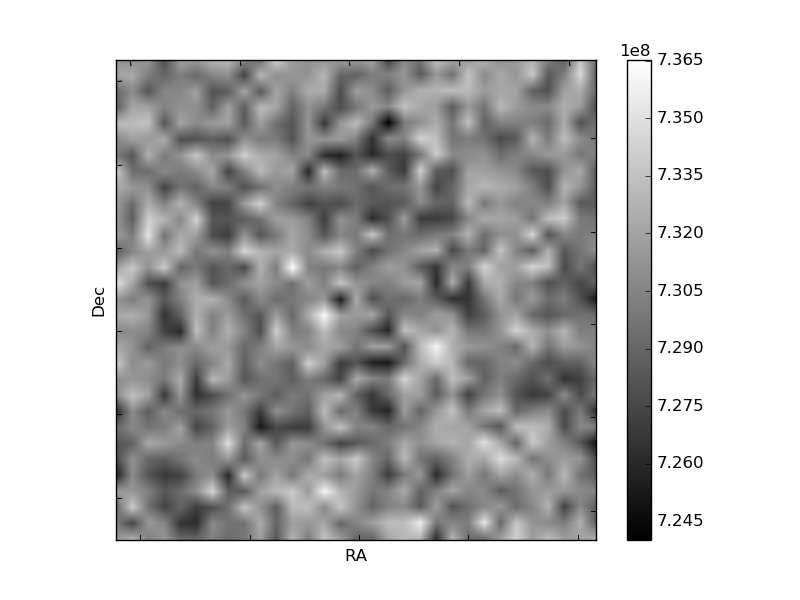
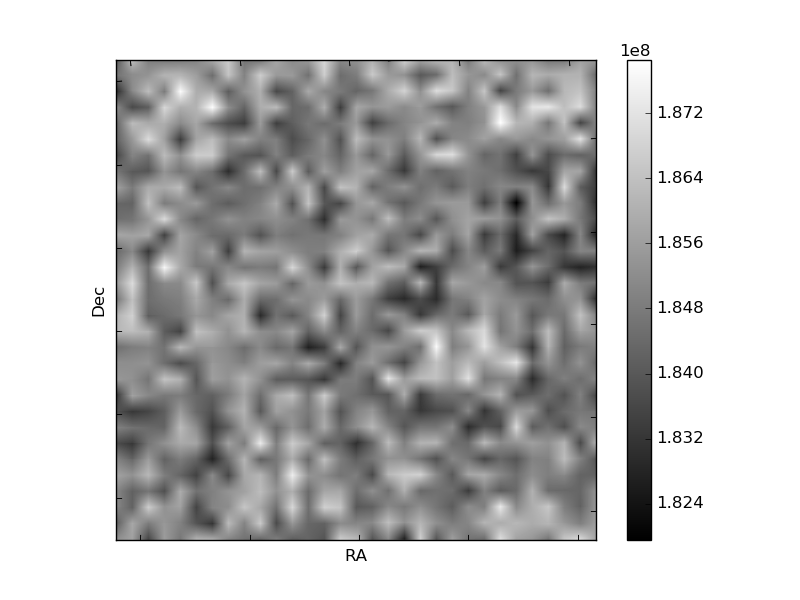
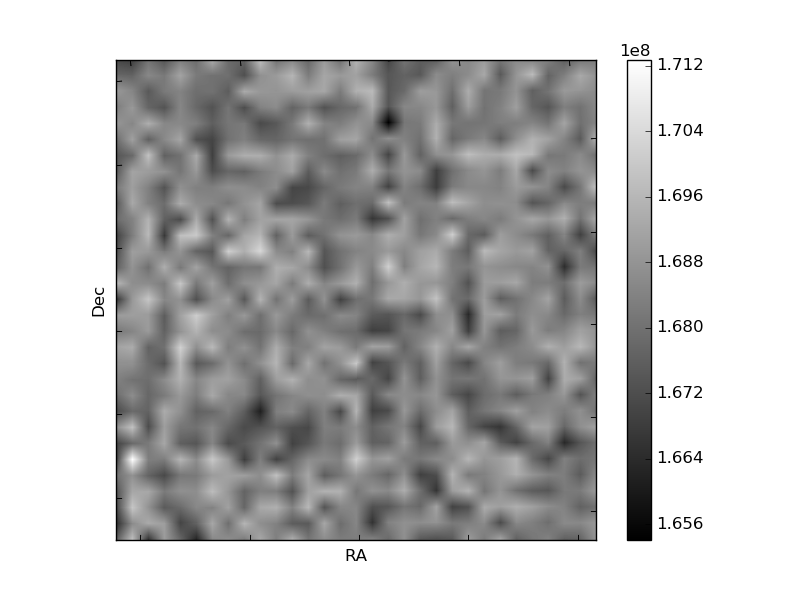
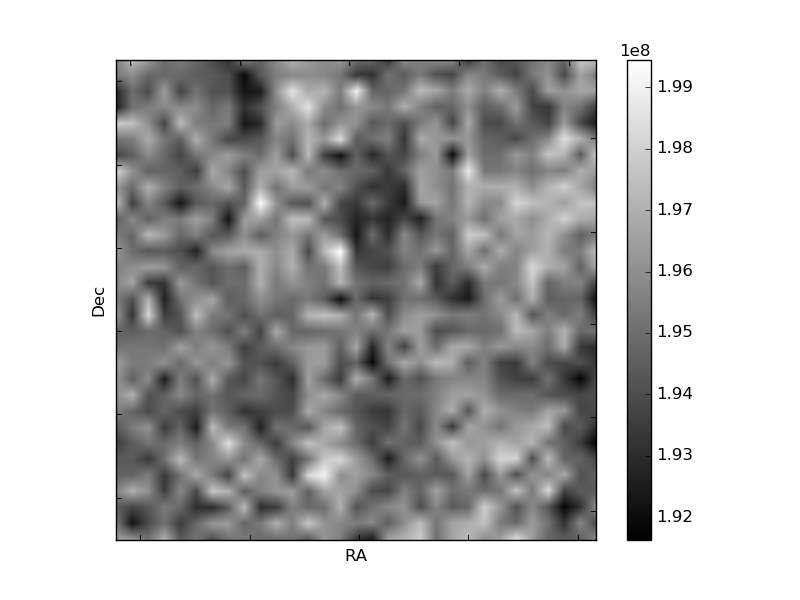
Histogram calculated using DETX and DETY for each event in the final _common_clean file
| Quadrant A | 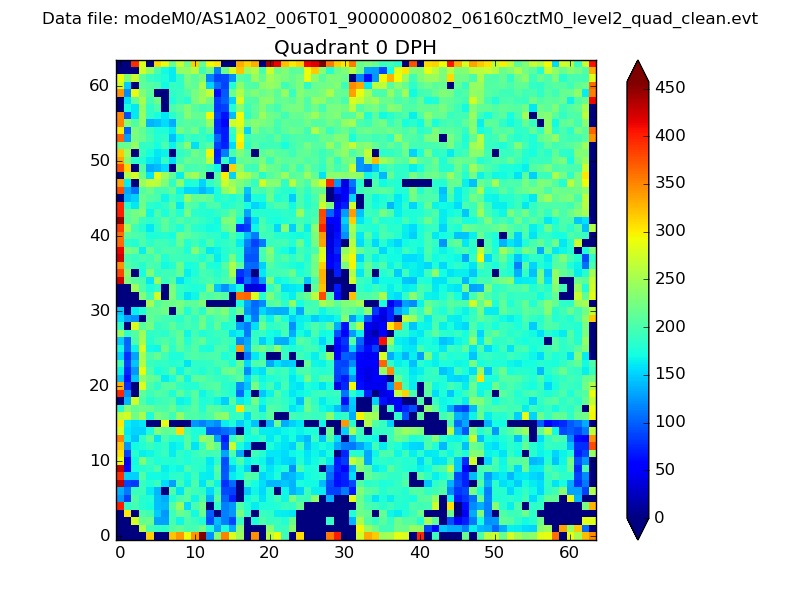 |
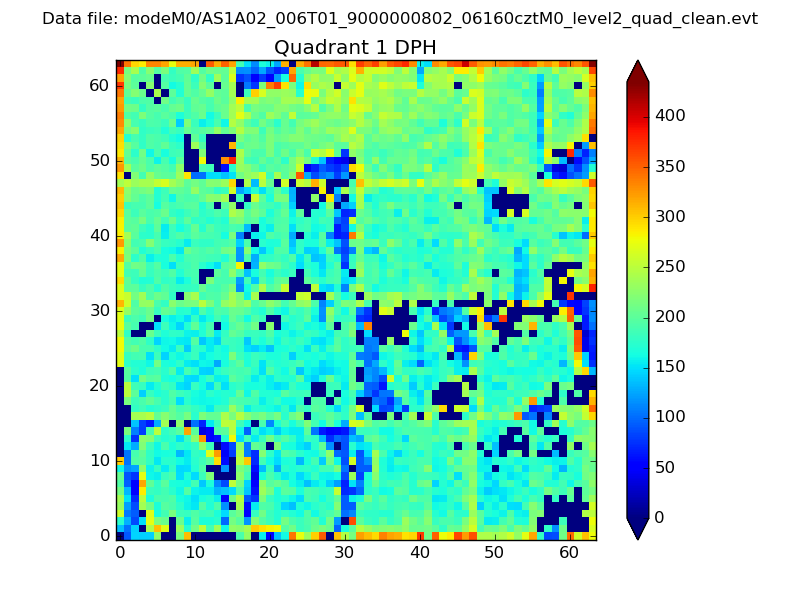 |
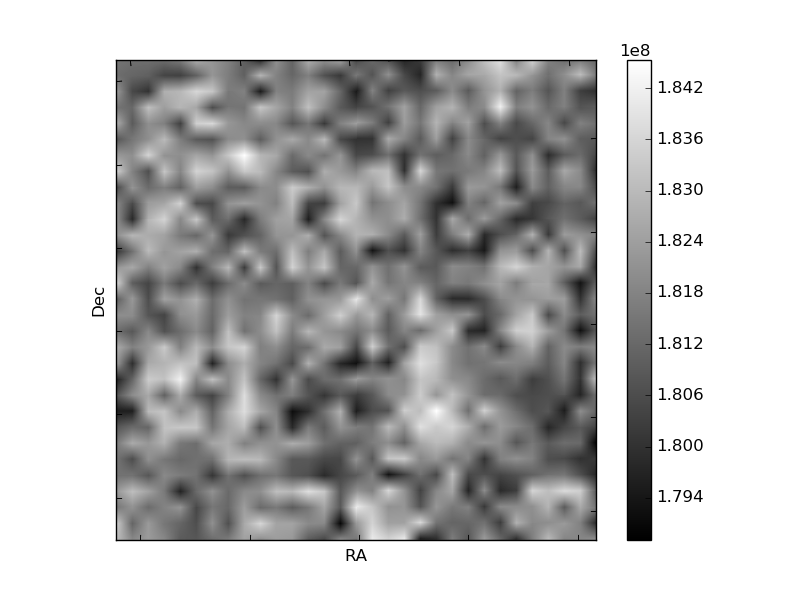
Quadrant B |
|---|---|---|---|
| Quadrant D | 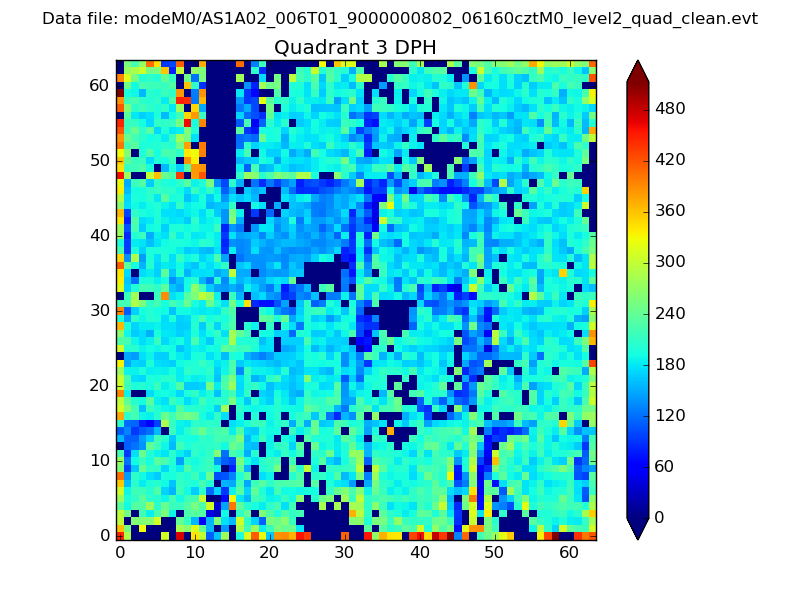 |
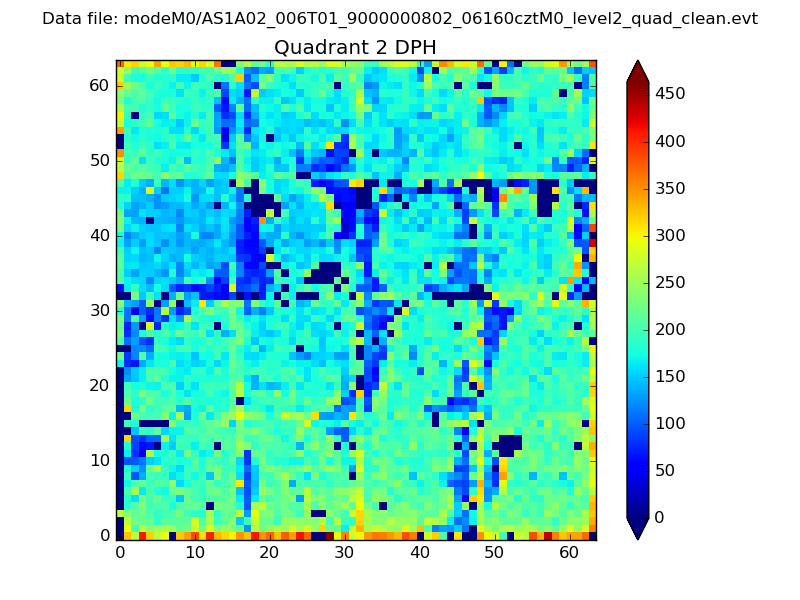 |
Quadrant C |
| Plot type | Count rate plots | Images |
|---|---|---|
| Comparison with Poisson distribution Blue bars denote a histogram of data divided into 1 sec bins. Red curve is a Poisson curve with rate = median count rate of data. |
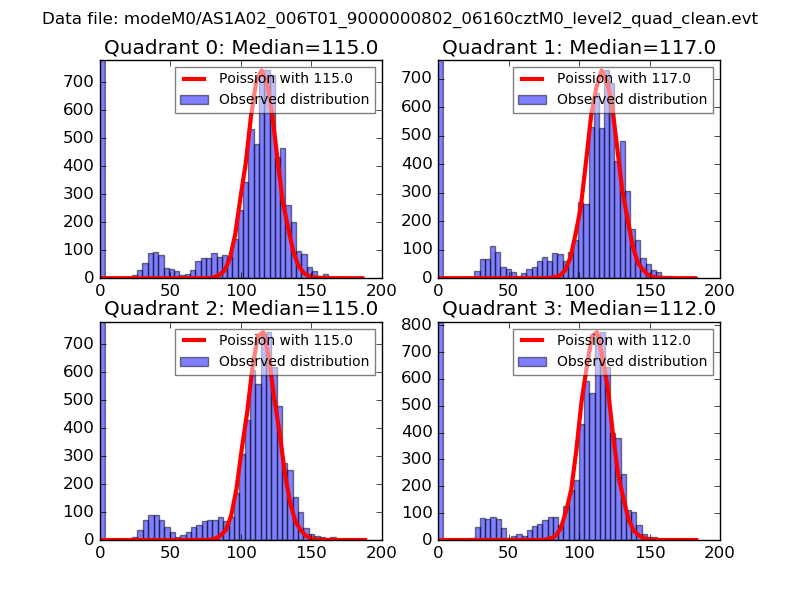 |
 |
| Quadrant-wise count rates Data is divided into 100 sec bins |
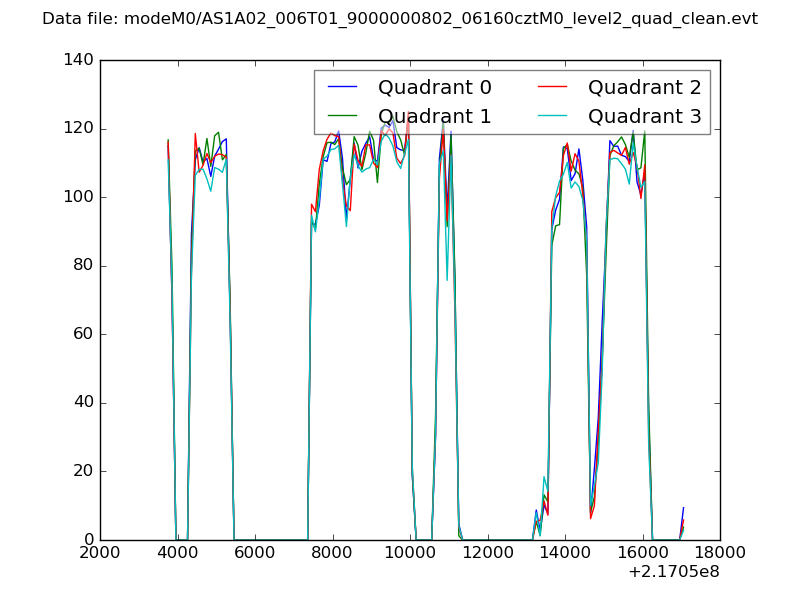 |
|
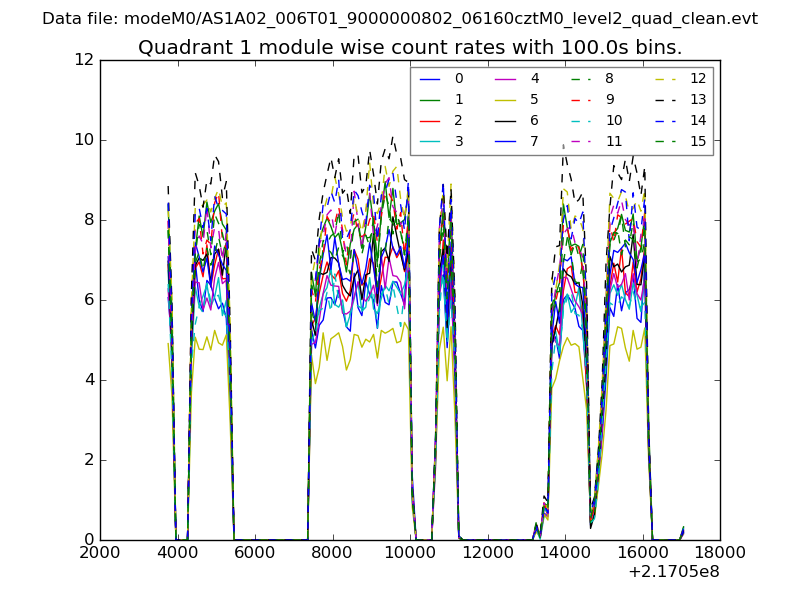
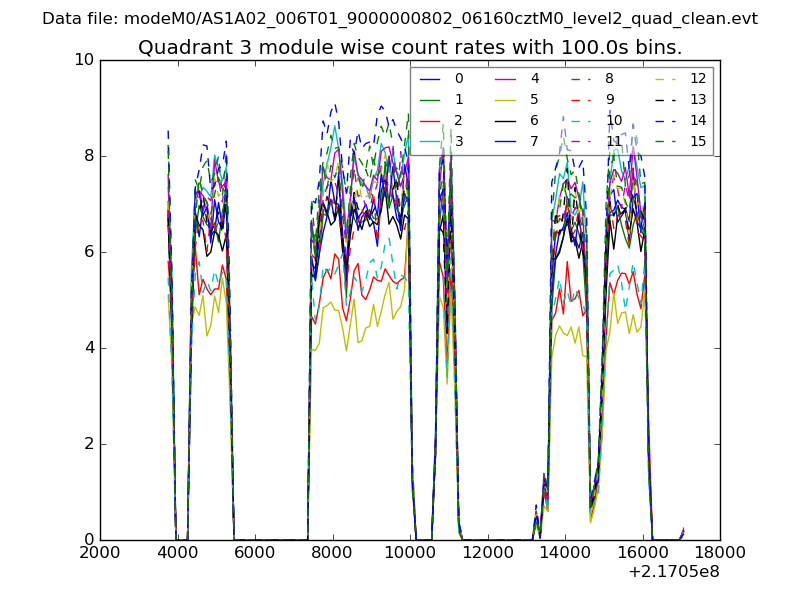
| Module-wise count rates for Quadrant A Data is divided into 100 sec bins |
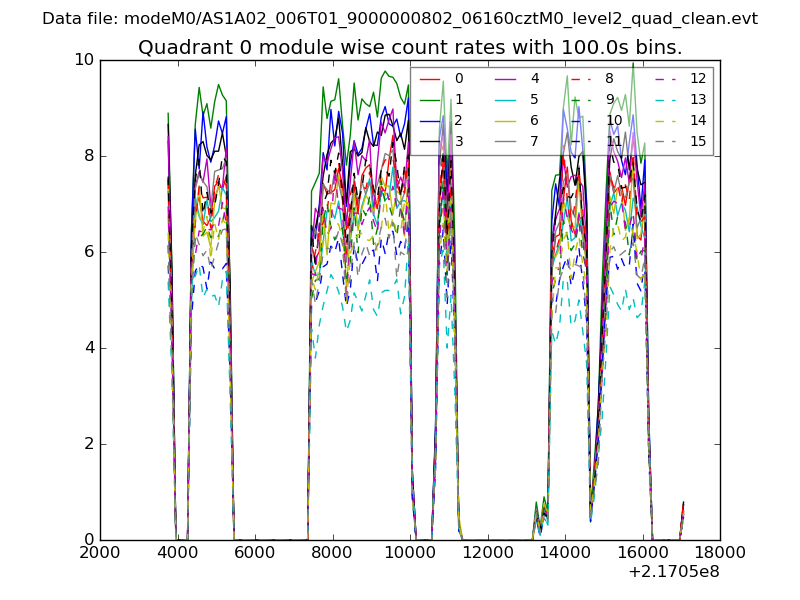 |
 |
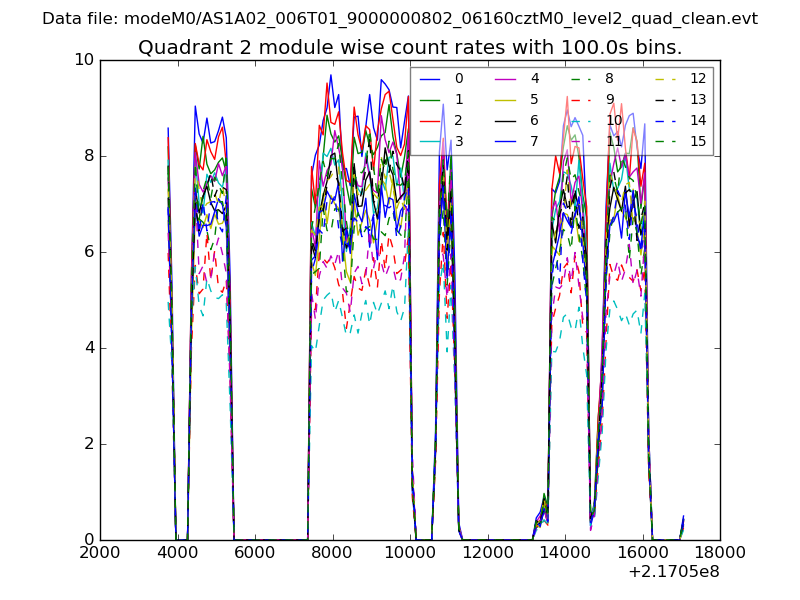
| Module-wise count rates for Quadrant B Data is divided into 100 sec bins |
 |
 |
| Module-wise count rates for Quadrant C Data is divided into 100 sec bins |
 |
 |
| Module-wise count rates for Quadrant D Data is divided into 100 sec bins |
 |
 |
| Parameter | Plot |
|---|---|
| CZT HV Monitor | 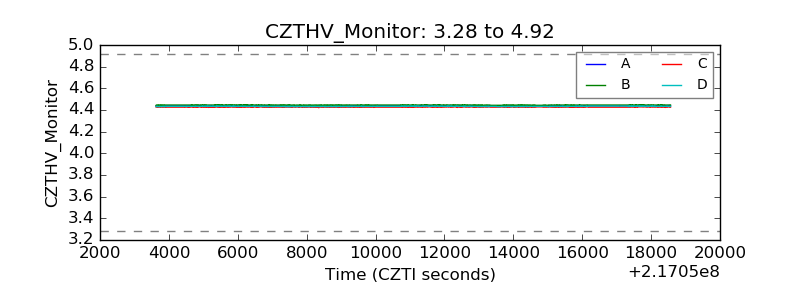 |
| D_VDD | 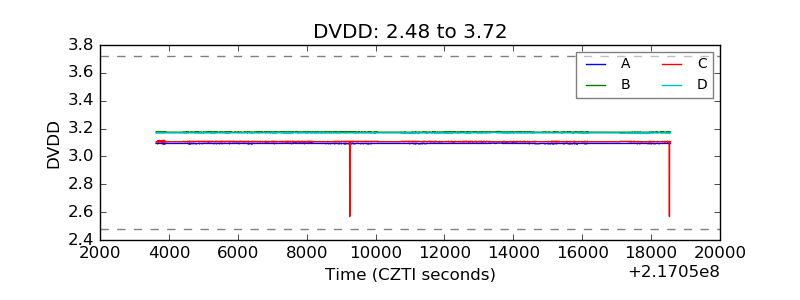 |
| Temperature 1 | 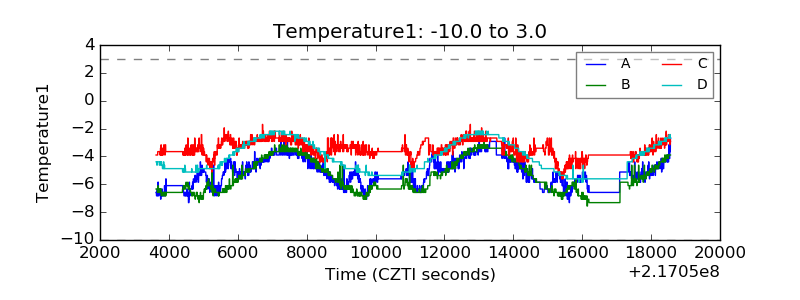 |
| Veto HV Monitor | 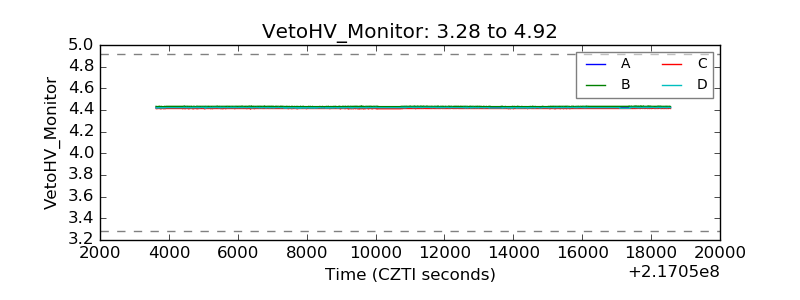 |
| Veto LLD | 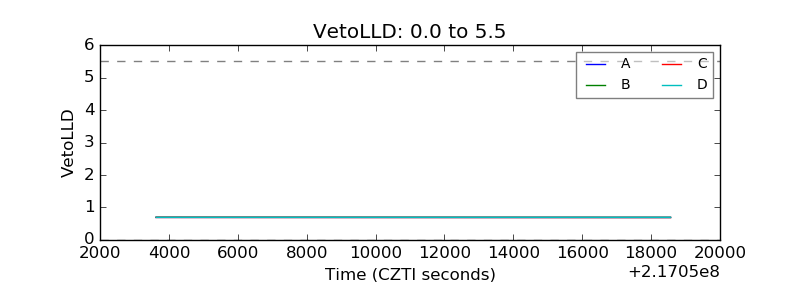 |
| Alpha Counter | 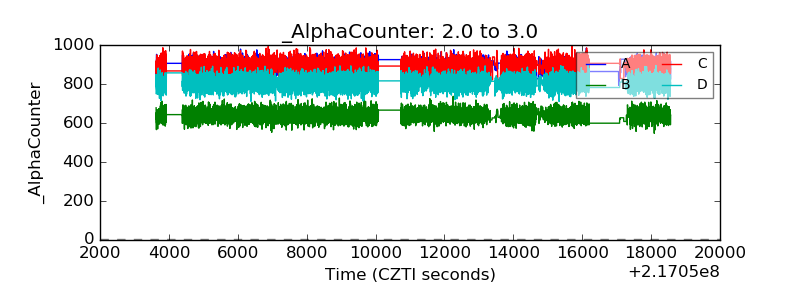 |
| _CPM_Rate | 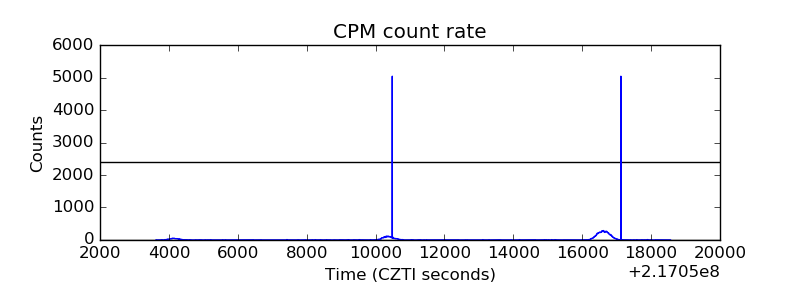 |
| CZT Counter | 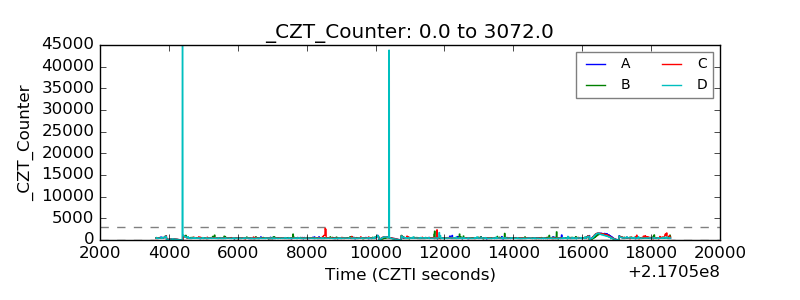 |
| +2.5 Volts monitor | 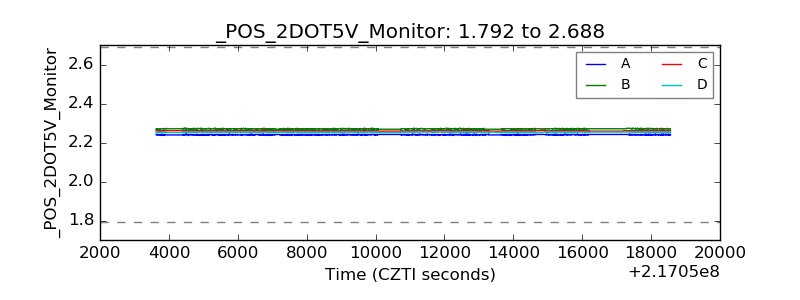 |
| +5 Volts monitor |  |
| _ROLL_ROT | 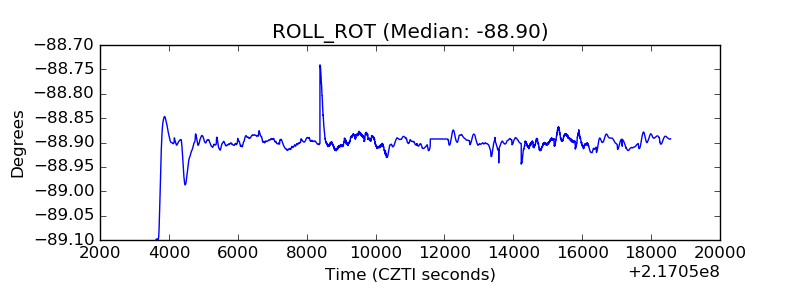 |
| _Roll_DEC | 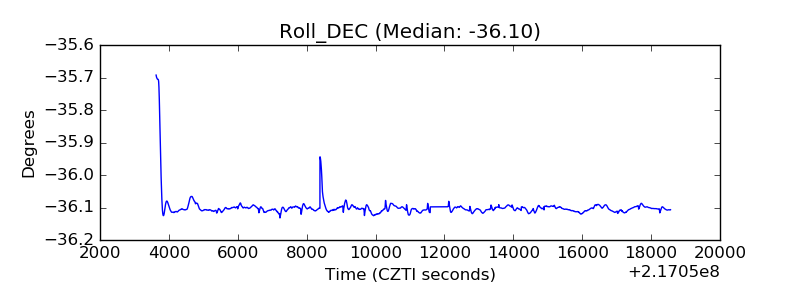 |
| _Roll_RA | 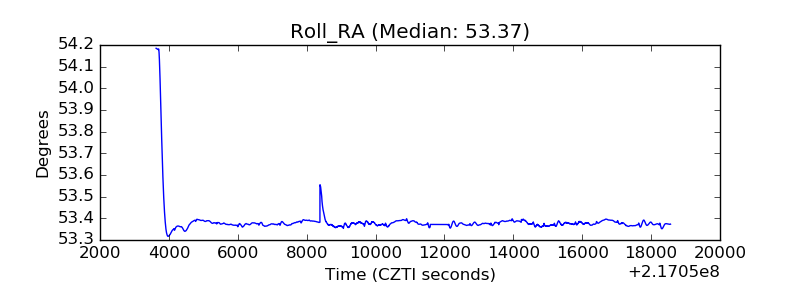 |
| Veto Counter | 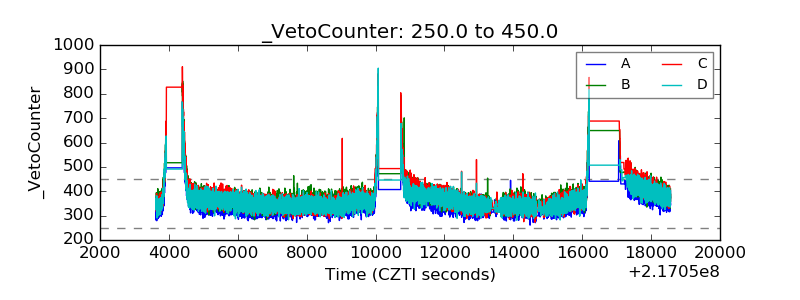 |