| Param | Original file | Final file |
|---|---|---|
| Filename | modeM0/AS1A02_006T01_9000000802_06161cztM0_level2.evt | modeM0/AS1A02_006T01_9000000802_06161cztM0_level2_quad_clean.evt |
| Size (bytes) | 445,979,520 | 63,907,200 |
| Size | 425.3 MB | 60.9 MB |
| Events in quadrant A | 3,089,918 | 372,126 |
| Events in quadrant B | 3,543,929 | 366,272 |
| Events in quadrant C | 3,266,358 | 376,715 |
| Events in quadrant D | 3,159,558 | 362,141 |
| Mode M0 | |||
|---|---|---|---|
| Quadrant | BADHDUFLAG | Total packets | Discarded packets |
| A | 0 | 14606 | 1013 |
| B | 0 | 15996 | 1302 |
| C | 0 | 15309 | 1044 |
| D | 0 | 14956 | 1025 |
| Mode SS | |||
|---|---|---|---|
| Quadrant | BADHDUFLAG | Total packets | Discarded packets |
| A | 0 | 146 | 6 |
| B | 0 | 145 | 13 |
| C | 0 | 146 | 16 |
| D | 0 | 145 | 13 |
| Mode M9 | |||
|---|---|---|---|
| Quadrant | BADHDUFLAG | Total packets | Discarded packets |
| A | 0 | 18 | 2 |
| B | 0 | 18 | 1 |
| C | 0 | 18 | 1 |
| D | 0 | 18 | 0 |
| Quadrant | Total seconds | Saturated seconds | Saturation percentage |
|---|---|---|---|
| A | 6559 | 94 | 1.433145% |
| B | 6519 | 174 | 2.669121% |
| C | 6588 | 86 | 1.305404% |
| D | 6573 | 84 | 1.277955% |
Noise dominated data is calculated using 1-second bins in cleaned event files. If a bin has >2000 counts, and if more than 50% of those come from <1% of pixels, then it is considered to be noise-dominated and hence unusable.
| Quadrant | # 1 sec bins | Bins with >0 counts | Bins with >2000 counts | High rate bins dominated by noise | Noise dominated (total time) | Noise dominated (detector-on time) | Marked lightcurve |
|---|---|---|---|---|---|---|---|
| A | 8901 | 6859 | 0 | 0 | 0.00% | 0.00% | 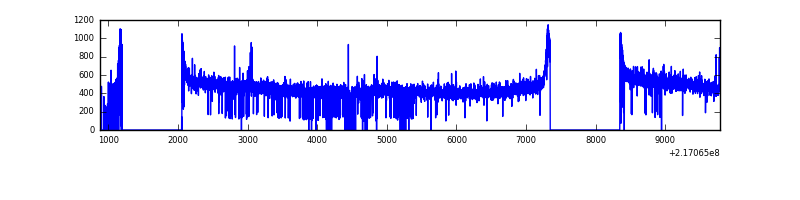 |
| B | 8900 | 6856 | 53 | 53 | 0.60% | 0.77% | 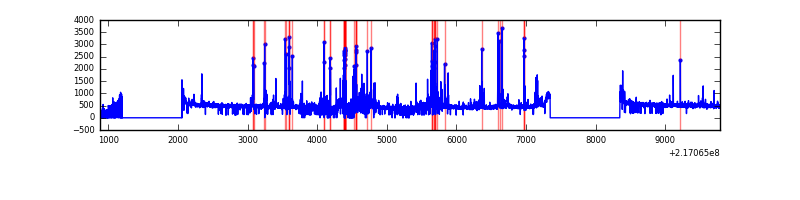 |
| C | 8897 | 6896 | 6 | 6 | 0.07% | 0.09% | 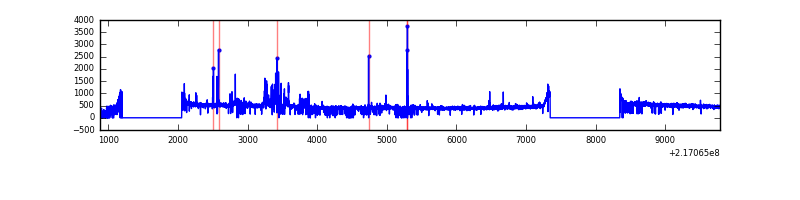 |
| D | 8901 | 6866 | 5 | 5 | 0.06% | 0.07% | 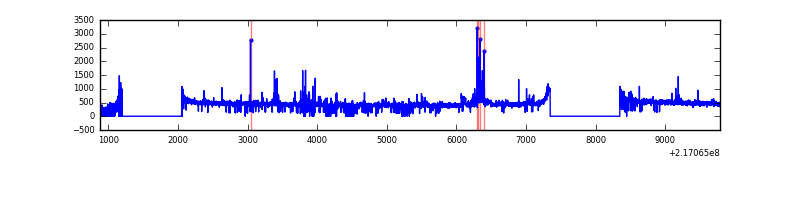 |
Top three noisy pixels from each quadrant. If the there are fewer than three noisy pixels in the level2.evt file, extra rows are filled as -1
| Pixel properties | Quadrant properties | ||||||
|---|---|---|---|---|---|---|---|
| Quadrant | DetID | PixID | Counts | Sigma | Mean | Median | Sigma |
| A | 8 | 15 | 79066 | 486.8 | 782 | 764 | 160.8 |
| A | 0 | 226 | 7612 | 42.57 | 782 | 764 | 160.8 |
| A | 12 | 194 | 7477 | 41.73 | 782 | 764 | 160.8 |
| B | 3 | 64 | 355193 | 2359.26 | 780 | 760 | 150.2 |
| B | 0 | 219 | 119969 | 793.51 | 780 | 760 | 150.2 |
| B | 4 | 80 | 24041 | 154.97 | 780 | 760 | 150.2 |
| C | 12 | 16 | 172793 | 956.19 | 774 | 774 | 179.9 |
| C | 1 | 16 | 39305 | 214.18 | 774 | 774 | 179.9 |
| C | 9 | 16 | 17158 | 91.07 | 774 | 774 | 179.9 |
| D | 12 | 110 | 94692 | 498.24 | 770 | 745 | 188.6 |
| D | 5 | 97 | 71958 | 377.67 | 770 | 745 | 188.6 |
| D | 8 | 195 | 30548 | 158.06 | 770 | 745 | 188.6 |
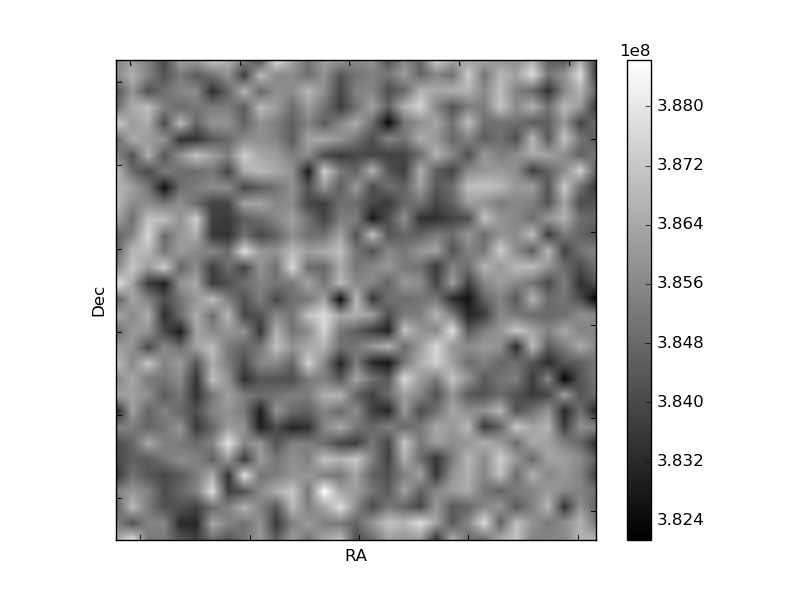
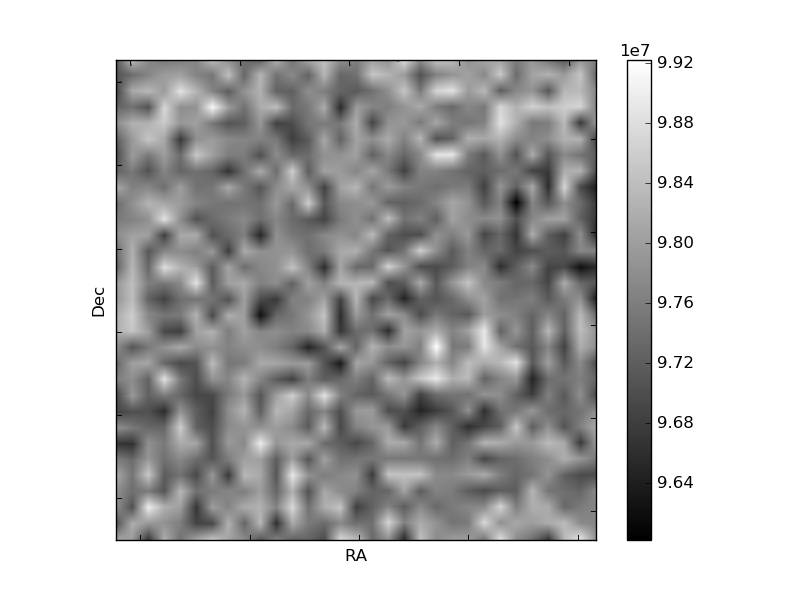
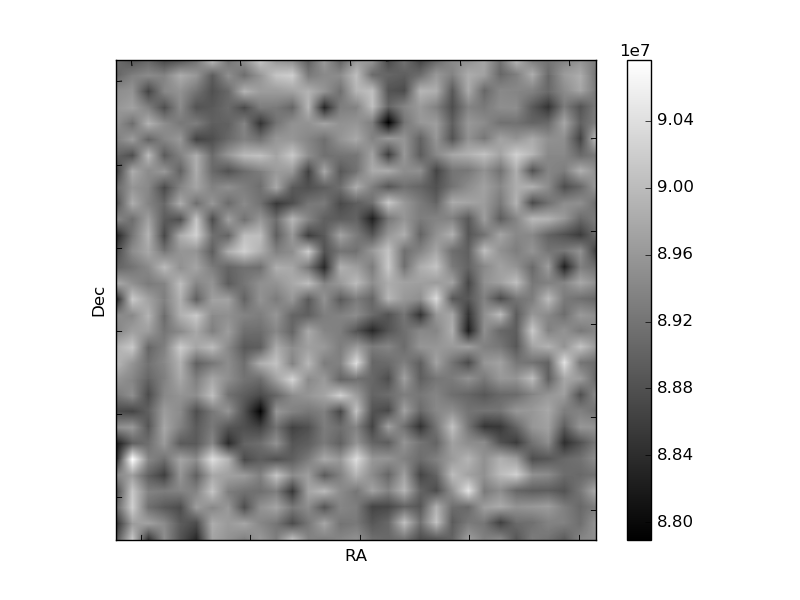
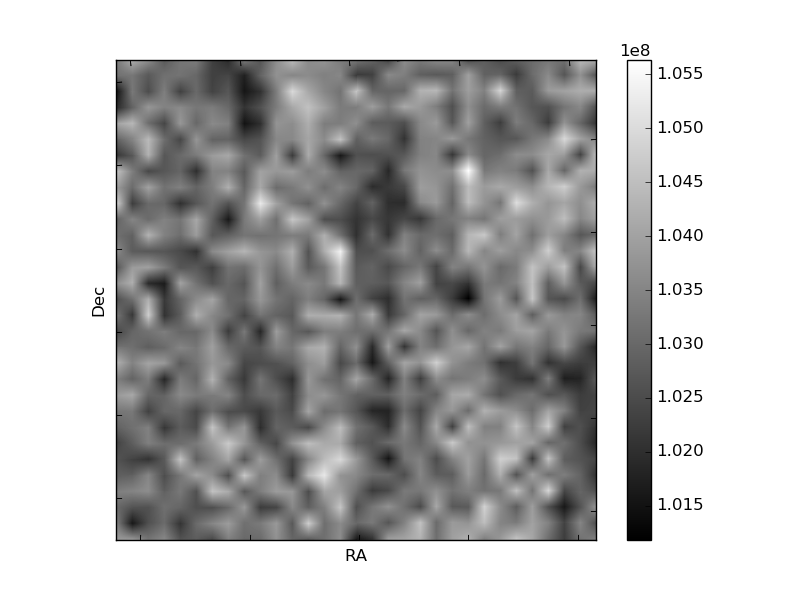
Histogram calculated using DETX and DETY for each event in the final _common_clean file
| Quadrant A | 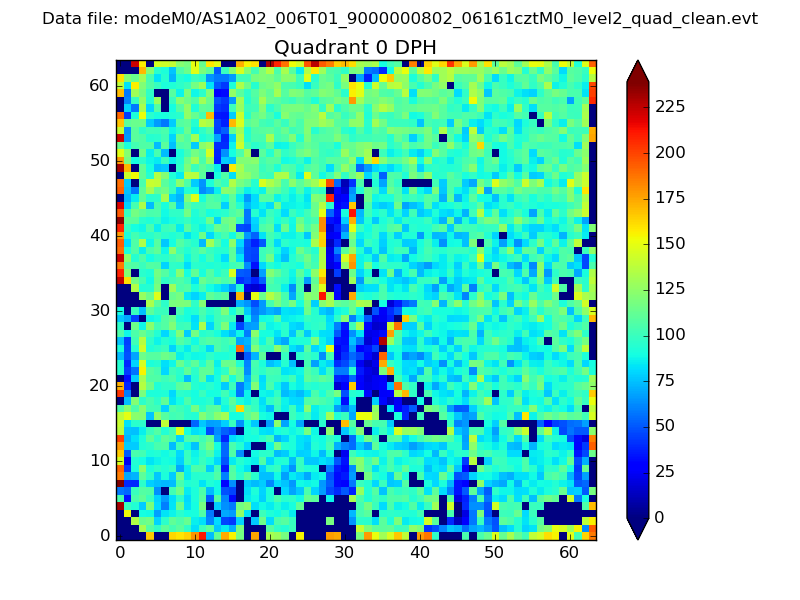 |
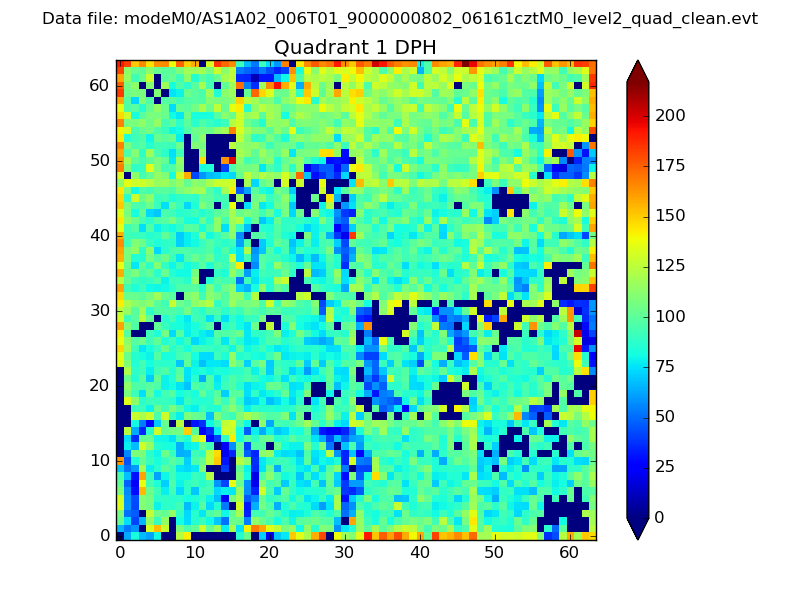 |
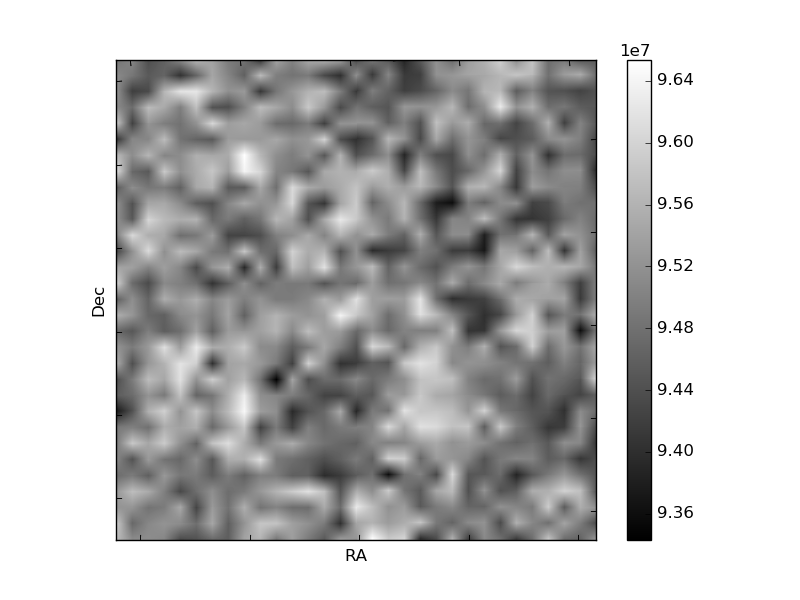
Quadrant B |
|---|---|---|---|
| Quadrant D | 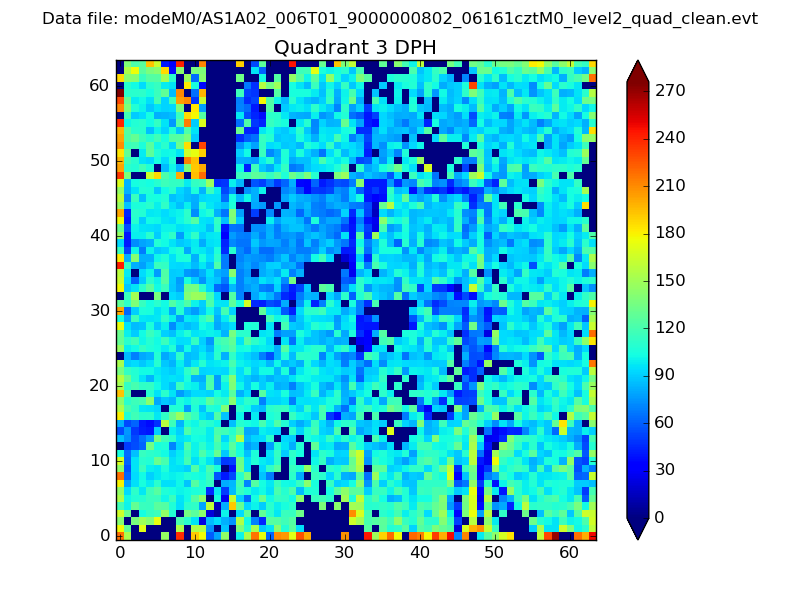 |
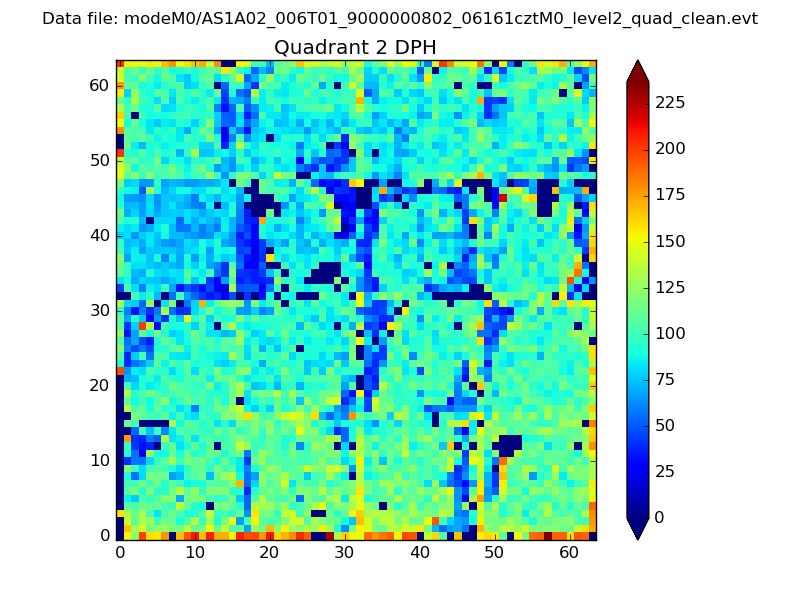 |
Quadrant C |
| Plot type | Count rate plots | Images |
|---|---|---|
| Comparison with Poisson distribution Blue bars denote a histogram of data divided into 1 sec bins. Red curve is a Poisson curve with rate = median count rate of data. |
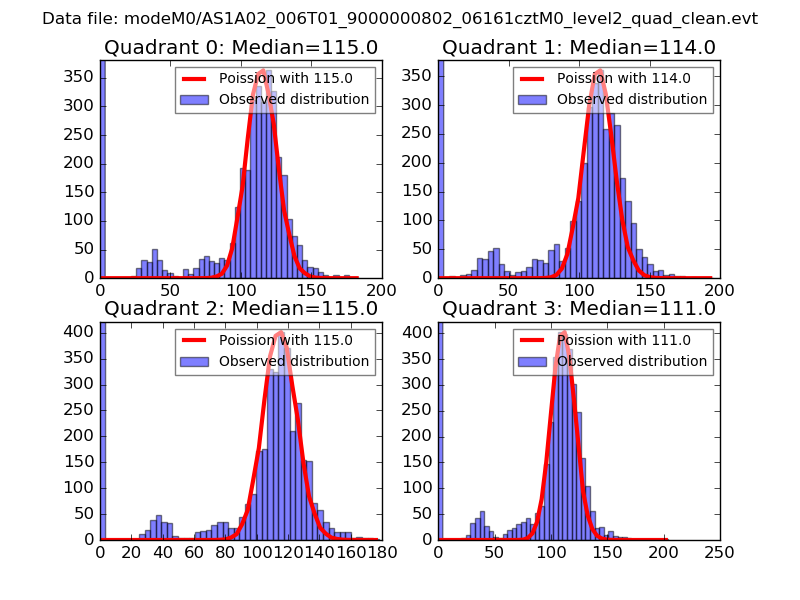 |
 |
| Quadrant-wise count rates Data is divided into 100 sec bins |
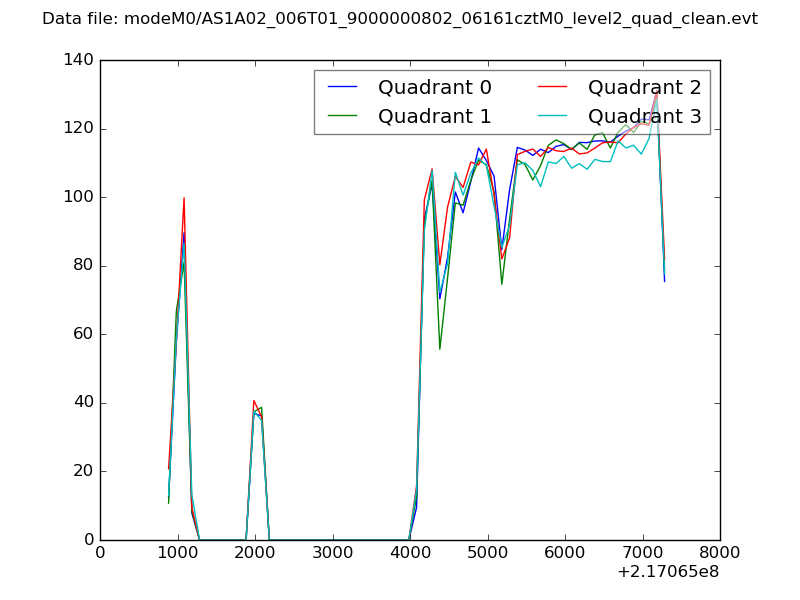 |
|
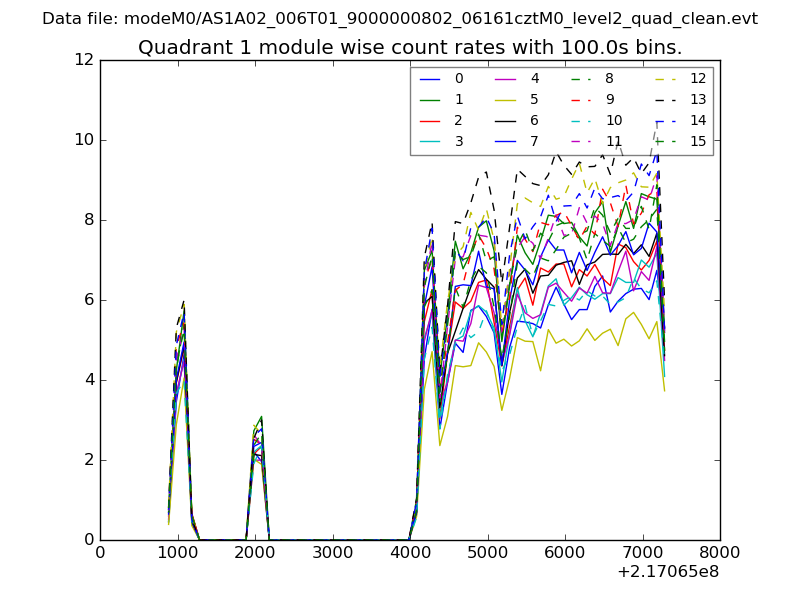
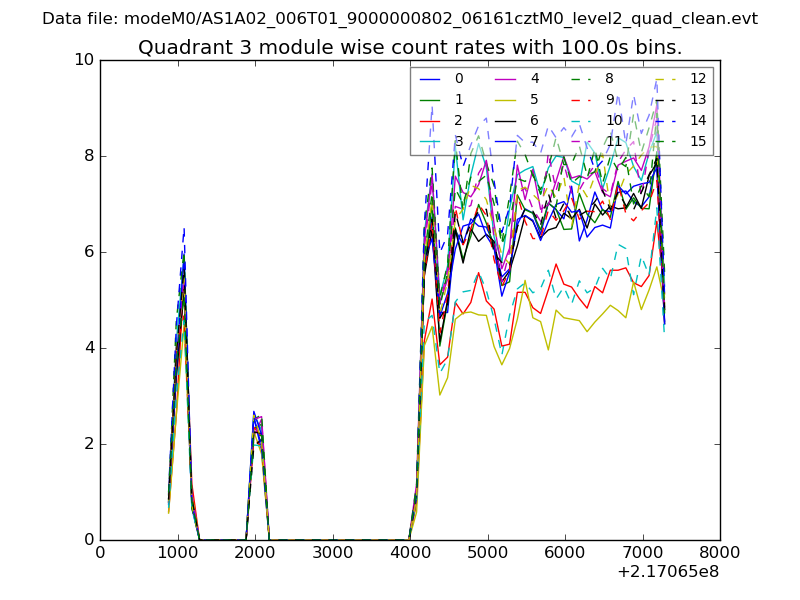
| Module-wise count rates for Quadrant A Data is divided into 100 sec bins |
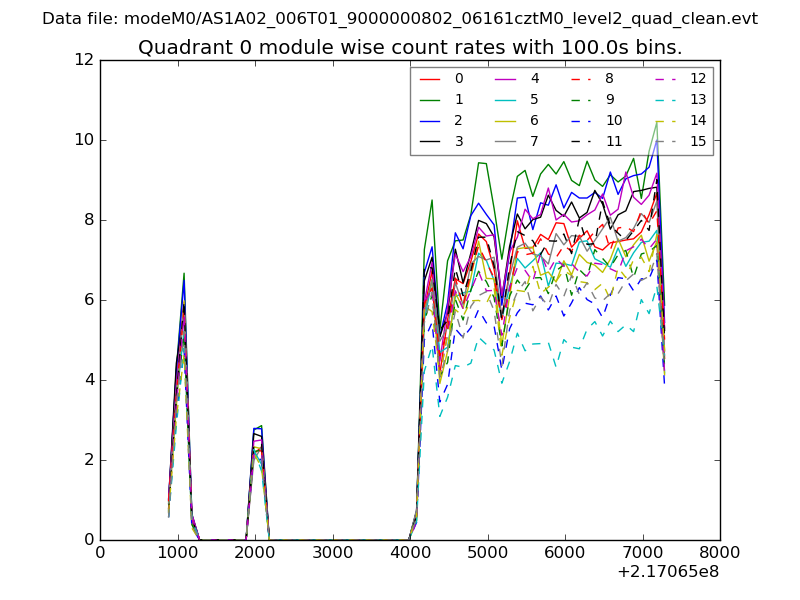 |
 |
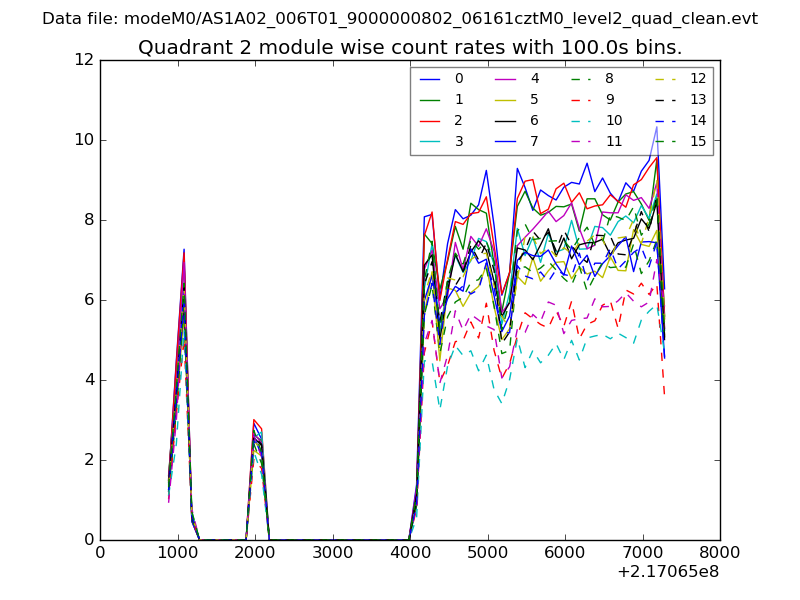
| Module-wise count rates for Quadrant B Data is divided into 100 sec bins |
 |
 |
| Module-wise count rates for Quadrant C Data is divided into 100 sec bins |
 |
 |
| Module-wise count rates for Quadrant D Data is divided into 100 sec bins |
 |
 |
| Parameter | Plot |
|---|---|
| CZT HV Monitor | 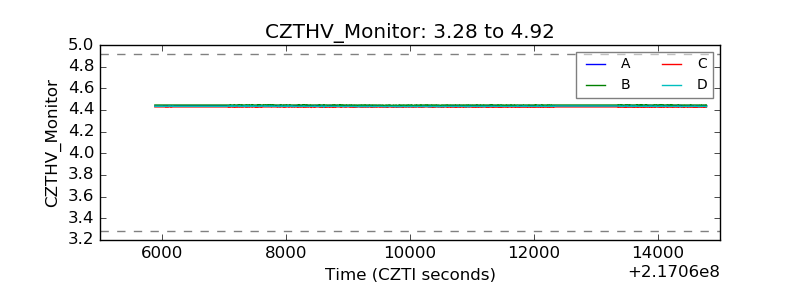 |
| D_VDD | 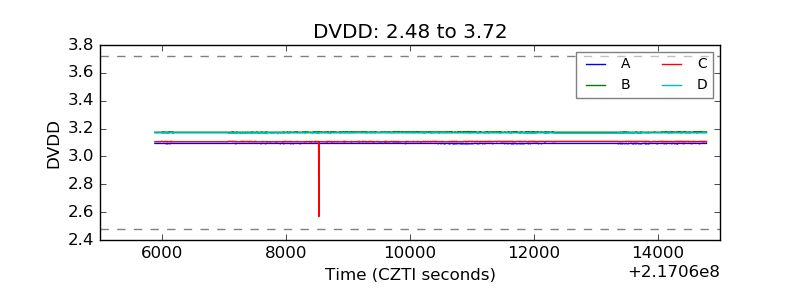 |
| Temperature 1 | 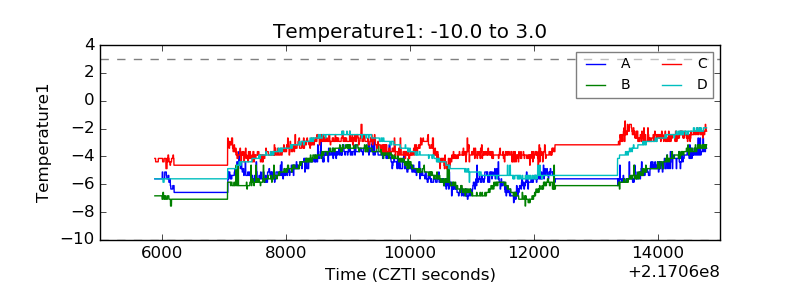 |
| Veto HV Monitor | 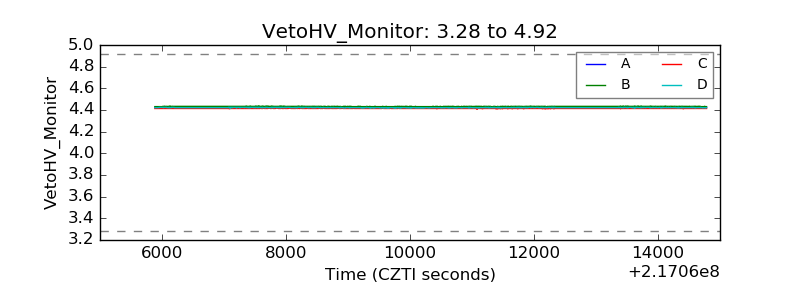 |
| Veto LLD | 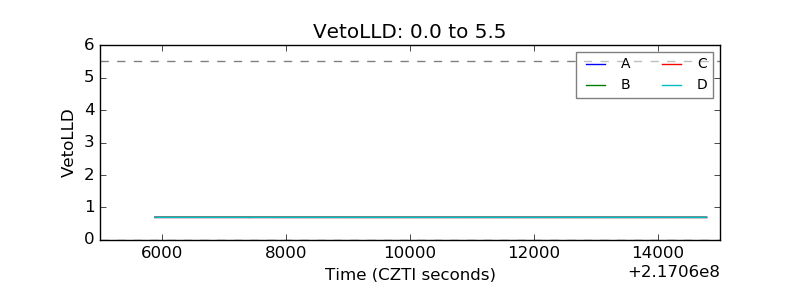 |
| Alpha Counter | 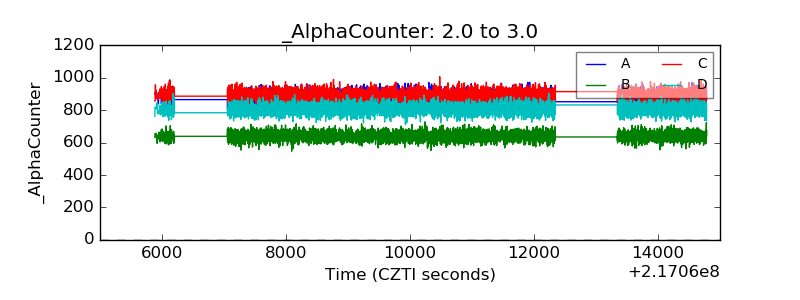 |
| _CPM_Rate | 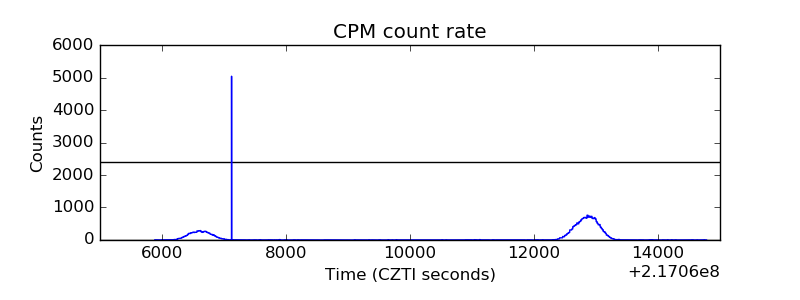 |
| CZT Counter | 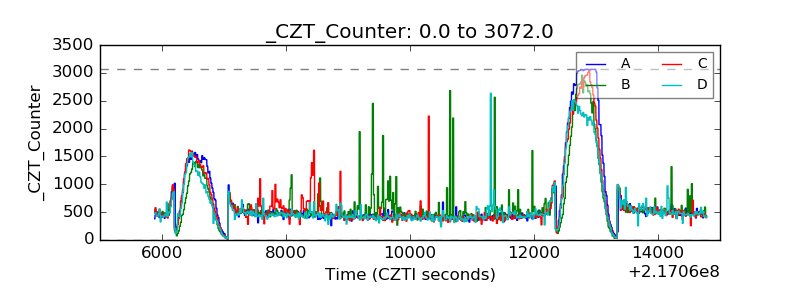 |
| +2.5 Volts monitor |  |
| +5 Volts monitor | 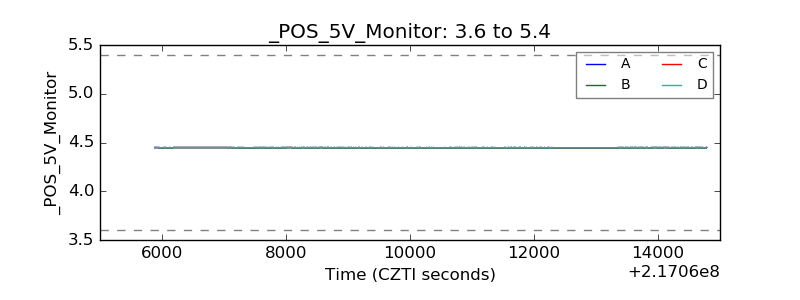 |
| _ROLL_ROT | 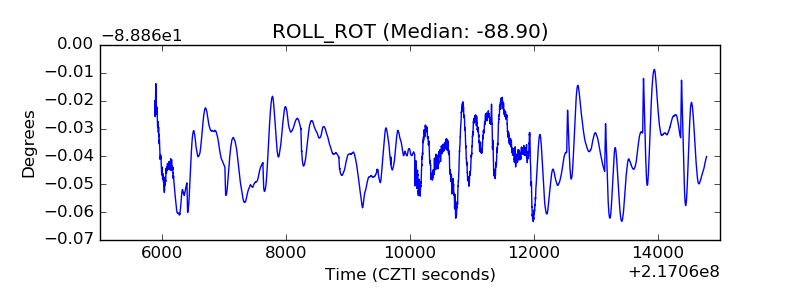 |
| _Roll_DEC | 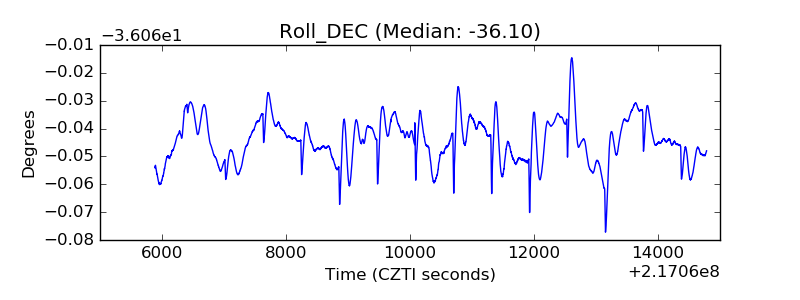 |
| _Roll_RA | 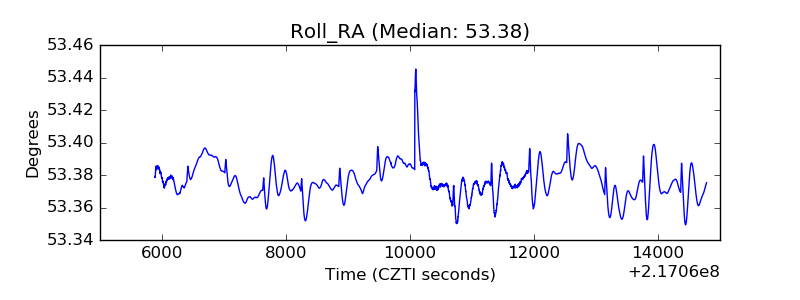 |
| Veto Counter | 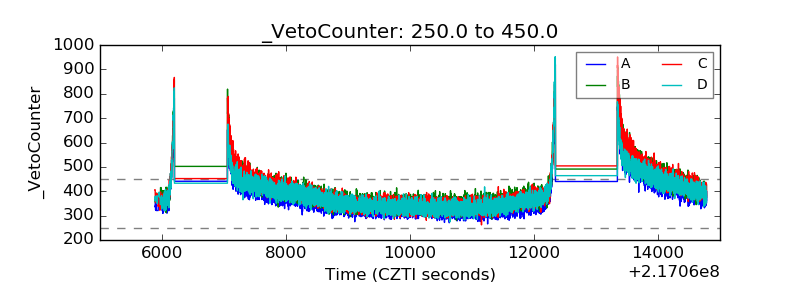 |