| Param | Original file | Final file |
|---|---|---|
| Filename | modeM0/AS1A02_006T01_9000000802_06163cztM0_level2.evt | modeM0/AS1A02_006T01_9000000802_06163cztM0_level2_quad_clean.evt |
| Size (bytes) | 493,418,880 | 83,615,040 |
| Size | 470.6 MB | 79.7 MB |
| Events in quadrant A | 3,496,100 | 512,412 |
| Events in quadrant B | 4,092,615 | 512,327 |
| Events in quadrant C | 3,381,890 | 511,581 |
| Events in quadrant D | 3,485,226 | 496,189 |
| Mode M0 | |||
|---|---|---|---|
| Quadrant | BADHDUFLAG | Total packets | Discarded packets |
| A | 0 | 15120 | 15 |
| B | 0 | 16856 | 19 |
| C | 0 | 15032 | 18 |
| D | 0 | 15356 | 22 |
| Mode SS | |||
|---|---|---|---|
| Quadrant | BADHDUFLAG | Total packets | Discarded packets |
| A | 0 | 148 | 0 |
| B | 0 | 148 | 0 |
| C | 0 | 148 | 0 |
| D | 0 | 148 | 0 |
| Mode M9 | |||
|---|---|---|---|
| Quadrant | BADHDUFLAG | Total packets | Discarded packets |
| A | 0 | 21 | 0 |
| B | 0 | 21 | 0 |
| C | 0 | 21 | 0 |
| D | 0 | 21 | 0 |
| Quadrant | Total seconds | Saturated seconds | Saturation percentage |
|---|---|---|---|
| A | 7171 | 127 | 1.771022% |
| B | 7169 | 244 | 3.403543% |
| C | 7169 | 115 | 1.604129% |
| D | 7166 | 120 | 1.674574% |
Noise dominated data is calculated using 1-second bins in cleaned event files. If a bin has >2000 counts, and if more than 50% of those come from <1% of pixels, then it is considered to be noise-dominated and hence unusable.
| Quadrant | # 1 sec bins | Bins with >0 counts | Bins with >2000 counts | High rate bins dominated by noise | Noise dominated (total time) | Noise dominated (detector-on time) | Marked lightcurve |
|---|---|---|---|---|---|---|---|
| A | 9306 | 7175 | 0 | 0 | 0.00% | 0.00% | 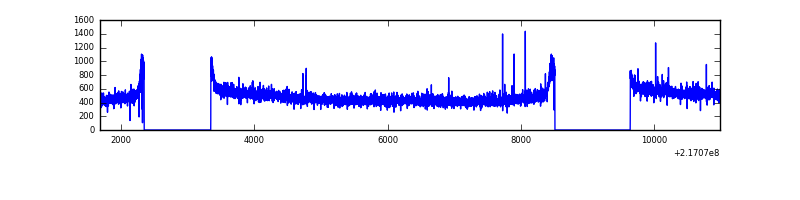 |
| B | 9306 | 7175 | 73 | 73 | 0.78% | 1.02% | 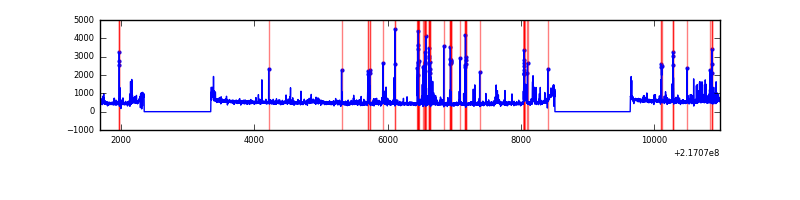 |
| C | 9306 | 7174 | 0 | 0 | 0.00% | 0.00% | 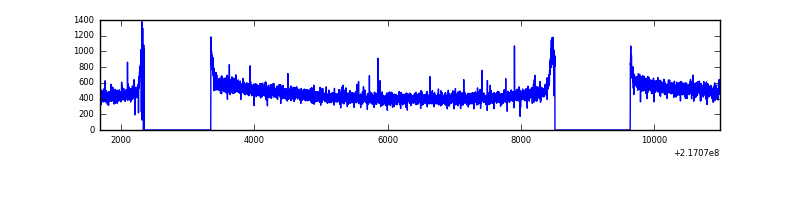 |
| D | 9306 | 7175 | 5 | 5 | 0.05% | 0.07% | 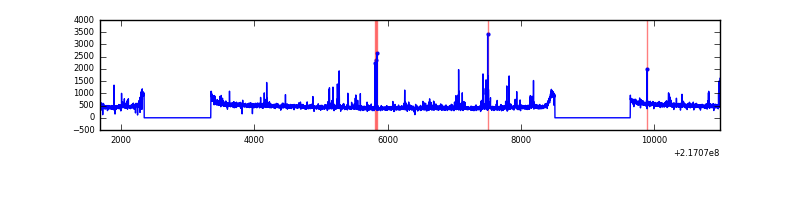 |
Top three noisy pixels from each quadrant. If the there are fewer than three noisy pixels in the level2.evt file, extra rows are filled as -1
| Pixel properties | Quadrant properties | ||||||
|---|---|---|---|---|---|---|---|
| Quadrant | DetID | PixID | Counts | Sigma | Mean | Median | Sigma |
| A | 8 | 15 | 112859 | 626.25 | 878 | 861 | 178.8 |
| A | 0 | 226 | 8485 | 42.63 | 878 | 861 | 178.8 |
| A | 12 | 194 | 8457 | 42.47 | 878 | 861 | 178.8 |
| B | 3 | 64 | 386606 | 2317.85 | 877 | 858 | 166.4 |
| B | 0 | 219 | 223572 | 1338.22 | 877 | 858 | 166.4 |
| B | 4 | 81 | 45202 | 266.45 | 877 | 858 | 166.4 |
| C | 1 | 16 | 20845 | 101.33 | 859 | 864 | 197.2 |
| C | 13 | 61 | 6649 | 29.34 | 859 | 864 | 197.2 |
| C | 12 | 16 | 5409 | 23.05 | 859 | 864 | 197.2 |
| D | 13 | 105 | 76289 | 358.43 | 858 | 832 | 210.5 |
| D | 13 | 169 | 57354 | 268.48 | 858 | 832 | 210.5 |
| D | 5 | 97 | 40088 | 186.47 | 858 | 832 | 210.5 |
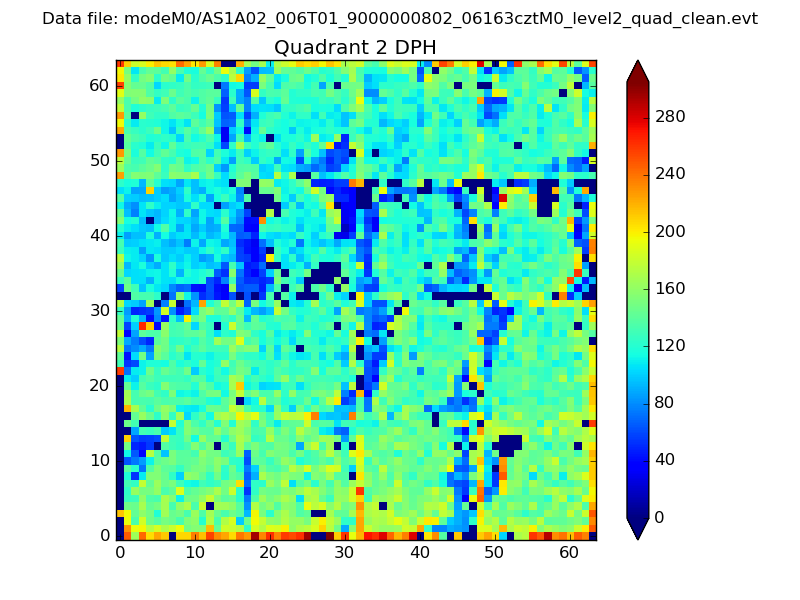
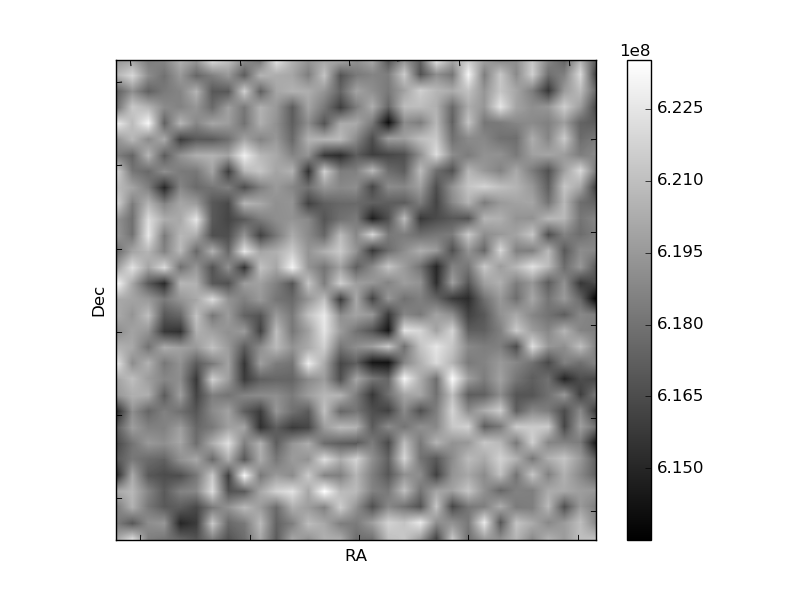
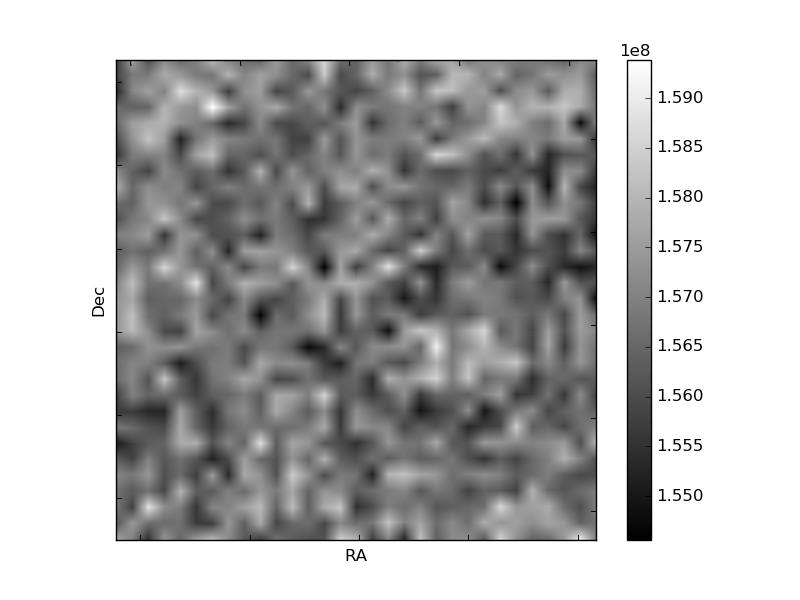
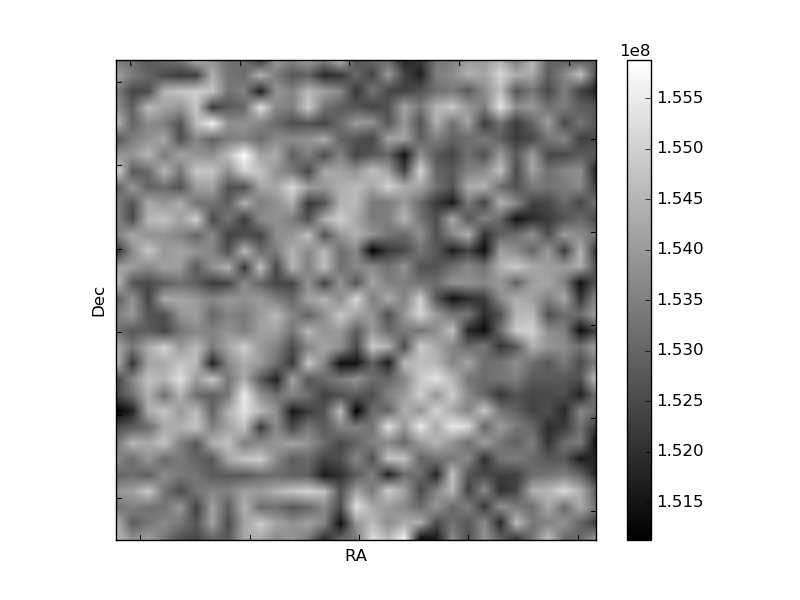
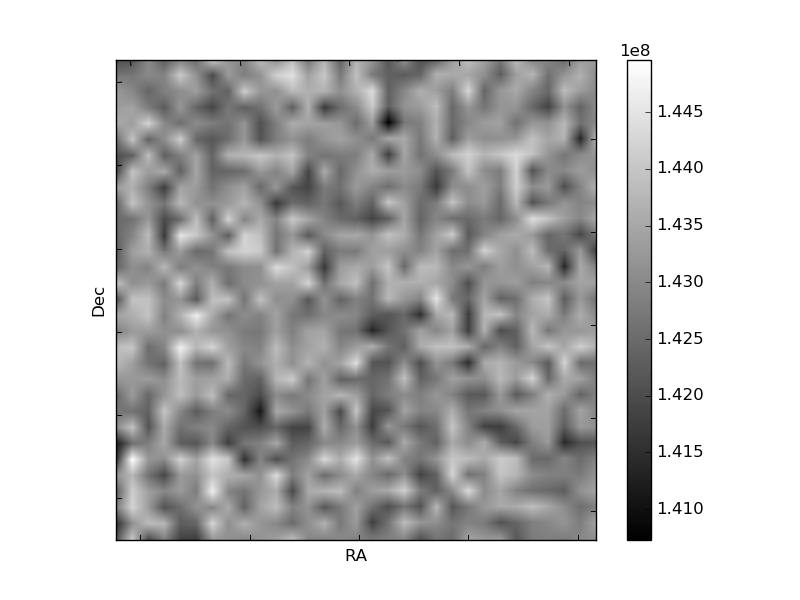
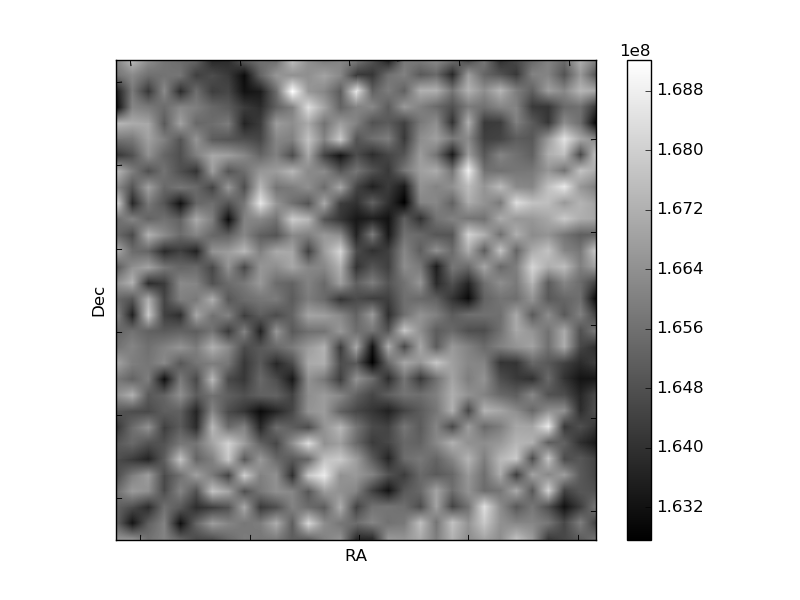
Histogram calculated using DETX and DETY for each event in the final _common_clean file
| Quadrant A | 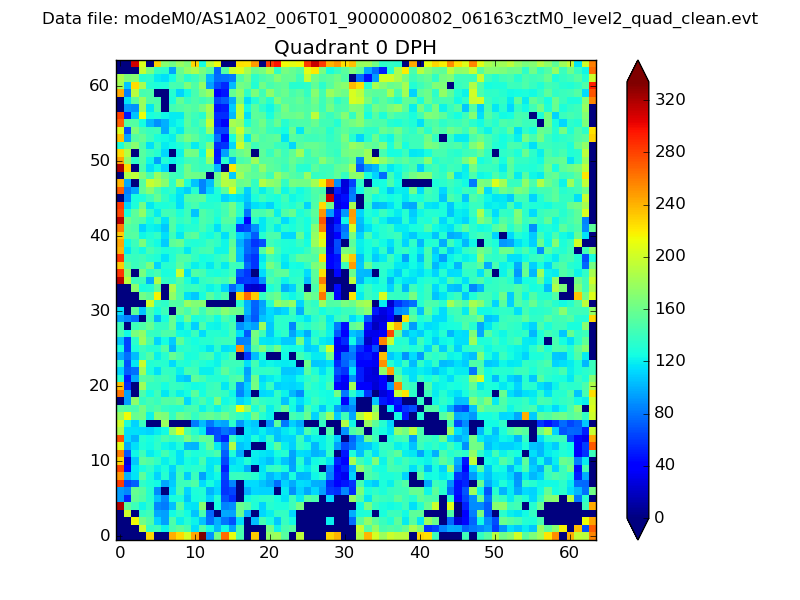 |
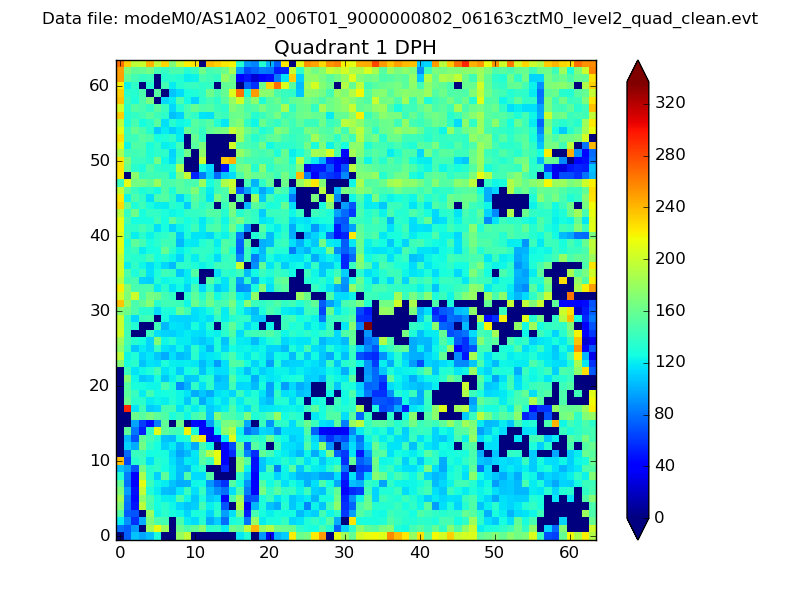 |
Quadrant B |
|---|---|---|---|
| Quadrant D | 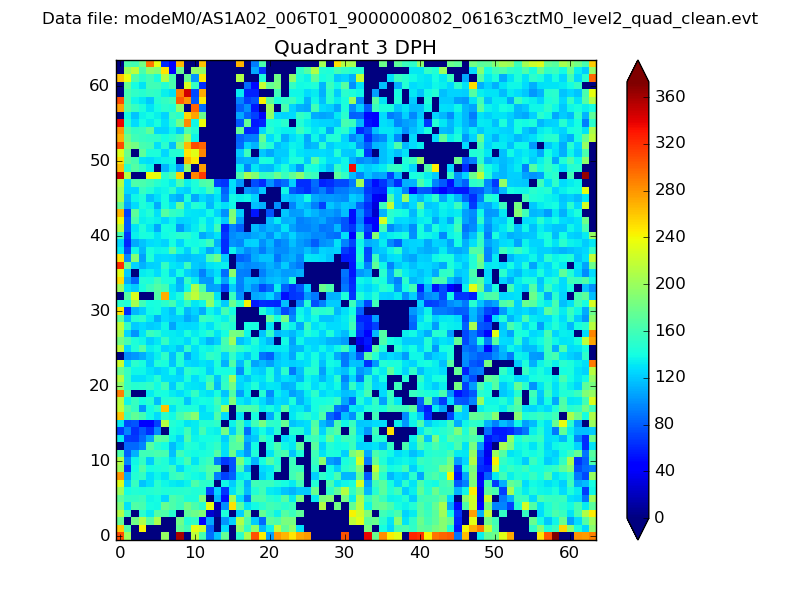 |
 |
Quadrant C |
| Plot type | Count rate plots | Images |
|---|---|---|
| Comparison with Poisson distribution Blue bars denote a histogram of data divided into 1 sec bins. Red curve is a Poisson curve with rate = median count rate of data. |
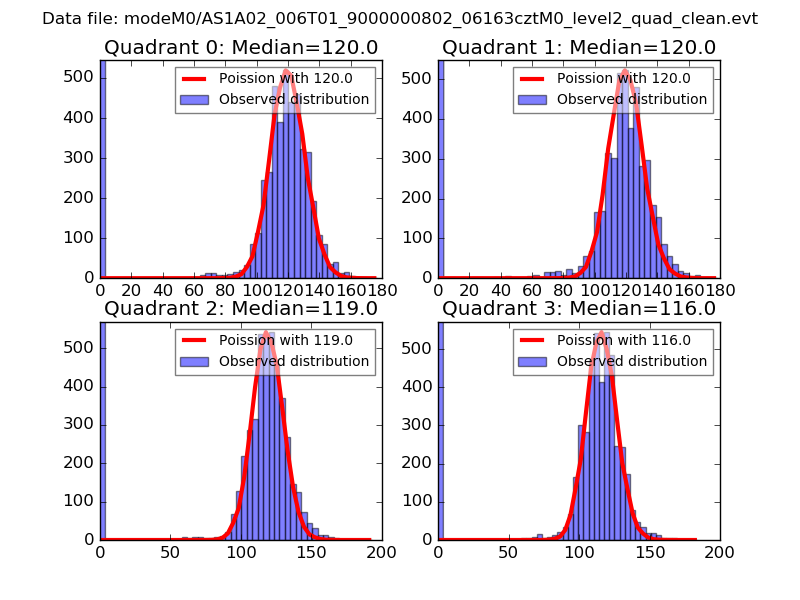 |
 |
| Quadrant-wise count rates Data is divided into 100 sec bins |
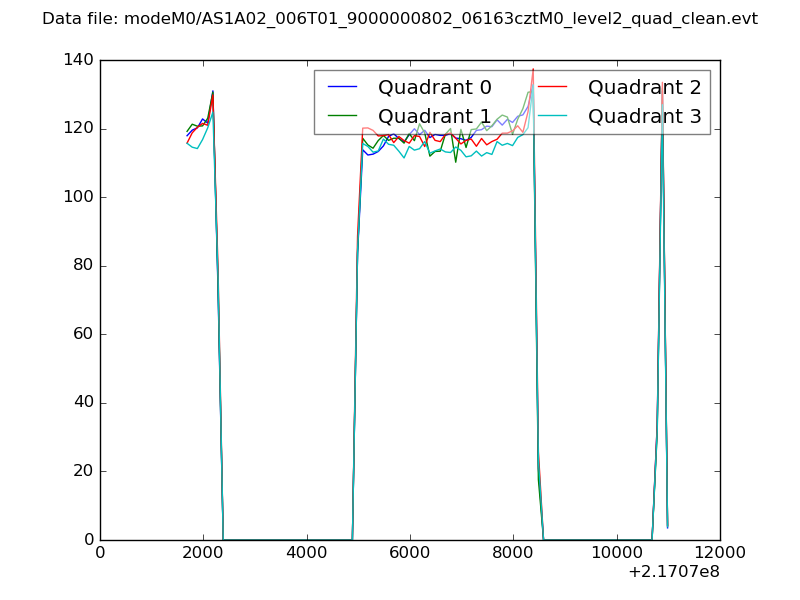 |
|
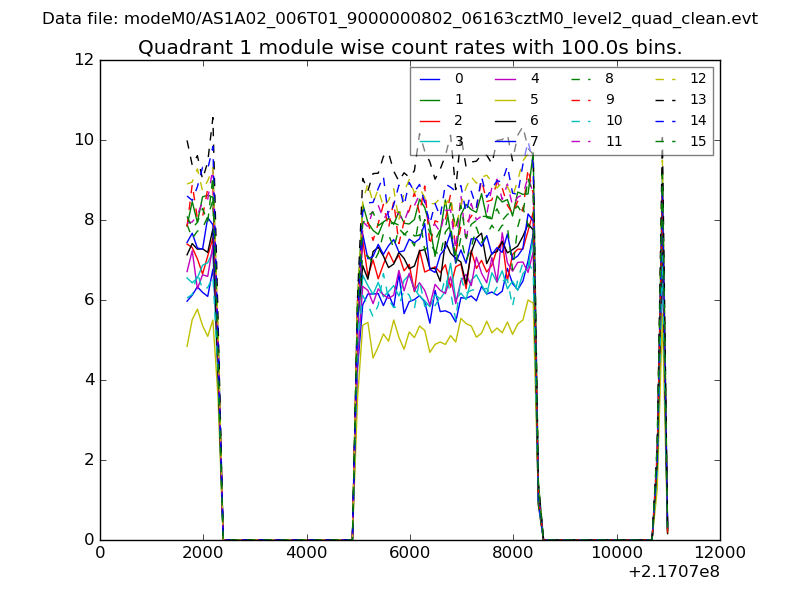
| Module-wise count rates for Quadrant A Data is divided into 100 sec bins |
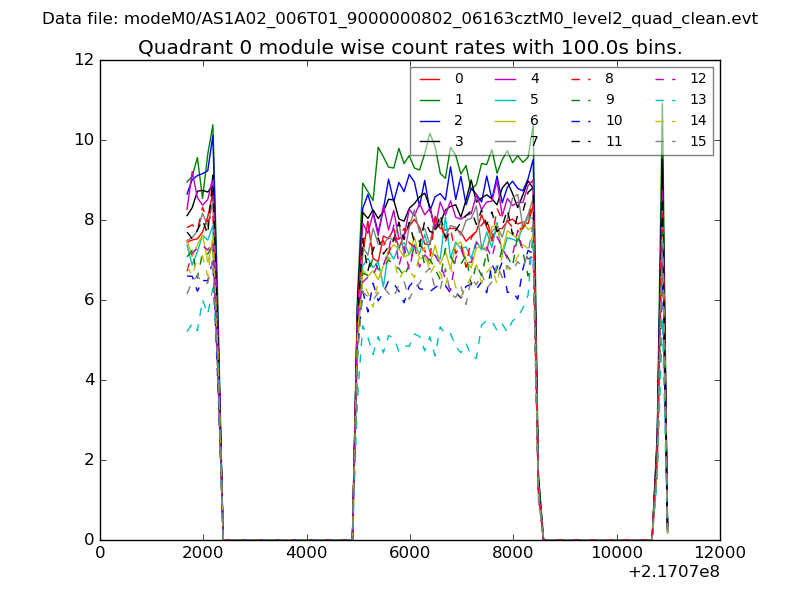 |
 |
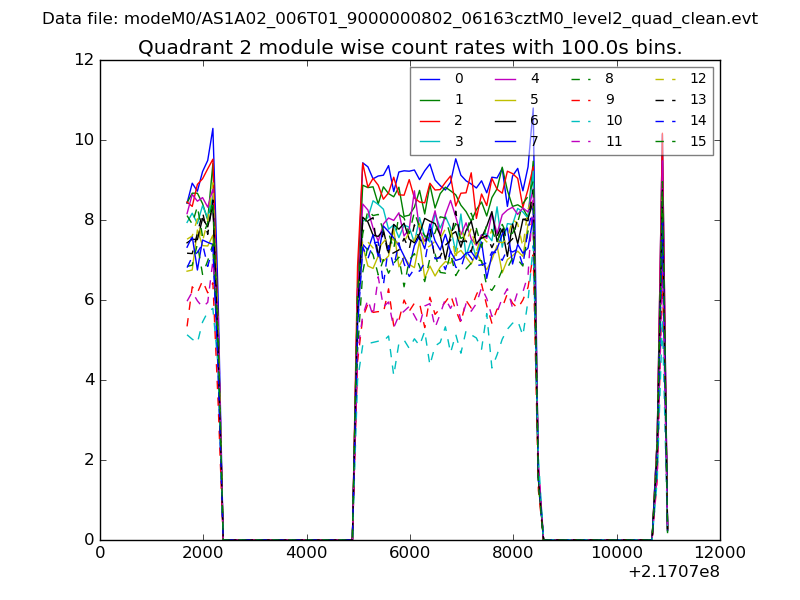
| Module-wise count rates for Quadrant B Data is divided into 100 sec bins |
 |
 |
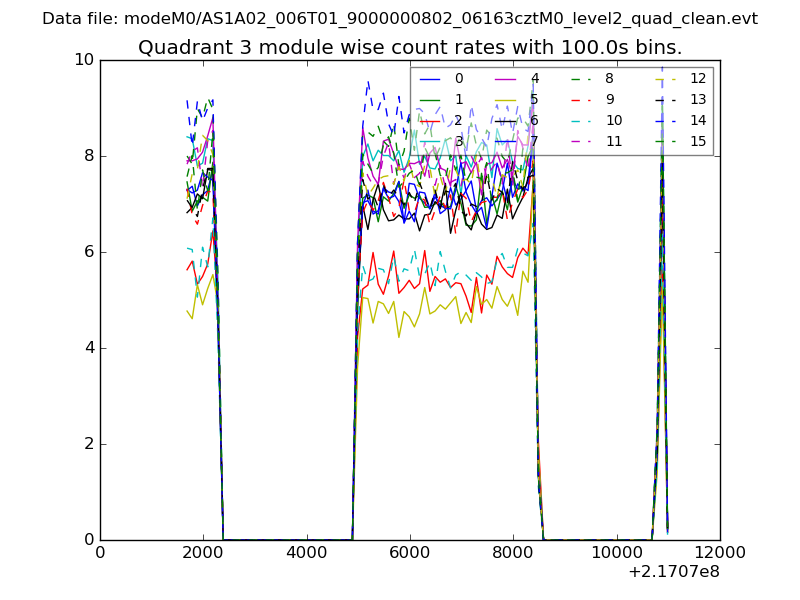
| Module-wise count rates for Quadrant C Data is divided into 100 sec bins |
 |
 |
| Module-wise count rates for Quadrant D Data is divided into 100 sec bins |
 |
 |
| Parameter | Plot |
|---|---|
| CZT HV Monitor |  |
| D_VDD | 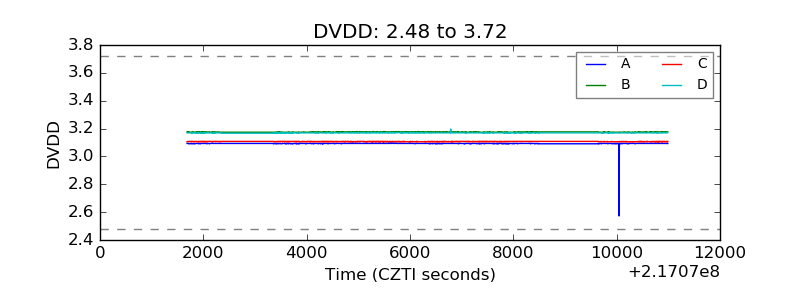 |
| Temperature 1 | 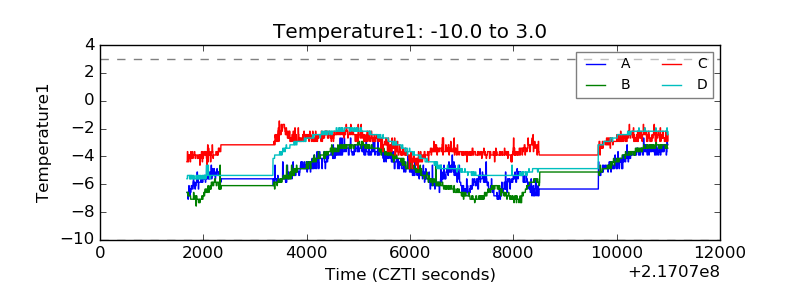 |
| Veto HV Monitor | 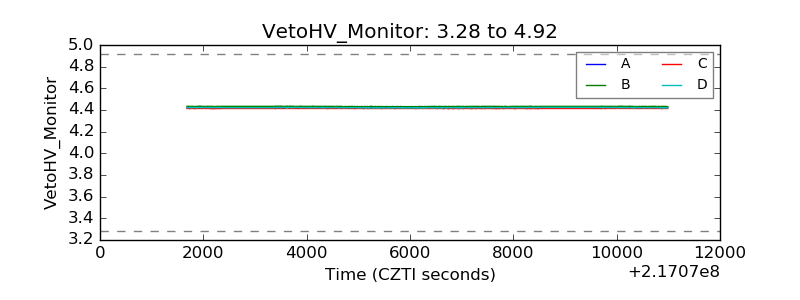 |
| Veto LLD | 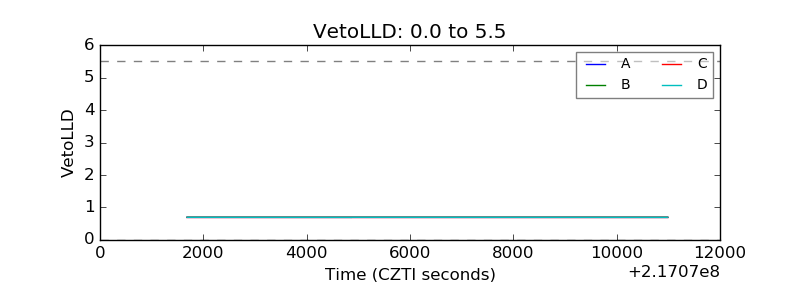 |
| Alpha Counter | 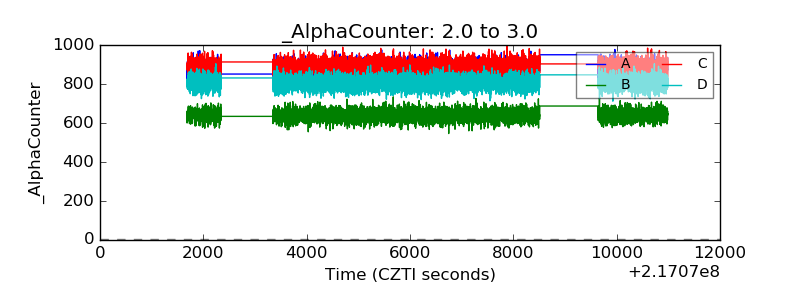 |
| _CPM_Rate | 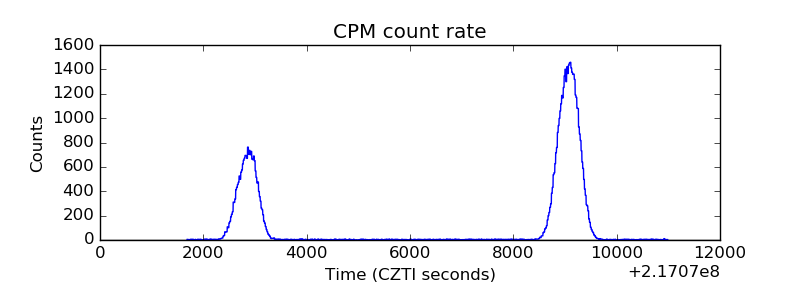 |
| CZT Counter | 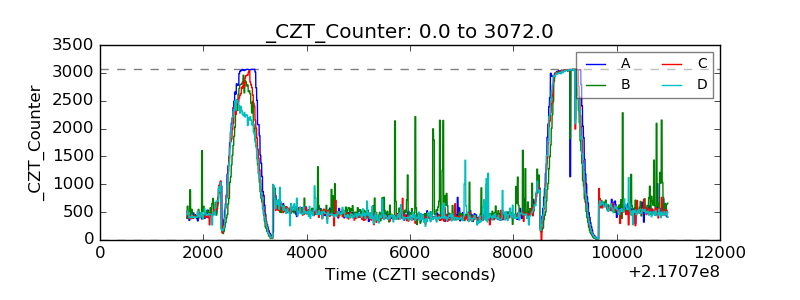 |
| +2.5 Volts monitor | 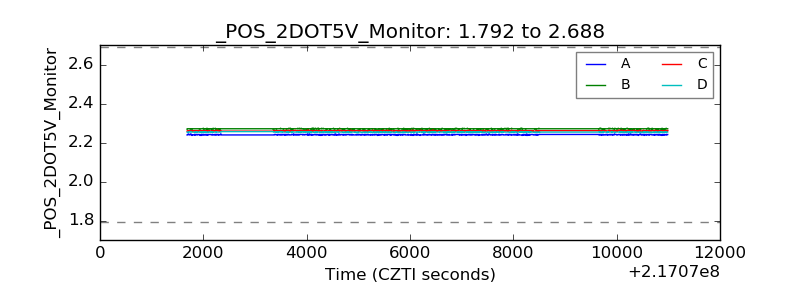 |
| +5 Volts monitor |  |
| _ROLL_ROT | 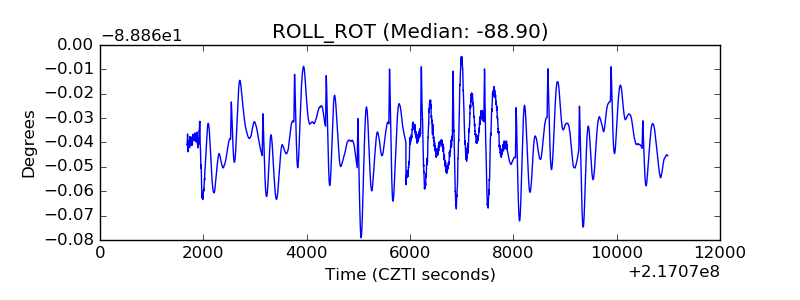 |
| _Roll_DEC | 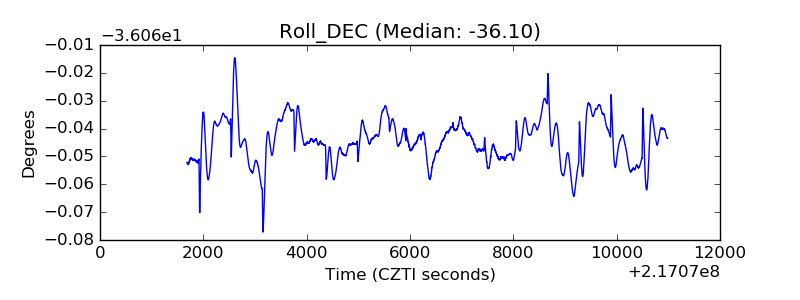 |
| _Roll_RA | 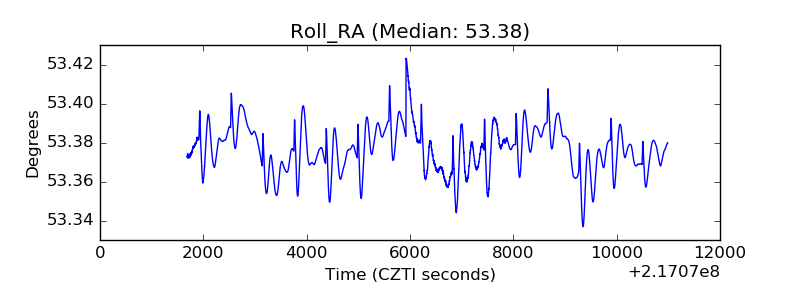 |
| Veto Counter | 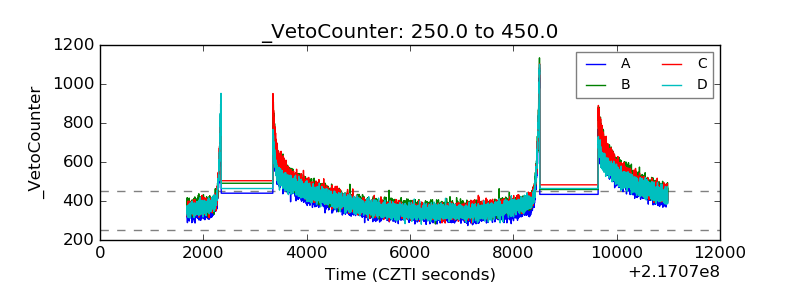 |