| Param | Original file | Final file |
|---|---|---|
| Filename | modeM0/AS1A02_006T01_9000000802_06164cztM0_level2.evt | modeM0/AS1A02_006T01_9000000802_06164cztM0_level2_quad_clean.evt |
| Size (bytes) | 444,467,520 | 85,383,360 |
| Size | 423.9 MB | 81.4 MB |
| Events in quadrant A | 3,248,968 | 540,678 |
| Events in quadrant B | 3,463,773 | 548,732 |
| Events in quadrant C | 3,115,275 | 536,559 |
| Events in quadrant D | 3,203,639 | 518,931 |
| Mode M0 | |||
|---|---|---|---|
| Quadrant | BADHDUFLAG | Total packets | Discarded packets |
| A | 0 | 13835 | 9 |
| B | 0 | 14539 | 15 |
| C | 0 | 13479 | 16 |
| D | 0 | 13912 | 16 |
| Mode SS | |||
|---|---|---|---|
| Quadrant | BADHDUFLAG | Total packets | Discarded packets |
| A | 0 | 130 | 0 |
| B | 0 | 130 | 0 |
| C | 0 | 130 | 0 |
| D | 0 | 130 | 0 |
| Mode M9 | |||
|---|---|---|---|
| Quadrant | BADHDUFLAG | Total packets | Discarded packets |
| A | 0 | 19 | 0 |
| B | 0 | 19 | 0 |
| C | 0 | 19 | 0 |
| D | 0 | 20 | 0 |
| Quadrant | Total seconds | Saturated seconds | Saturation percentage |
|---|---|---|---|
| A | 6309 | 45 | 0.713267% |
| B | 6307 | 94 | 1.490407% |
| C | 6306 | 45 | 0.713606% |
| D | 6307 | 63 | 0.998890% |
Noise dominated data is calculated using 1-second bins in cleaned event files. If a bin has >2000 counts, and if more than 50% of those come from <1% of pixels, then it is considered to be noise-dominated and hence unusable.
| Quadrant | # 1 sec bins | Bins with >0 counts | Bins with >2000 counts | High rate bins dominated by noise | Noise dominated (total time) | Noise dominated (detector-on time) | Marked lightcurve |
|---|---|---|---|---|---|---|---|
| A | 7582 | 6313 | 5 | 5 | 0.07% | 0.08% | 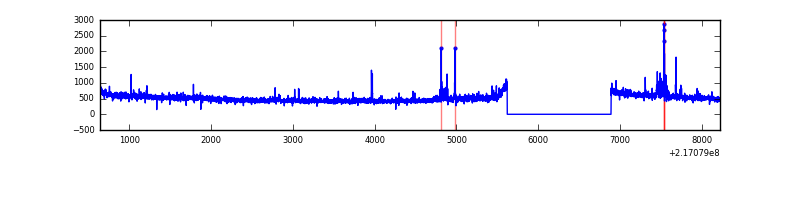 |
| B | 7582 | 6313 | 21 | 21 | 0.28% | 0.33% | 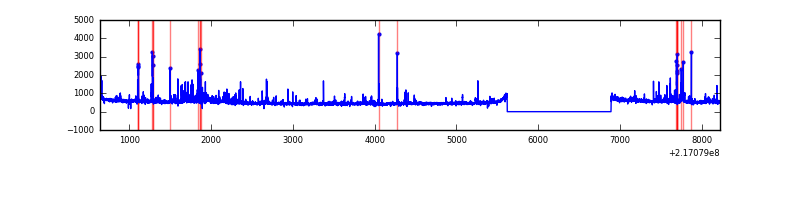 |
| C | 7582 | 6313 | 21 | 21 | 0.28% | 0.33% | 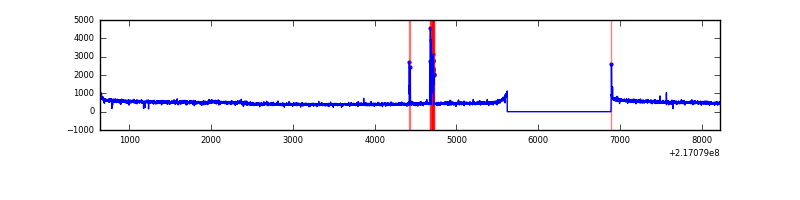 |
| D | 7582 | 6313 | 26 | 26 | 0.34% | 0.41% | 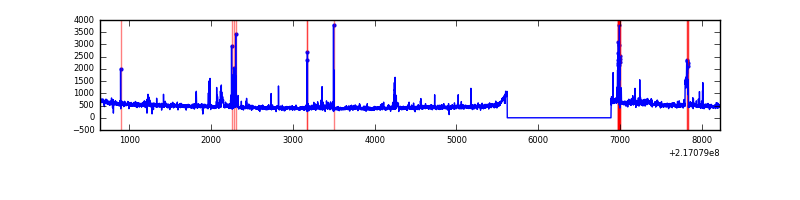 |
Top three noisy pixels from each quadrant. If the there are fewer than three noisy pixels in the level2.evt file, extra rows are filled as -1
| Pixel properties | Quadrant properties | ||||||
|---|---|---|---|---|---|---|---|
| Quadrant | DetID | PixID | Counts | Sigma | Mean | Median | Sigma |
| A | 8 | 15 | 166357 | 1038.47 | 788 | 774 | 159.4 |
| A | 13 | 251 | 34989 | 214.58 | 788 | 774 | 159.4 |
| A | 4 | 2 | 14925 | 88.75 | 788 | 774 | 159.4 |
| B | 3 | 64 | 172023 | 1150.98 | 793 | 775 | 148.8 |
| B | 0 | 219 | 128255 | 856.81 | 793 | 775 | 148.8 |
| B | 4 | 81 | 63388 | 420.83 | 793 | 775 | 148.8 |
| C | 1 | 16 | 133897 | 762.32 | 760 | 768 | 174.6 |
| C | 12 | 16 | 8023 | 41.54 | 760 | 768 | 174.6 |
| C | 13 | 61 | 5853 | 29.12 | 760 | 768 | 174.6 |
| D | 13 | 169 | 136846 | 732.67 | 759 | 738 | 185.8 |
| D | 1 | 20 | 57842 | 307.39 | 759 | 738 | 185.8 |
| D | 13 | 105 | 51887 | 275.33 | 759 | 738 | 185.8 |
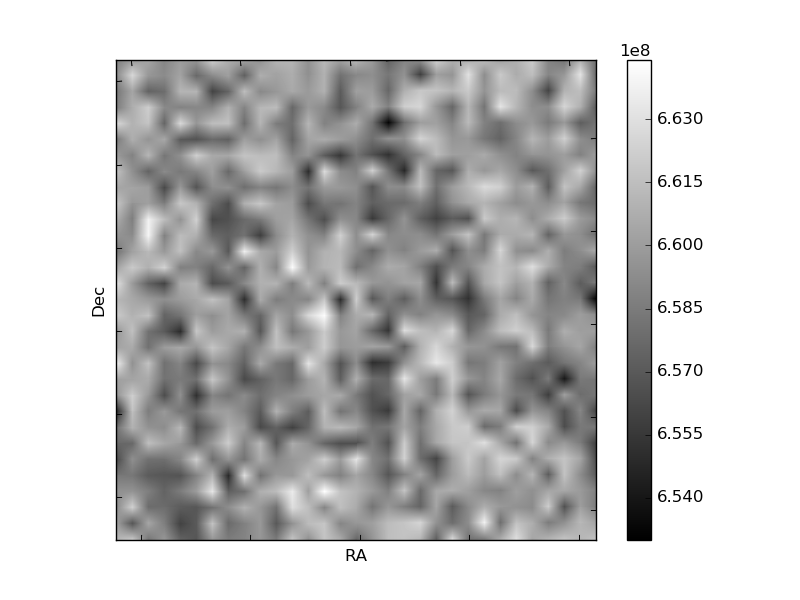
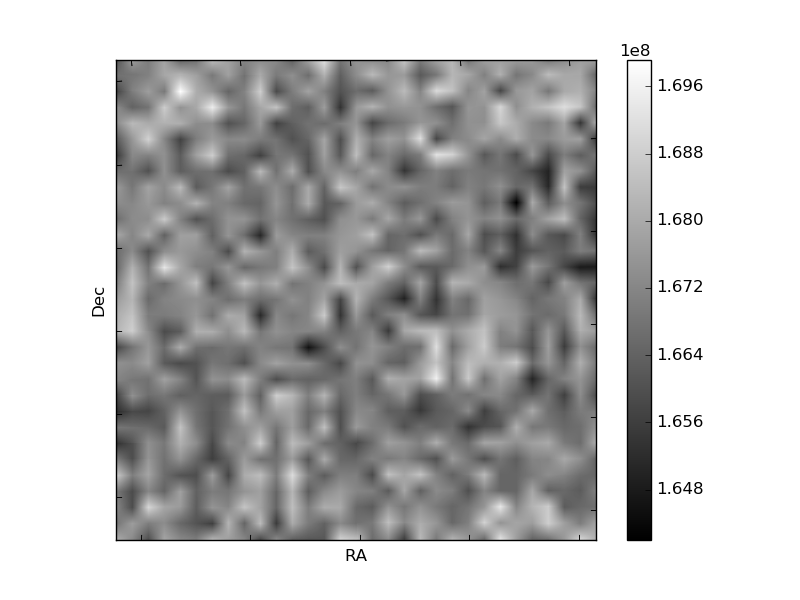
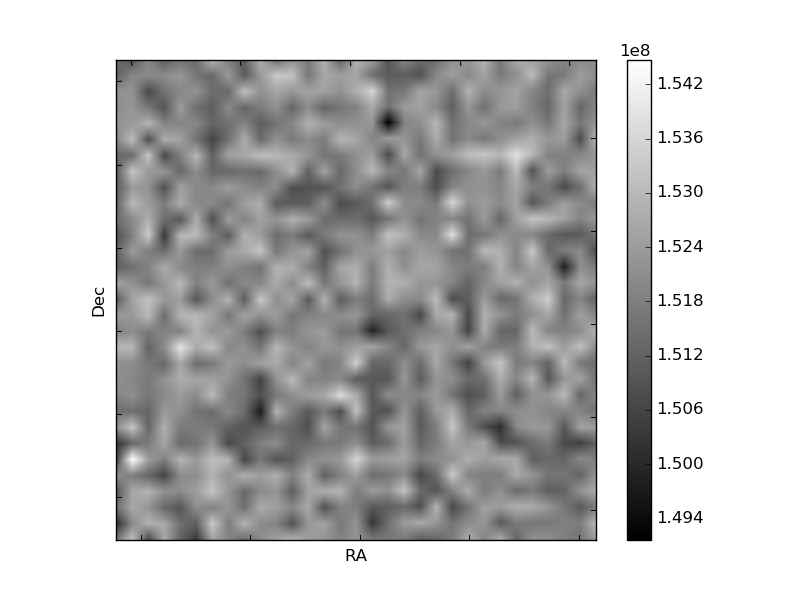
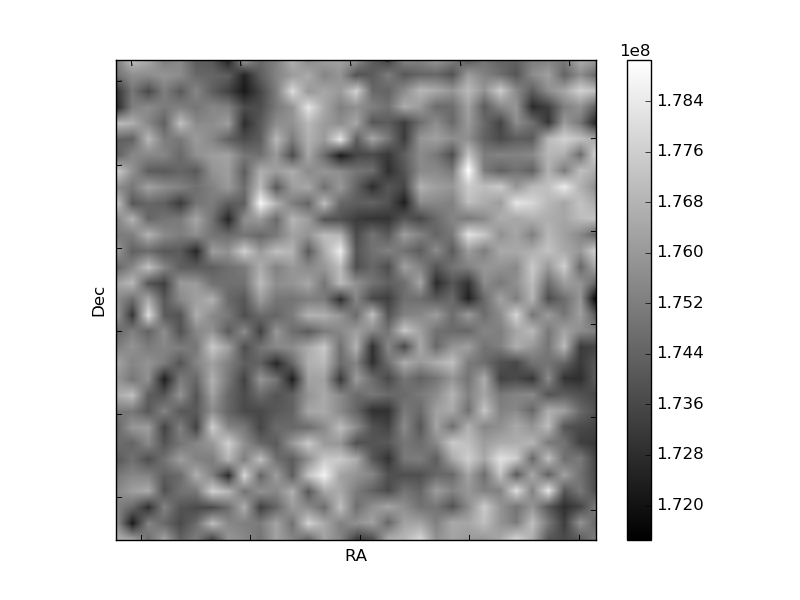
Histogram calculated using DETX and DETY for each event in the final _common_clean file
| Quadrant A | 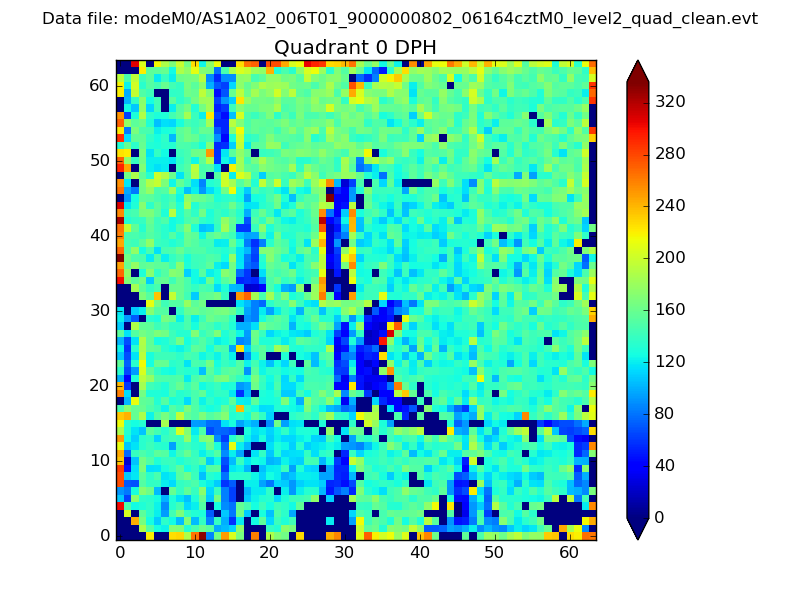 |
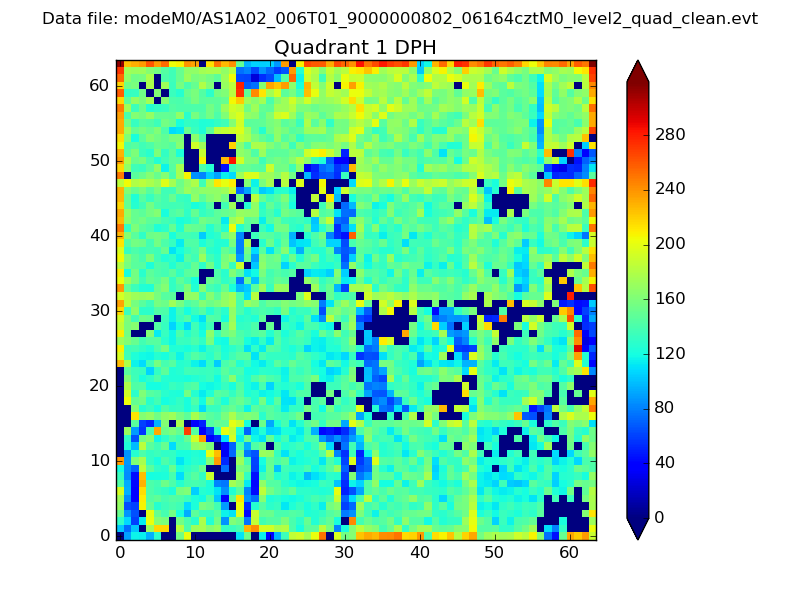 |
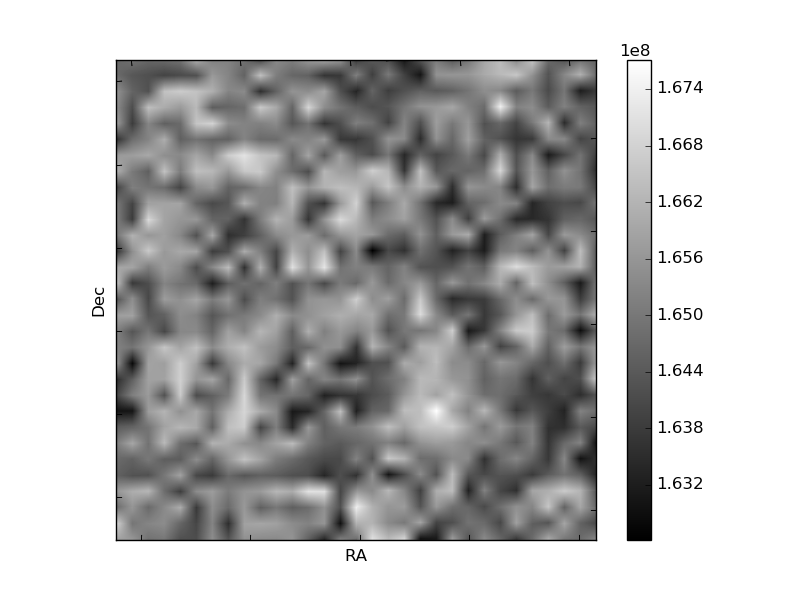
Quadrant B |
|---|---|---|---|
| Quadrant D | 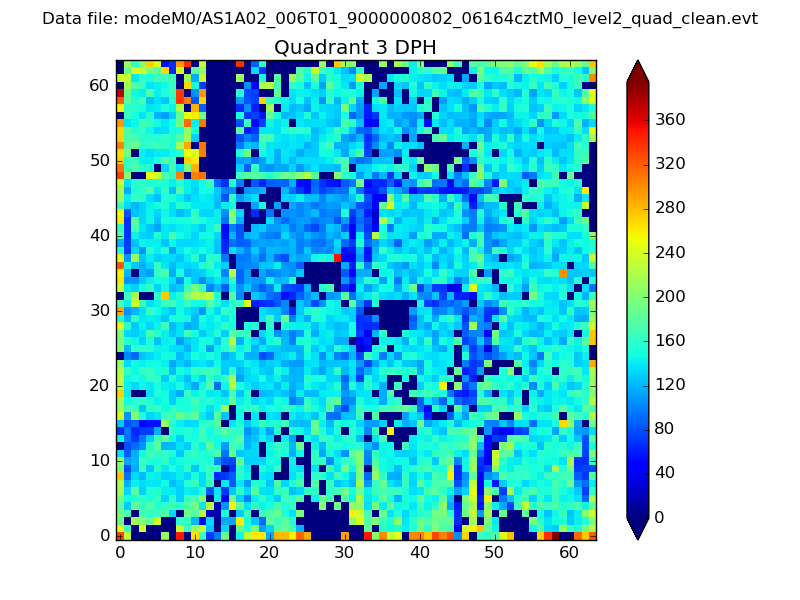 |
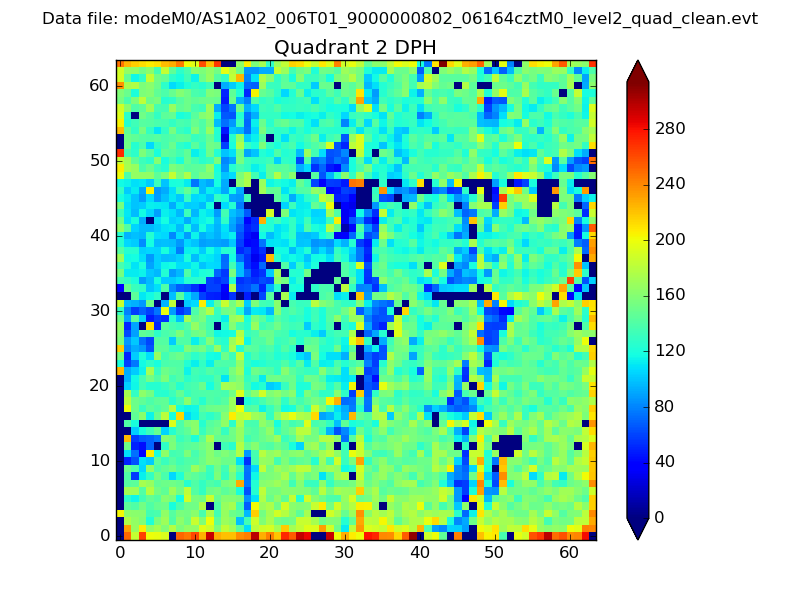 |
Quadrant C |
| Plot type | Count rate plots | Images |
|---|---|---|
| Comparison with Poisson distribution Blue bars denote a histogram of data divided into 1 sec bins. Red curve is a Poisson curve with rate = median count rate of data. |
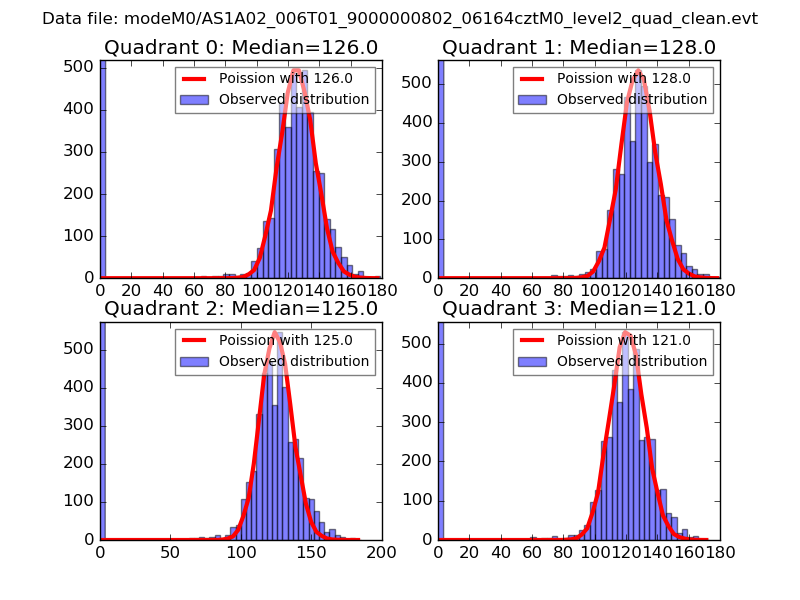 |
 |
| Quadrant-wise count rates Data is divided into 100 sec bins |
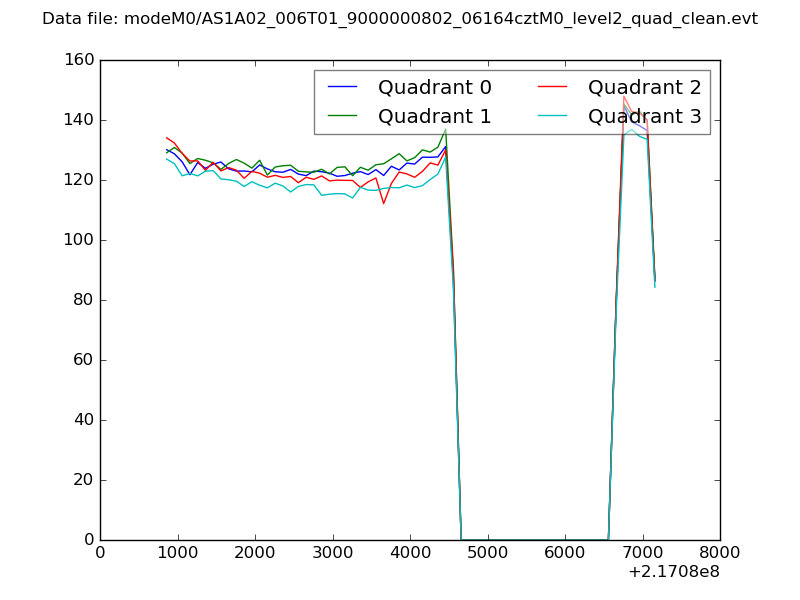 |
|
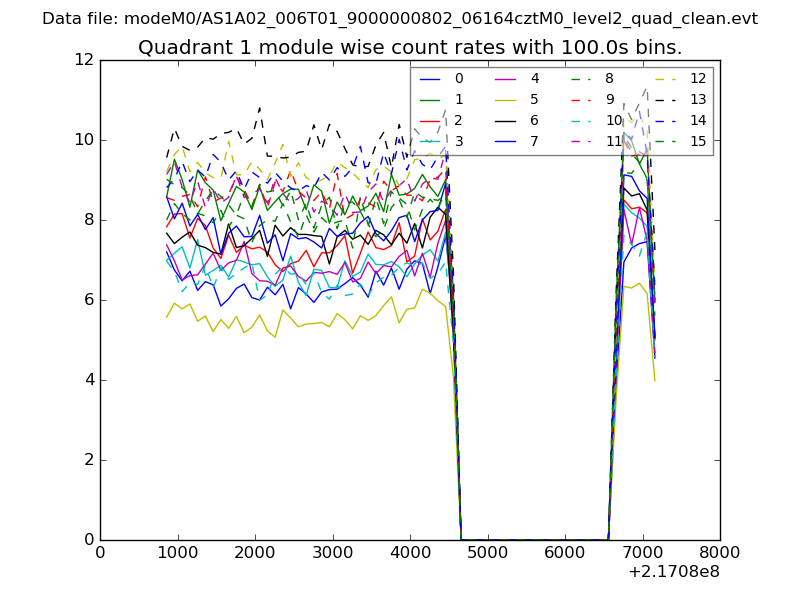
| Module-wise count rates for Quadrant A Data is divided into 100 sec bins |
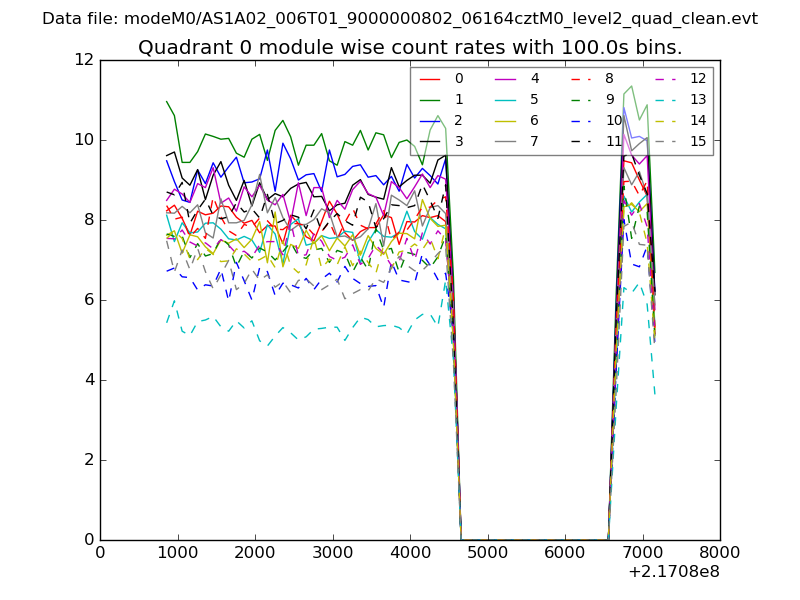 |
 |
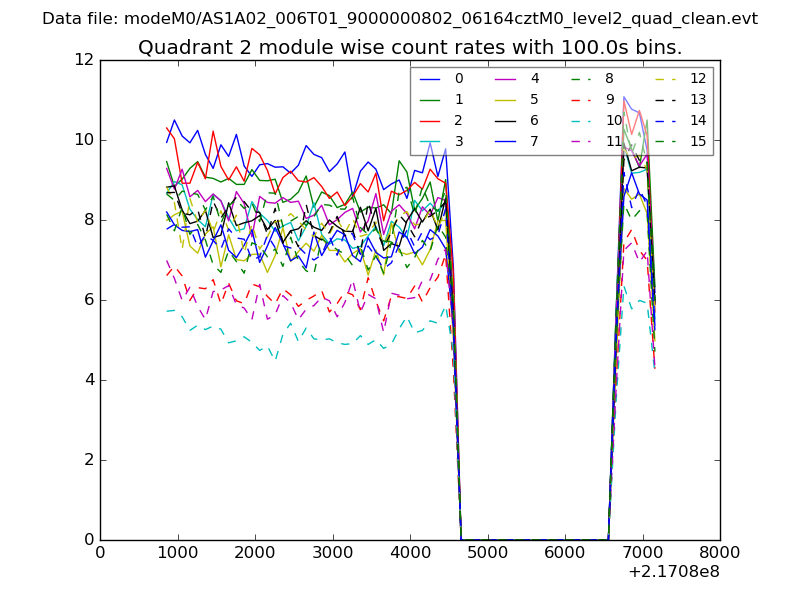
| Module-wise count rates for Quadrant B Data is divided into 100 sec bins |
 |
 |
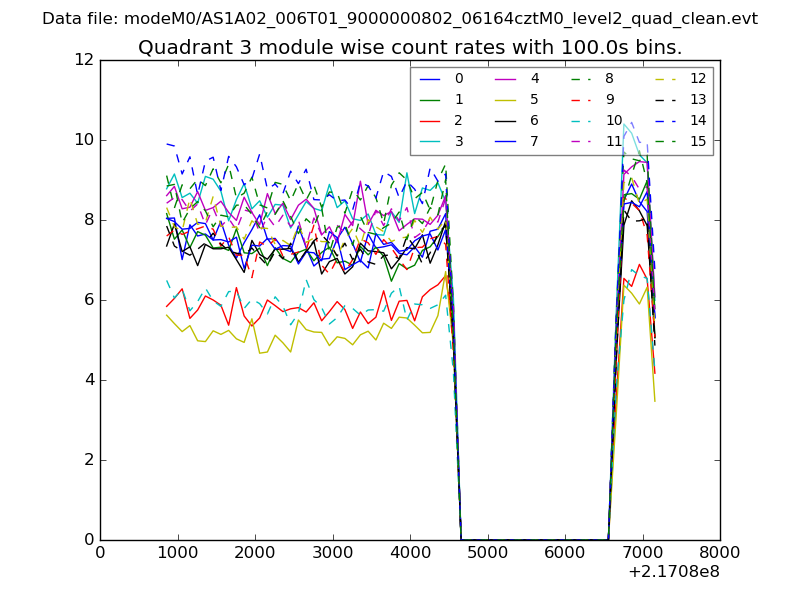
| Module-wise count rates for Quadrant C Data is divided into 100 sec bins |
 |
 |
| Module-wise count rates for Quadrant D Data is divided into 100 sec bins |
 |
 |
| Parameter | Plot |
|---|---|
| CZT HV Monitor | 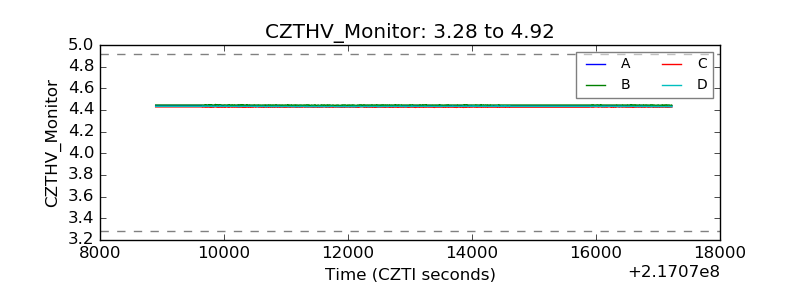 |
| D_VDD | 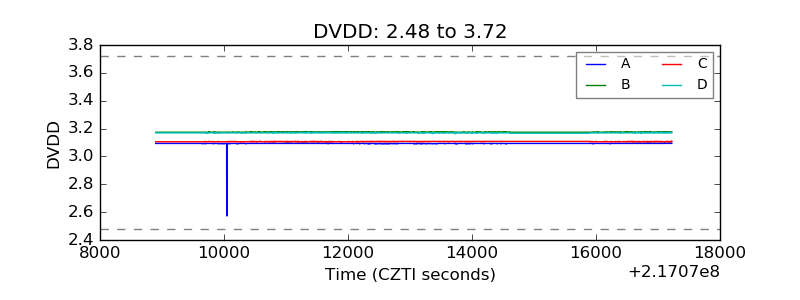 |
| Temperature 1 | 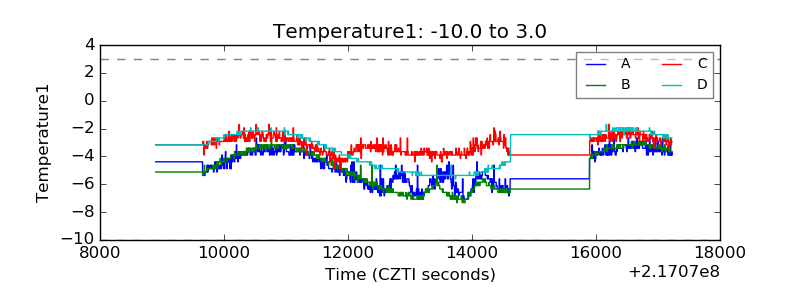 |
| Veto HV Monitor | 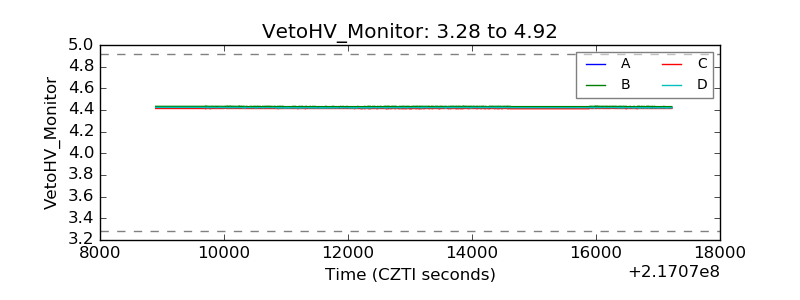 |
| Veto LLD | 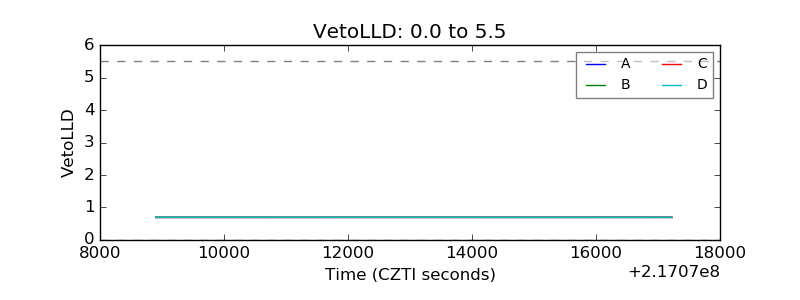 |
| Alpha Counter | 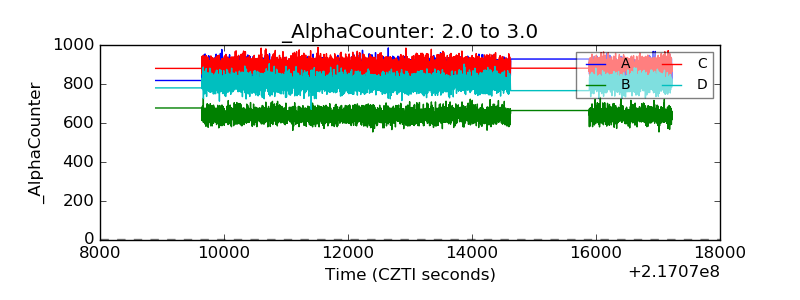 |
| _CPM_Rate | 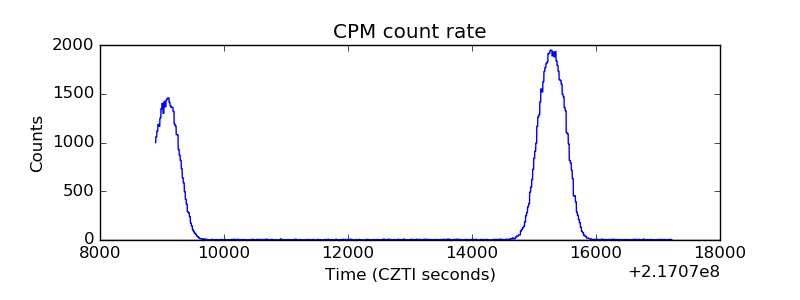 |
| CZT Counter | 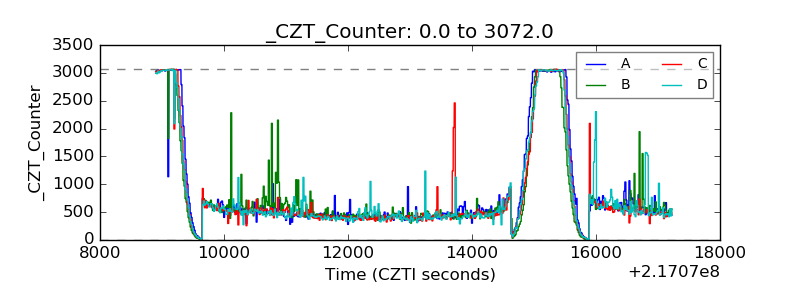 |
| +2.5 Volts monitor |  |
| +5 Volts monitor |  |
| _ROLL_ROT | 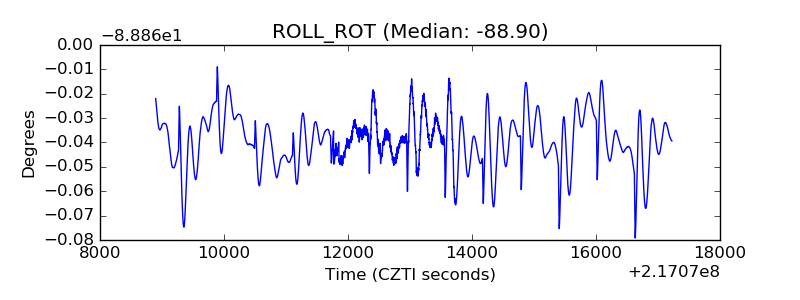 |
| _Roll_DEC | 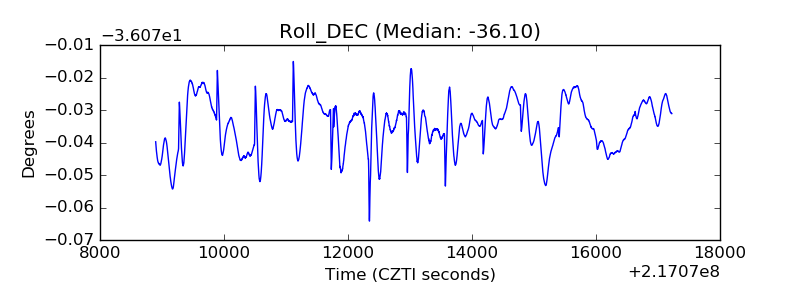 |
| _Roll_RA | 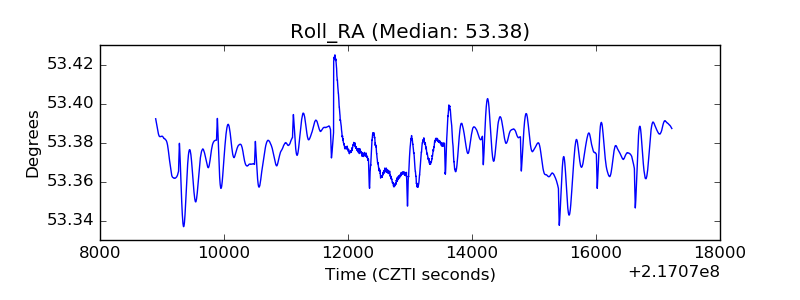 |
| Veto Counter | 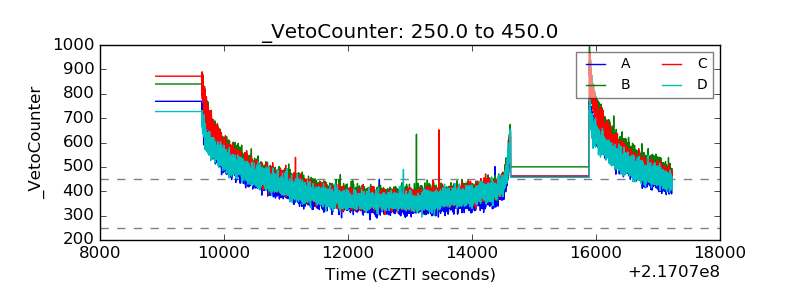 |