| Param | Original file | Final file |
|---|---|---|
| Filename | modeM0/AS1A02_006T01_9000000802_06165cztM0_level2.evt | modeM0/AS1A02_006T01_9000000802_06165cztM0_level2_quad_clean.evt |
| Size (bytes) | 469,157,760 | 104,575,680 |
| Size | 447.4 MB | 99.7 MB |
| Events in quadrant A | 3,504,243 | 684,263 |
| Events in quadrant B | 3,619,954 | 693,241 |
| Events in quadrant C | 3,216,971 | 672,409 |
| Events in quadrant D | 3,410,344 | 648,585 |
| Mode M0 | |||
|---|---|---|---|
| Quadrant | BADHDUFLAG | Total packets | Discarded packets |
| A | 0 | 14835 | 3 |
| B | 0 | 15111 | 2 |
| C | 0 | 14092 | 2 |
| D | 0 | 14879 | 2 |
| Mode SS | |||
|---|---|---|---|
| Quadrant | BADHDUFLAG | Total packets | Discarded packets |
| A | 0 | 138 | 0 |
| B | 0 | 138 | 0 |
| C | 0 | 138 | 0 |
| D | 0 | 138 | 0 |
| Mode M9 | |||
|---|---|---|---|
| Quadrant | BADHDUFLAG | Total packets | Discarded packets |
| A | 0 | 23 | 0 |
| B | 0 | 23 | 0 |
| C | 0 | 23 | 0 |
| D | 0 | 24 | 0 |
| Quadrant | Total seconds | Saturated seconds | Saturation percentage |
|---|---|---|---|
| A | 6719 | 123 | 1.830630% |
| B | 6719 | 141 | 2.098527% |
| C | 6719 | 77 | 1.146004% |
| D | 6719 | 151 | 2.247358% |
Noise dominated data is calculated using 1-second bins in cleaned event files. If a bin has >2000 counts, and if more than 50% of those come from <1% of pixels, then it is considered to be noise-dominated and hence unusable.
| Quadrant | # 1 sec bins | Bins with >0 counts | Bins with >2000 counts | High rate bins dominated by noise | Noise dominated (total time) | Noise dominated (detector-on time) | Marked lightcurve |
|---|---|---|---|---|---|---|---|
| A | 8029 | 6719 | 9 | 9 | 0.11% | 0.13% | 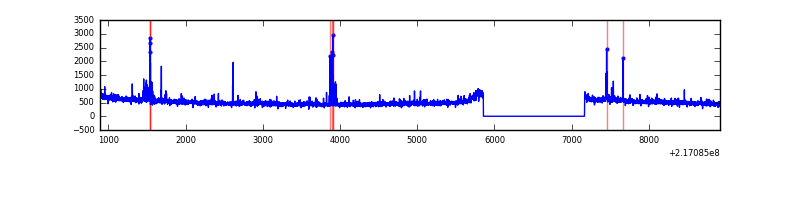 |
| B | 8029 | 6719 | 25 | 25 | 0.31% | 0.37% | 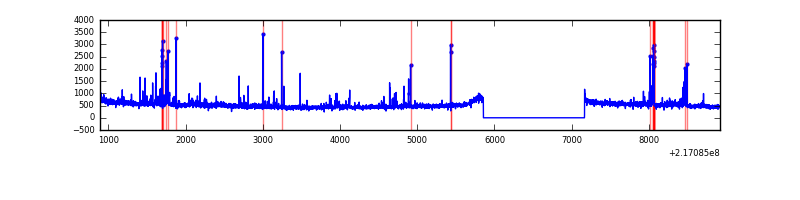 |
| C | 8029 | 6719 | 2 | 2 | 0.02% | 0.03% | 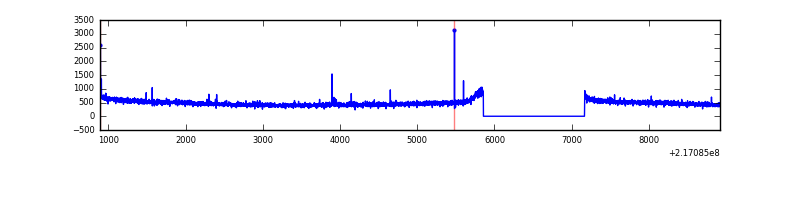 |
| D | 8029 | 6720 | 53 | 53 | 0.66% | 0.79% | 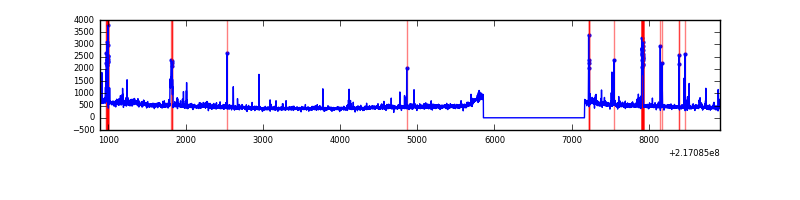 |
Top three noisy pixels from each quadrant. If the there are fewer than three noisy pixels in the level2.evt file, extra rows are filled as -1
| Pixel properties | Quadrant properties | ||||||
|---|---|---|---|---|---|---|---|
| Quadrant | DetID | PixID | Counts | Sigma | Mean | Median | Sigma |
| A | 8 | 15 | 166442 | 962.49 | 850 | 831 | 172.1 |
| A | 13 | 251 | 44049 | 251.17 | 850 | 831 | 172.1 |
| A | 14 | 111 | 22354 | 125.09 | 850 | 831 | 172.1 |
| B | 3 | 64 | 142674 | 880.3 | 855 | 838 | 161.1 |
| B | 0 | 219 | 69362 | 425.29 | 855 | 838 | 161.1 |
| B | 4 | 81 | 31638 | 191.16 | 855 | 838 | 161.1 |
| C | 9 | 16 | 15106 | 76.42 | 814 | 821 | 186.9 |
| C | 12 | 16 | 13878 | 69.85 | 814 | 821 | 186.9 |
| C | 1 | 16 | 8358 | 40.32 | 814 | 821 | 186.9 |
| D | 13 | 169 | 241496 | 1224.8 | 809 | 786 | 196.5 |
| D | 5 | 97 | 33098 | 164.41 | 809 | 786 | 196.5 |
| D | 8 | 195 | 31594 | 156.76 | 809 | 786 | 196.5 |
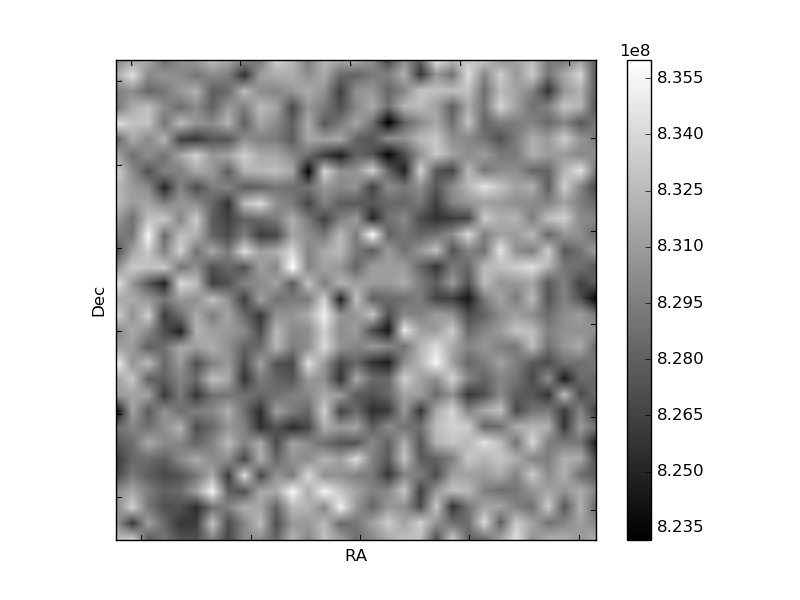
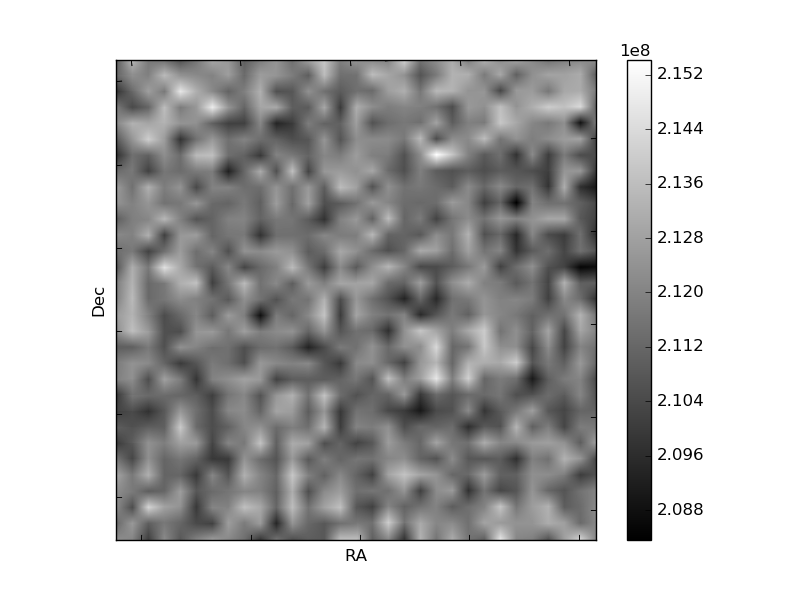
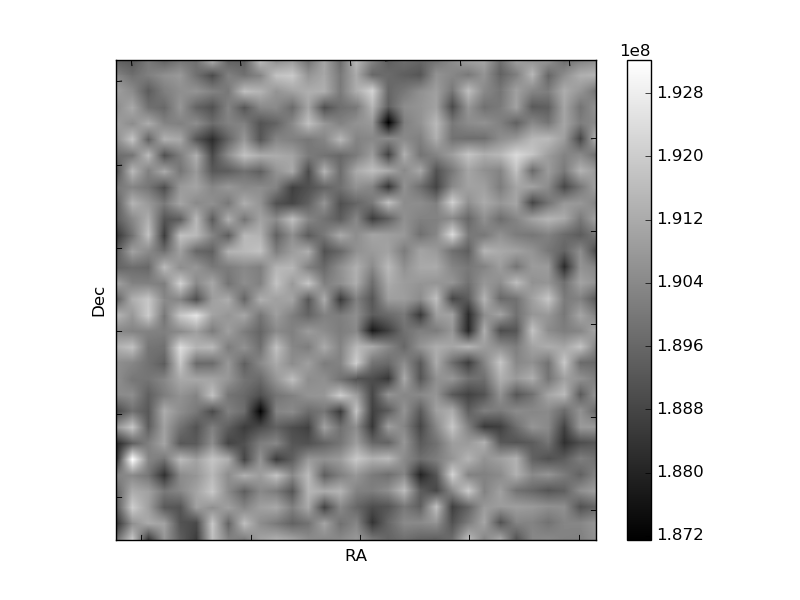
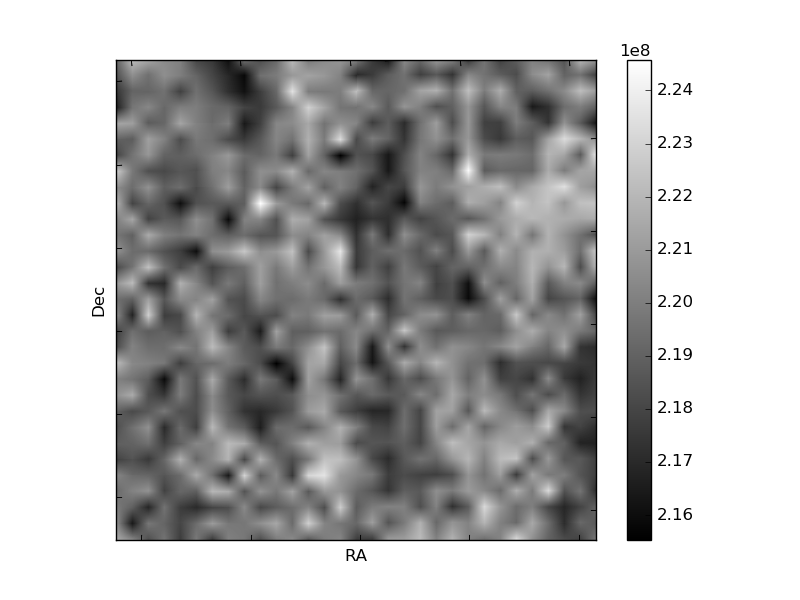
Histogram calculated using DETX and DETY for each event in the final _common_clean file
| Quadrant A | 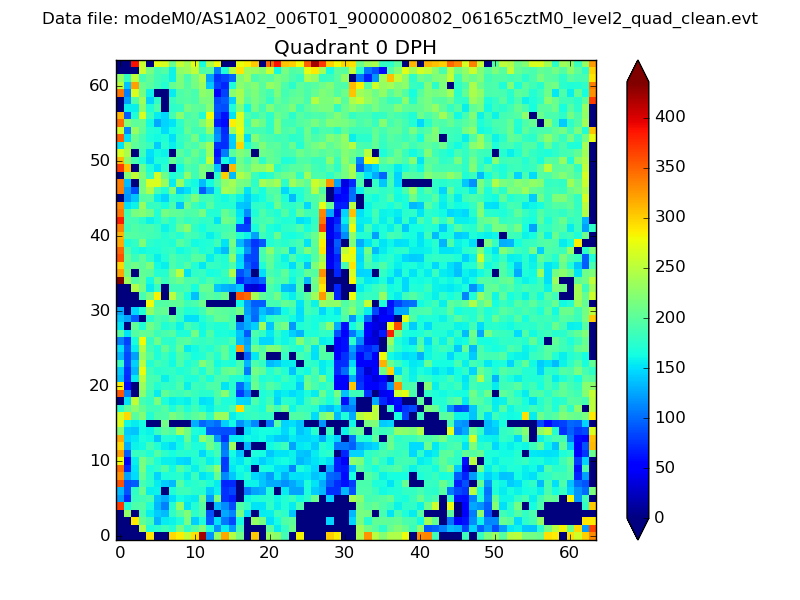 |
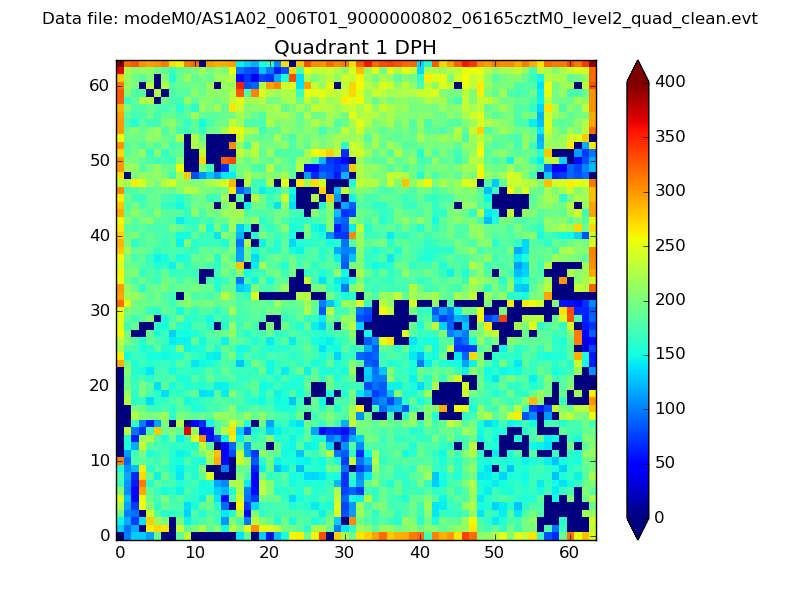 |
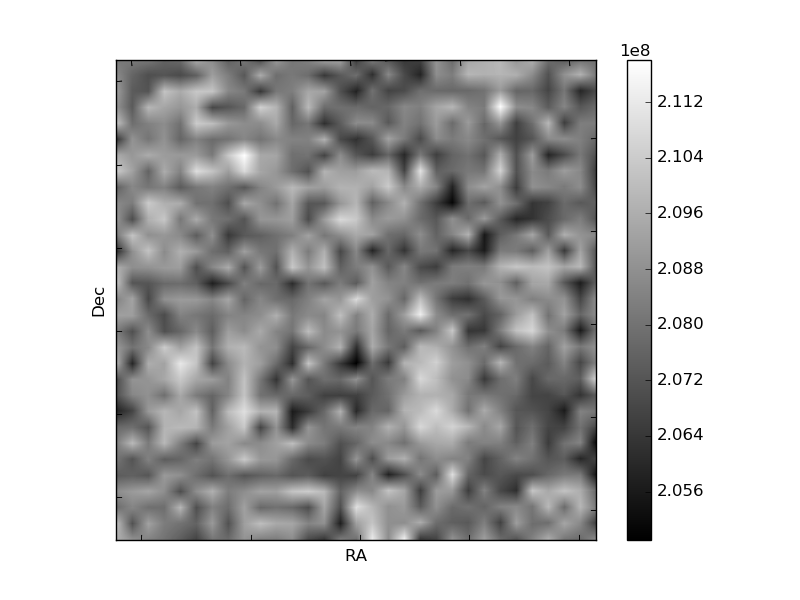
Quadrant B |
|---|---|---|---|
| Quadrant D | 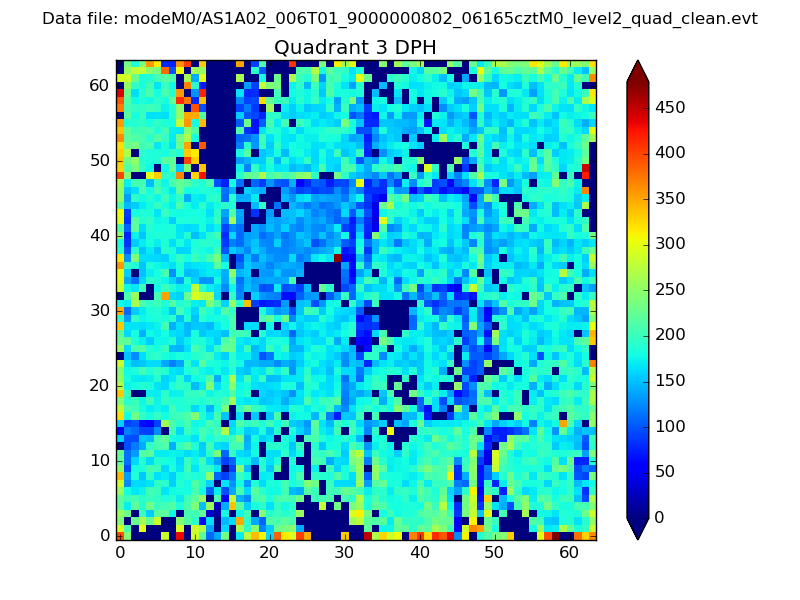 |
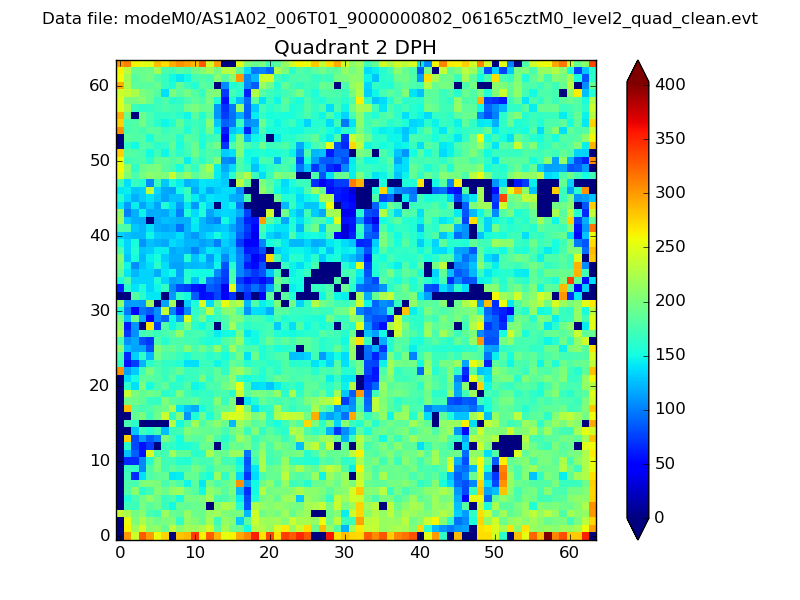 |
Quadrant C |
| Plot type | Count rate plots | Images |
|---|---|---|
| Comparison with Poisson distribution Blue bars denote a histogram of data divided into 1 sec bins. Red curve is a Poisson curve with rate = median count rate of data. |
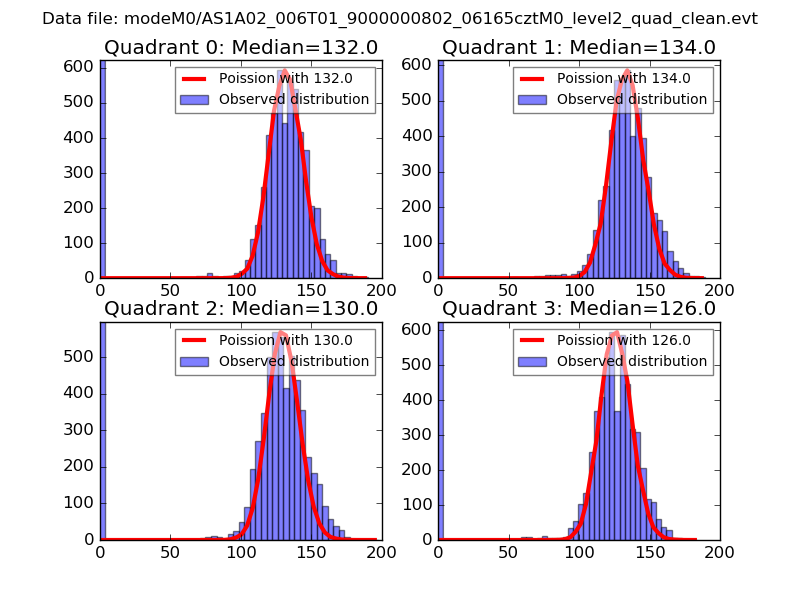 |
 |
| Quadrant-wise count rates Data is divided into 100 sec bins |
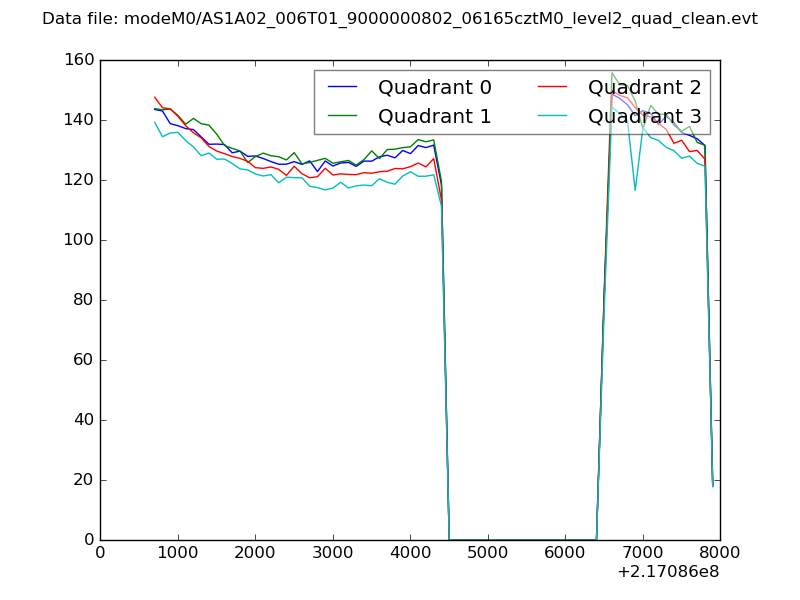 |
|
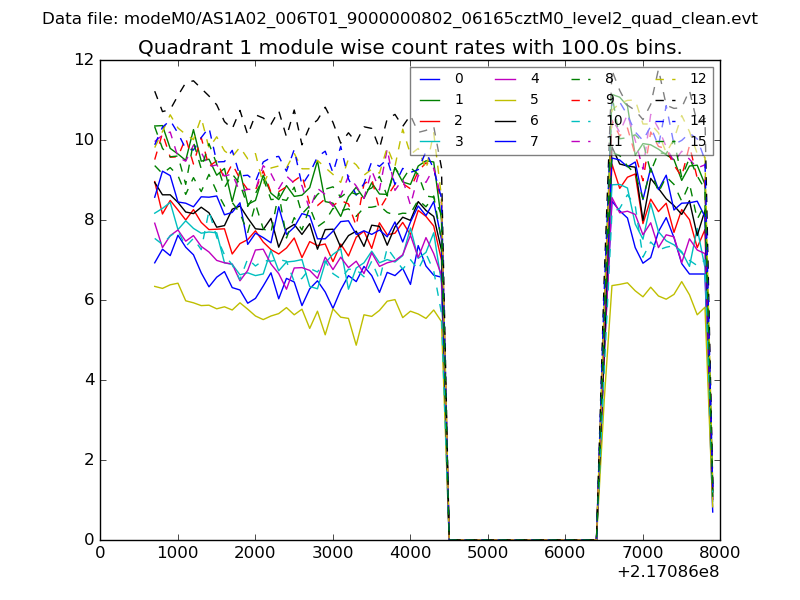
| Module-wise count rates for Quadrant A Data is divided into 100 sec bins |
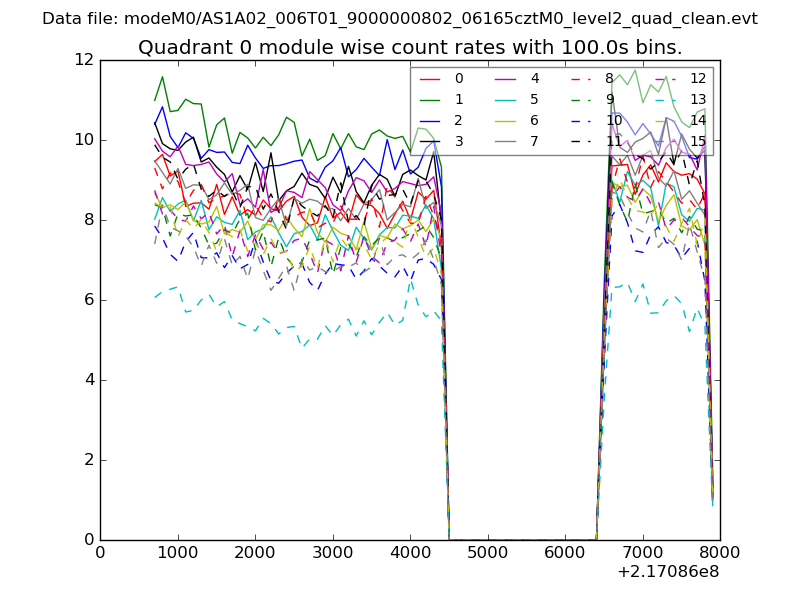 |
 |
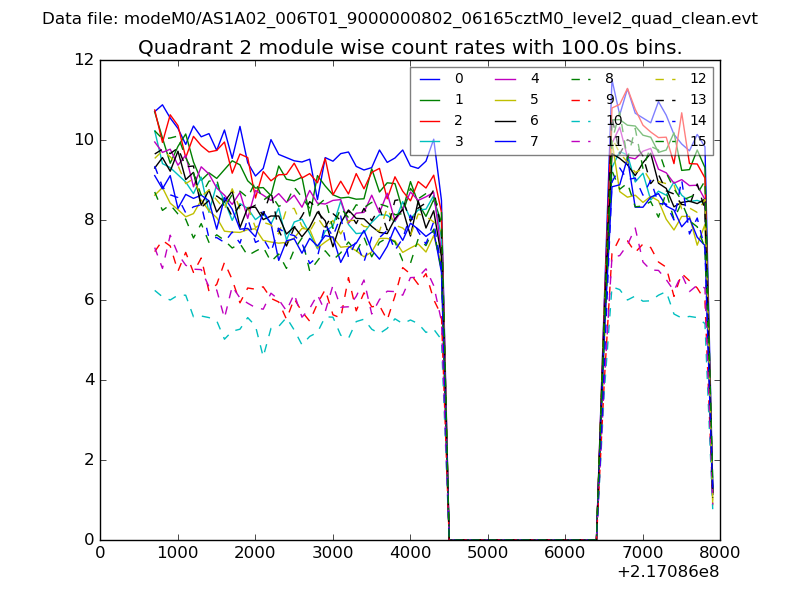
| Module-wise count rates for Quadrant B Data is divided into 100 sec bins |
 |
 |
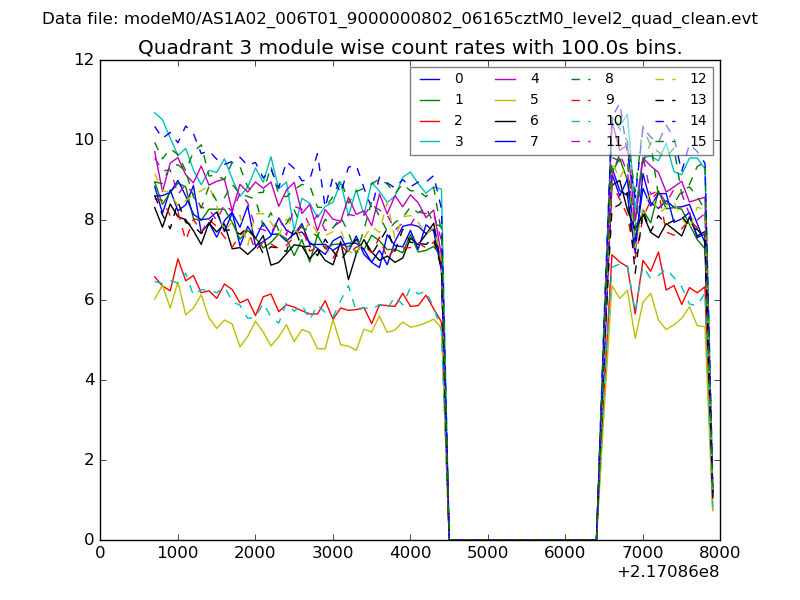
| Module-wise count rates for Quadrant C Data is divided into 100 sec bins |
 |
 |
| Module-wise count rates for Quadrant D Data is divided into 100 sec bins |
 |
 |
| Parameter | Plot |
|---|---|
| CZT HV Monitor | 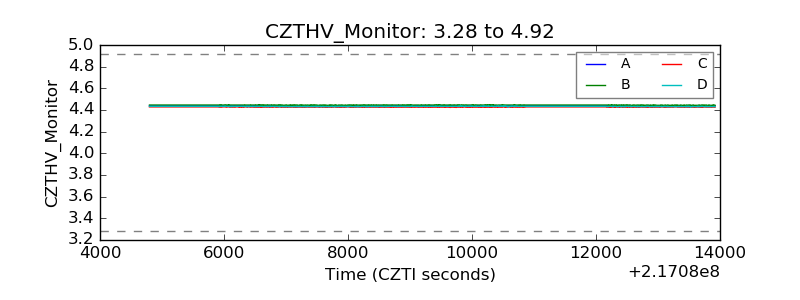 |
| D_VDD | 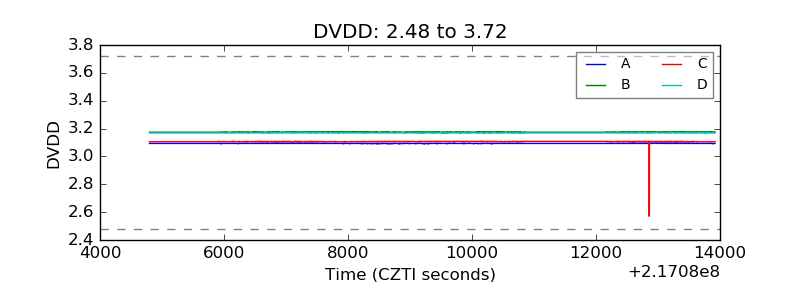 |
| Temperature 1 | 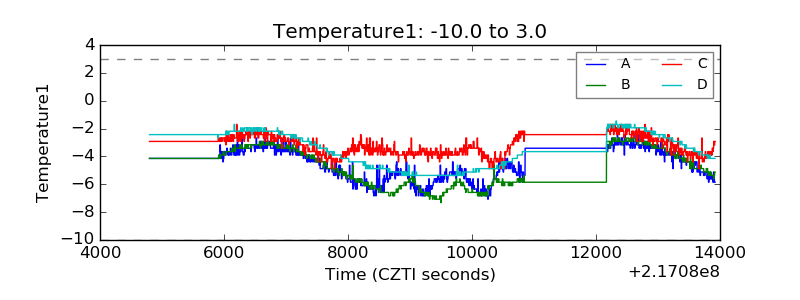 |
| Veto HV Monitor | 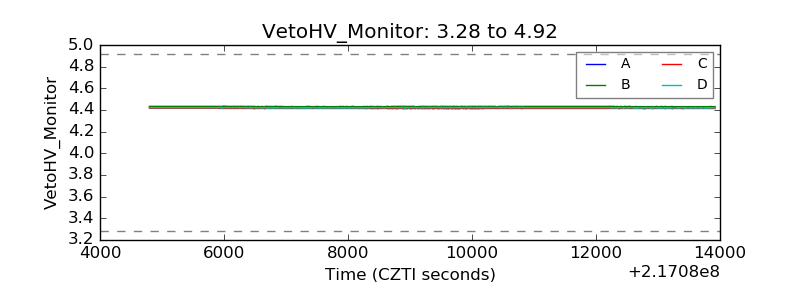 |
| Veto LLD | 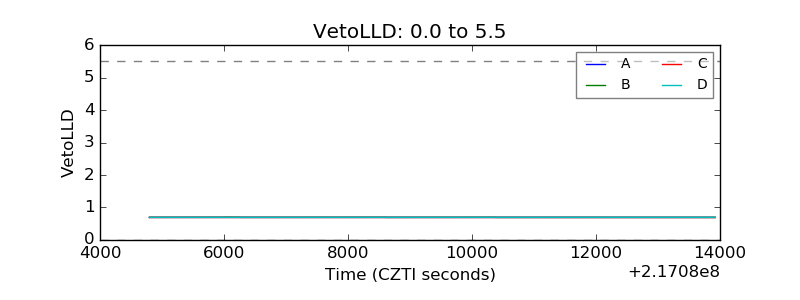 |
| Alpha Counter | 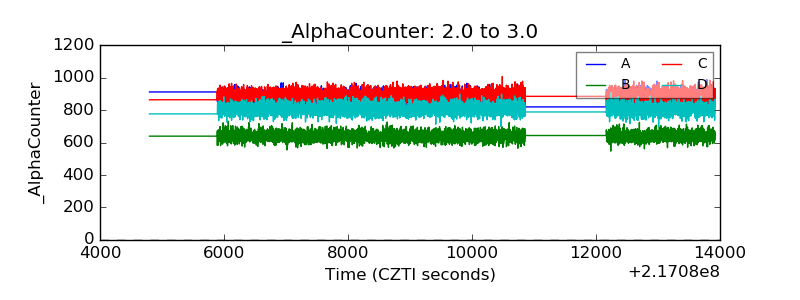 |
| _CPM_Rate | 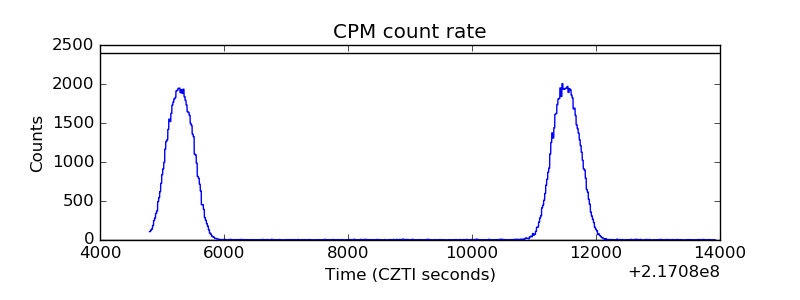 |
| CZT Counter | 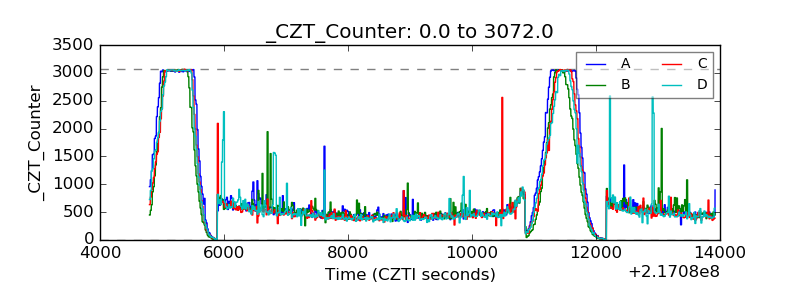 |
| +2.5 Volts monitor |  |
| +5 Volts monitor |  |
| _ROLL_ROT | 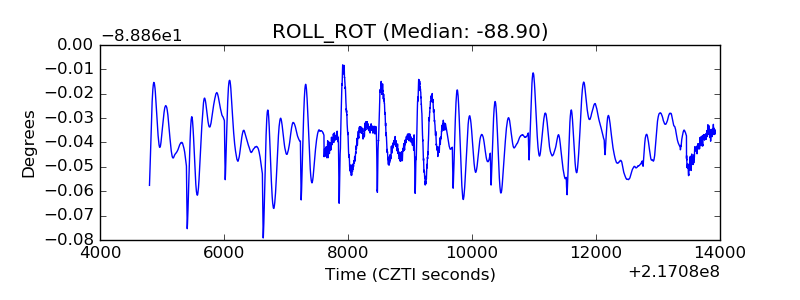 |
| _Roll_DEC | 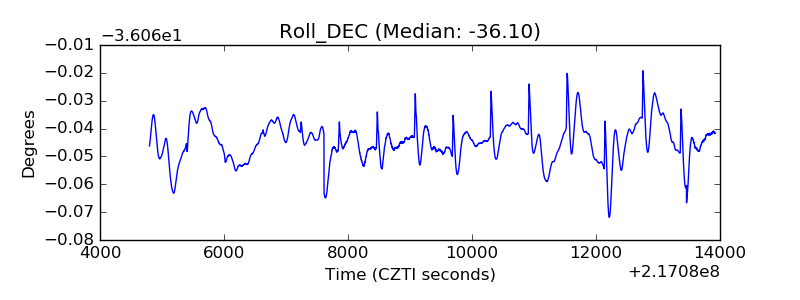 |
| _Roll_RA | 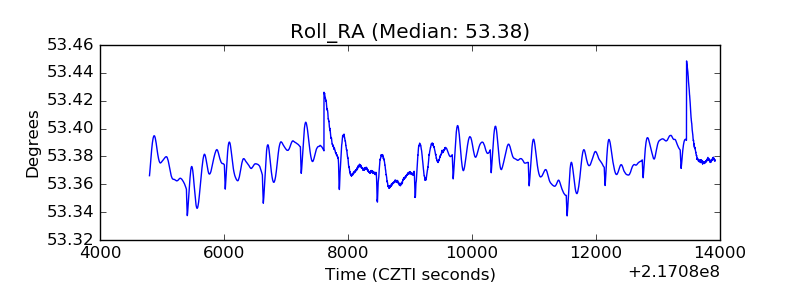 |
| Veto Counter | 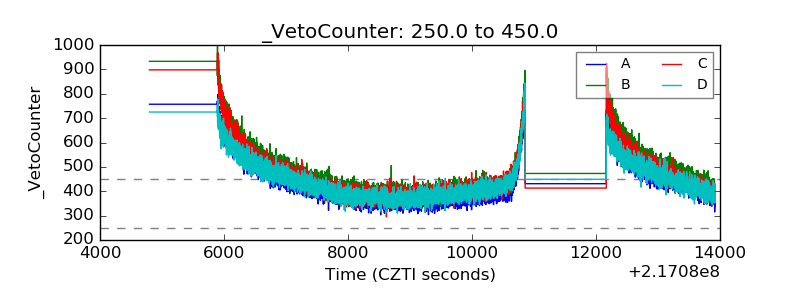 |