| Param | Original file | Final file |
|---|---|---|
| Filename | modeM0/AS1A02_006T01_9000000802_06166cztM0_level2.evt | modeM0/AS1A02_006T01_9000000802_06166cztM0_level2_quad_clean.evt |
| Size (bytes) | 462,355,200 | 109,676,160 |
| Size | 440.9 MB | 104.6 MB |
| Events in quadrant A | 3,446,668 | 724,048 |
| Events in quadrant B | 3,490,971 | 737,915 |
| Events in quadrant C | 3,171,348 | 712,465 |
| Events in quadrant D | 3,438,183 | 680,609 |
| Mode M0 | |||
|---|---|---|---|
| Quadrant | BADHDUFLAG | Total packets | Discarded packets |
| A | 0 | 14656 | 3 |
| B | 0 | 14744 | 2 |
| C | 0 | 14014 | 2 |
| D | 0 | 14881 | 2 |
| Mode SS | |||
|---|---|---|---|
| Quadrant | BADHDUFLAG | Total packets | Discarded packets |
| A | 0 | 136 | 0 |
| B | 0 | 136 | 0 |
| C | 0 | 136 | 0 |
| D | 0 | 136 | 0 |
| Mode M9 | |||
|---|---|---|---|
| Quadrant | BADHDUFLAG | Total packets | Discarded packets |
| A | 0 | 27 | 0 |
| B | 0 | 27 | 0 |
| C | 0 | 27 | 0 |
| D | 0 | 27 | 0 |
| Quadrant | Total seconds | Saturated seconds | Saturation percentage |
|---|---|---|---|
| A | 6701 | 192 | 2.865244% |
| B | 6701 | 190 | 2.835398% |
| C | 6701 | 115 | 1.716162% |
| D | 6701 | 185 | 2.760782% |
Noise dominated data is calculated using 1-second bins in cleaned event files. If a bin has >2000 counts, and if more than 50% of those come from <1% of pixels, then it is considered to be noise-dominated and hence unusable.
| Quadrant | # 1 sec bins | Bins with >0 counts | Bins with >2000 counts | High rate bins dominated by noise | Noise dominated (total time) | Noise dominated (detector-on time) | Marked lightcurve |
|---|---|---|---|---|---|---|---|
| A | 9341 | 6702 | 10 | 10 | 0.11% | 0.15% | 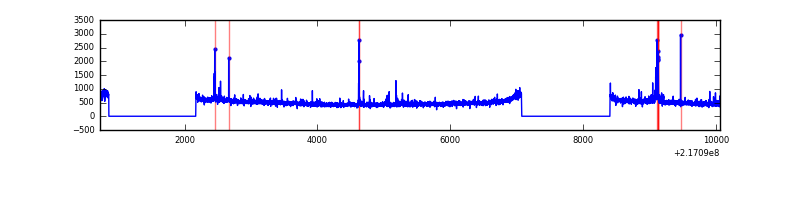 |
| B | 9341 | 6702 | 15 | 15 | 0.16% | 0.22% | 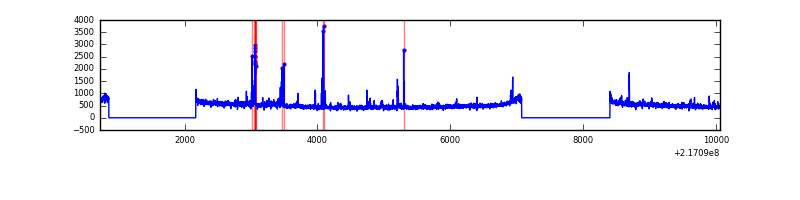 |
| C | 9341 | 6702 | 0 | 0 | 0.00% | 0.00% | 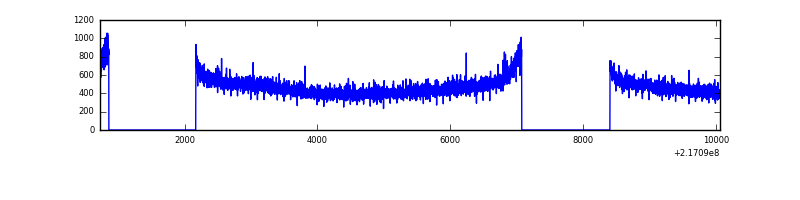 |
| D | 9341 | 6703 | 53 | 53 | 0.57% | 0.79% | 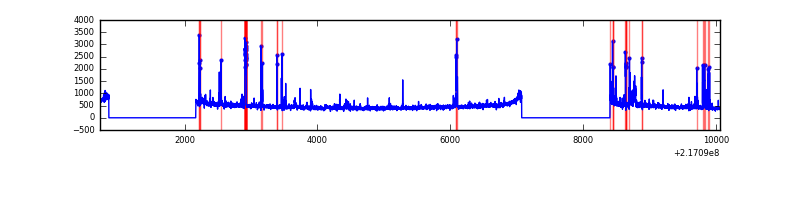 |
Top three noisy pixels from each quadrant. If the there are fewer than three noisy pixels in the level2.evt file, extra rows are filled as -1
| Pixel properties | Quadrant properties | ||||||
|---|---|---|---|---|---|---|---|
| Quadrant | DetID | PixID | Counts | Sigma | Mean | Median | Sigma |
| A | 8 | 15 | 129314 | 753.29 | 838 | 820 | 170.6 |
| A | 0 | 50 | 64316 | 372.24 | 838 | 820 | 170.6 |
| A | 14 | 111 | 23249 | 131.49 | 838 | 820 | 170.6 |
| B | 3 | 64 | 113448 | 703.25 | 846 | 827 | 160.1 |
| B | 0 | 219 | 33784 | 205.8 | 846 | 827 | 160.1 |
| B | 4 | 81 | 27343 | 165.58 | 846 | 827 | 160.1 |
| C | 12 | 16 | 11824 | 59.4 | 805 | 810 | 185.4 |
| C | 1 | 16 | 10977 | 54.83 | 805 | 810 | 185.4 |
| C | 13 | 61 | 6410 | 30.2 | 805 | 810 | 185.4 |
| D | 13 | 169 | 288721 | 1485.38 | 798 | 773 | 193.9 |
| D | 8 | 195 | 34016 | 171.48 | 798 | 773 | 193.9 |
| D | 12 | 110 | 33522 | 168.94 | 798 | 773 | 193.9 |
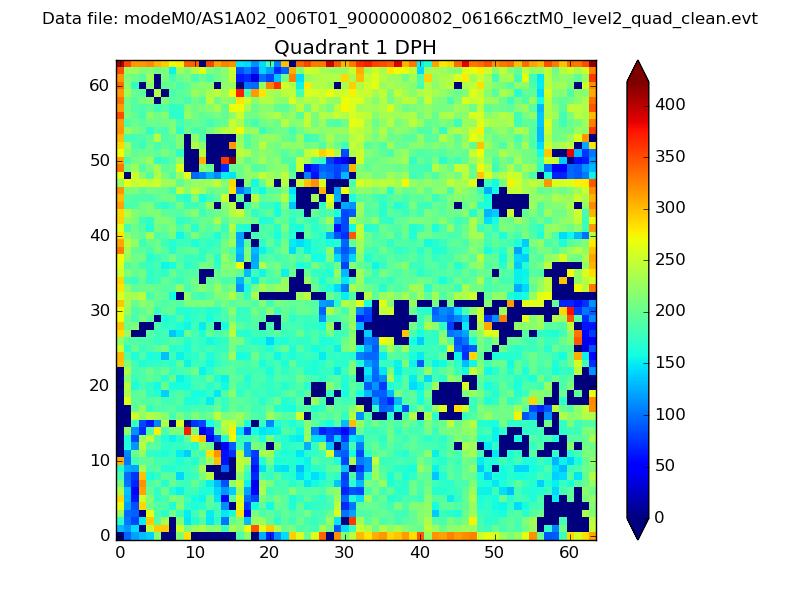
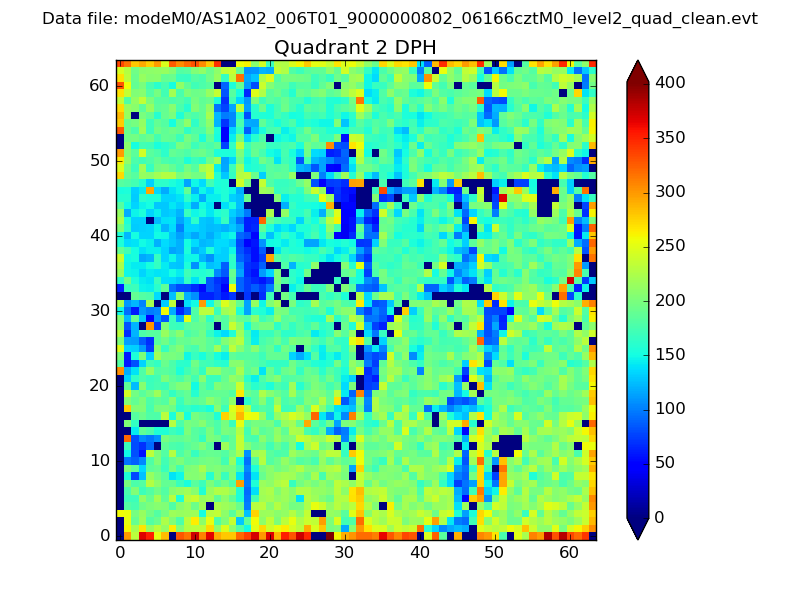
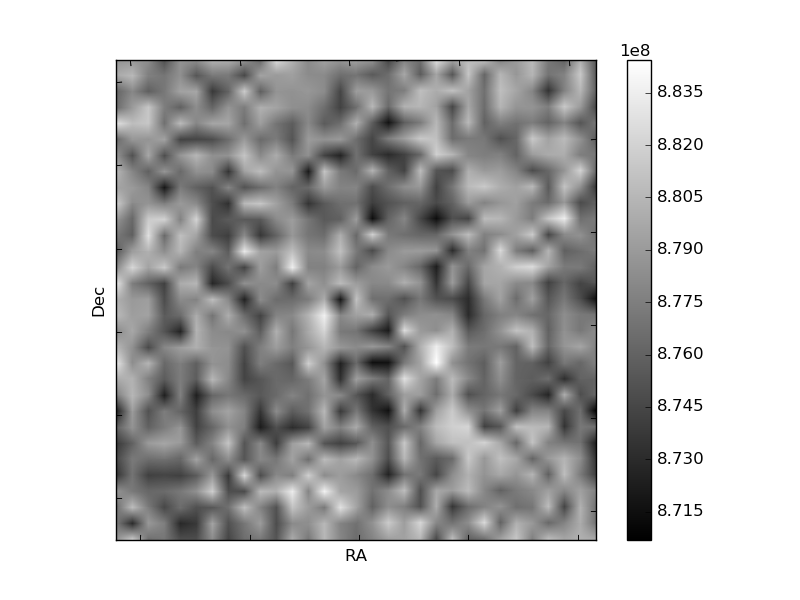
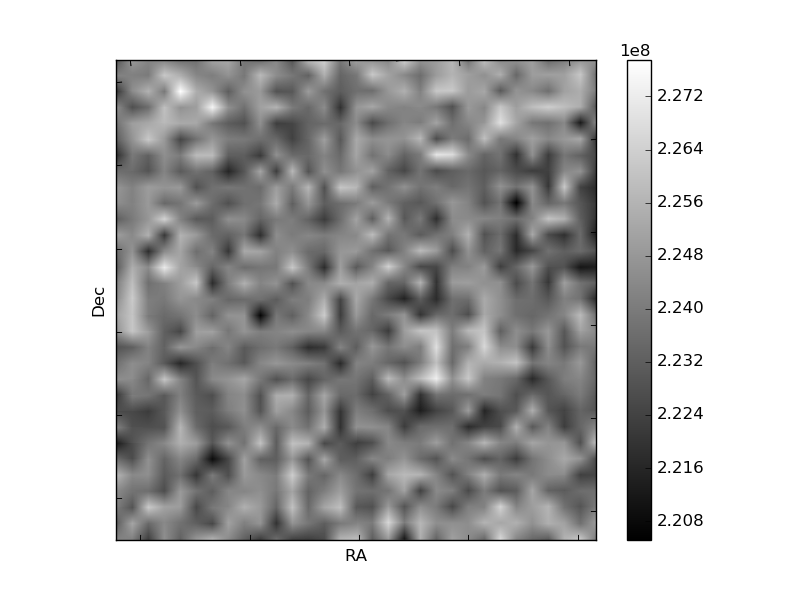
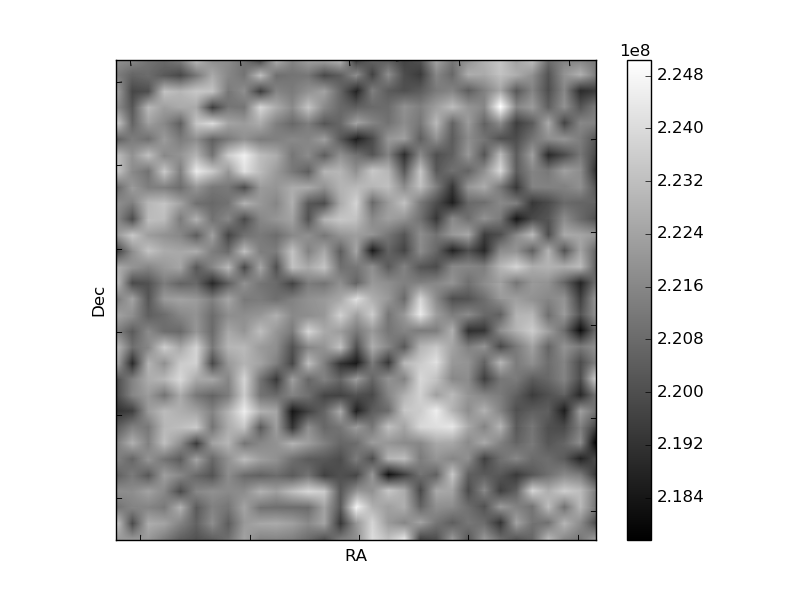
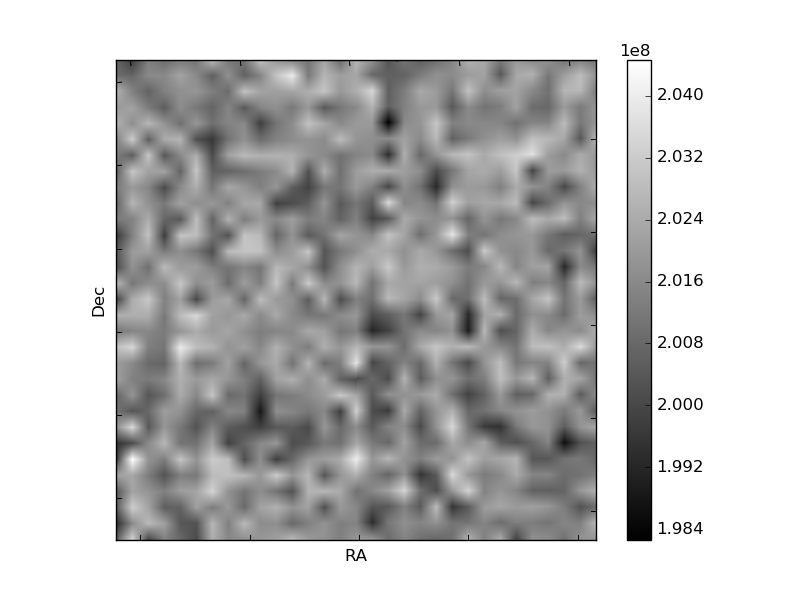
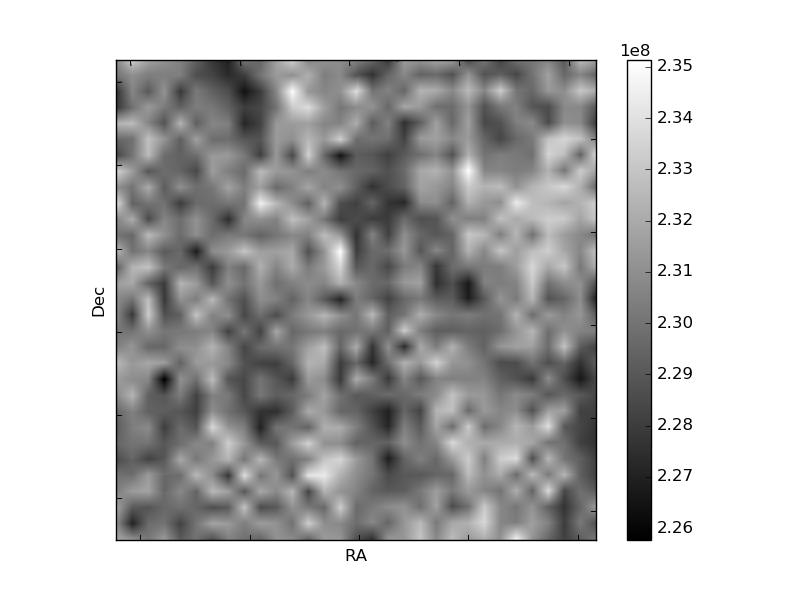
Histogram calculated using DETX and DETY for each event in the final _common_clean file
| Quadrant A |  |
 |
Quadrant B |
|---|---|---|---|
| Quadrant D | 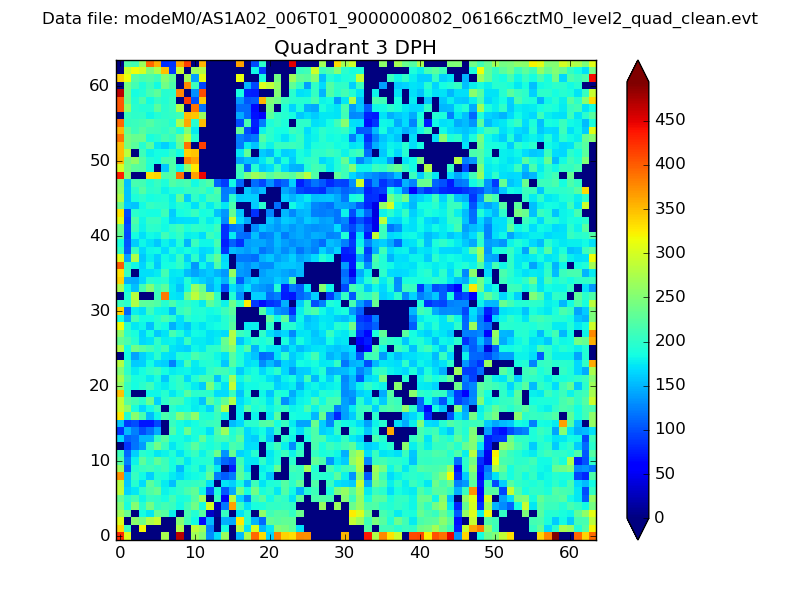 |
 |
Quadrant C |
| Plot type | Count rate plots | Images |
|---|---|---|
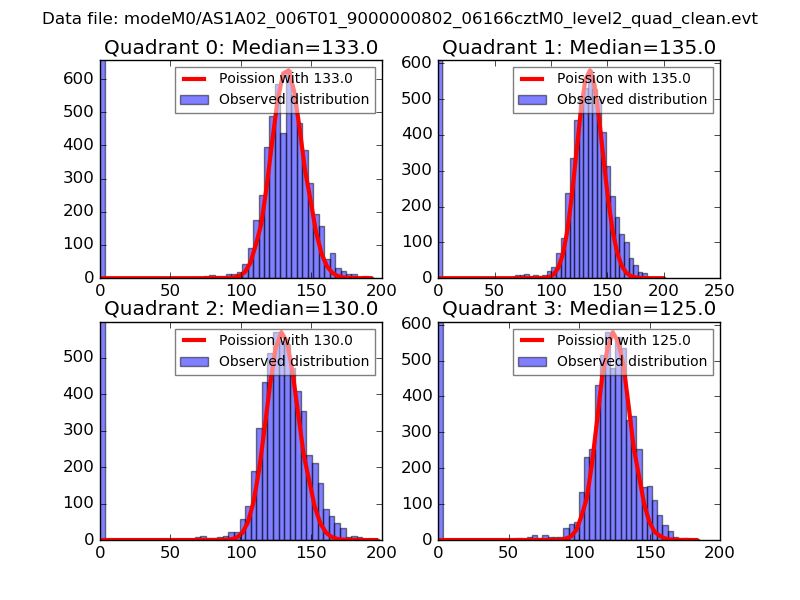
| Comparison with Poisson distribution Blue bars denote a histogram of data divided into 1 sec bins. Red curve is a Poisson curve with rate = median count rate of data. |
 |
 |
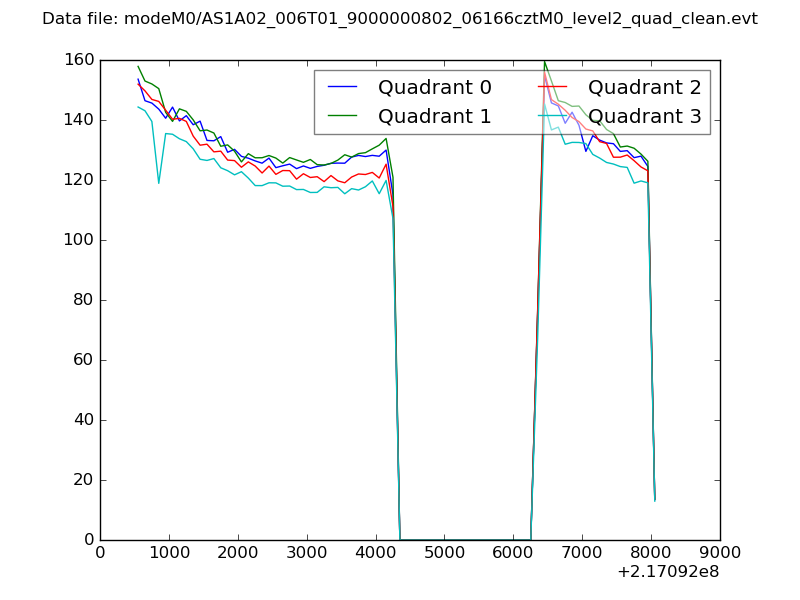
| Quadrant-wise count rates Data is divided into 100 sec bins |
 |
|
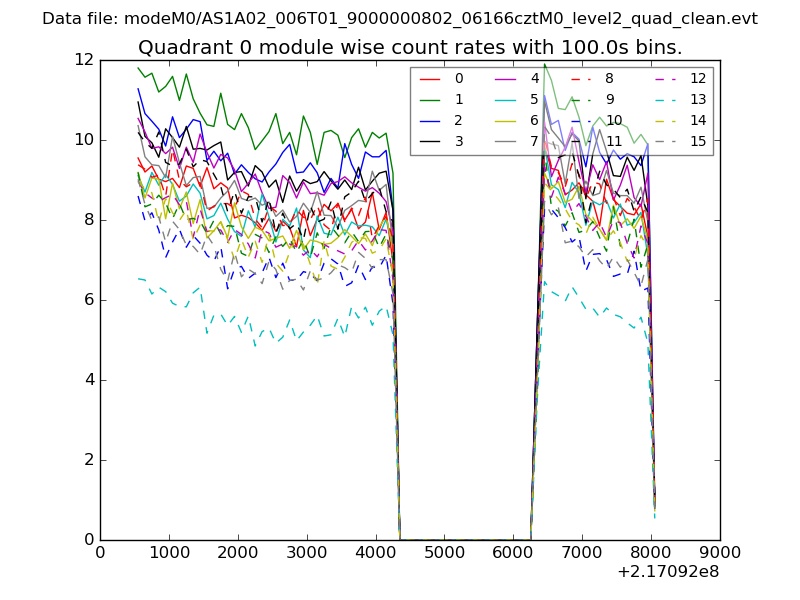
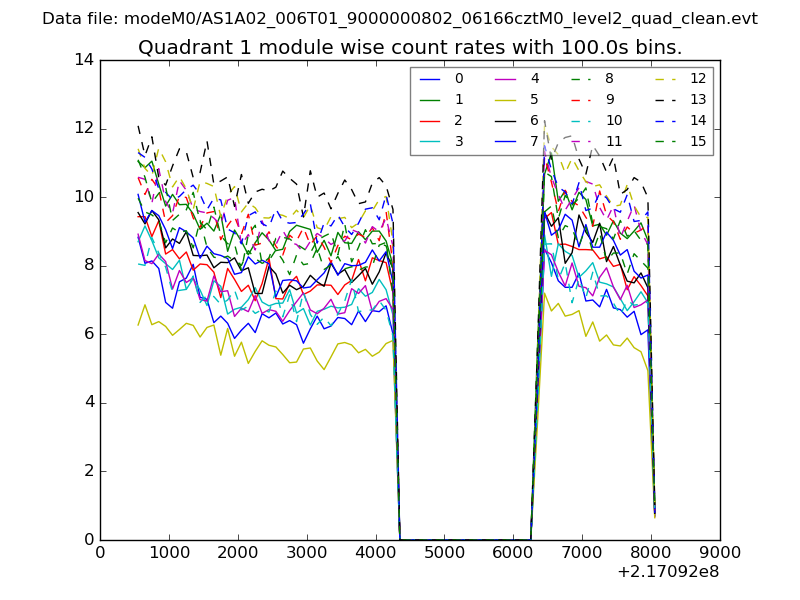
| Module-wise count rates for Quadrant A Data is divided into 100 sec bins |
 |
 |
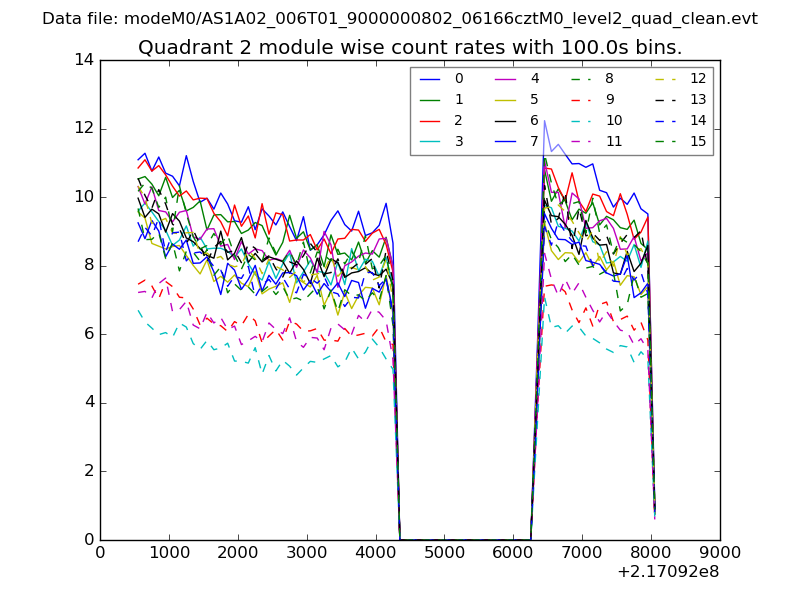
| Module-wise count rates for Quadrant B Data is divided into 100 sec bins |
 |
 |
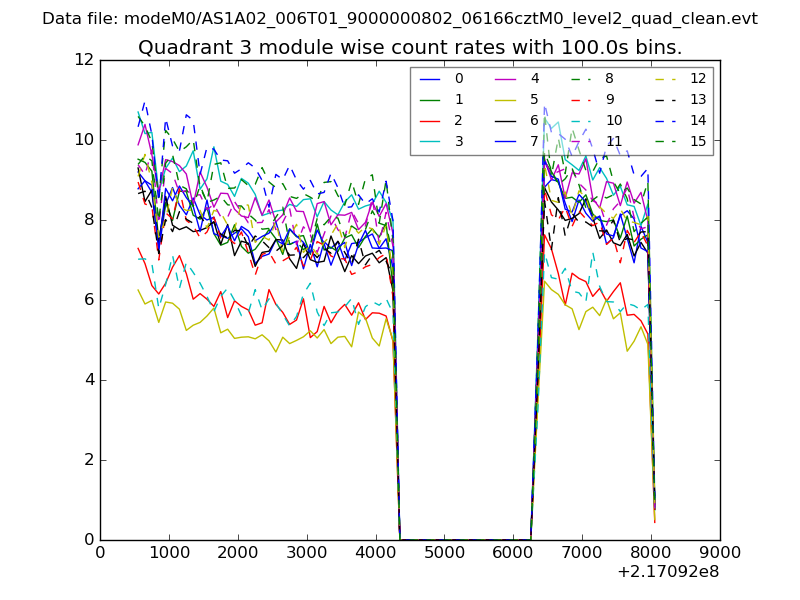
| Module-wise count rates for Quadrant C Data is divided into 100 sec bins |
 |
 |
| Module-wise count rates for Quadrant D Data is divided into 100 sec bins |
 |
 |
| Parameter | Plot |
|---|---|
| CZT HV Monitor | 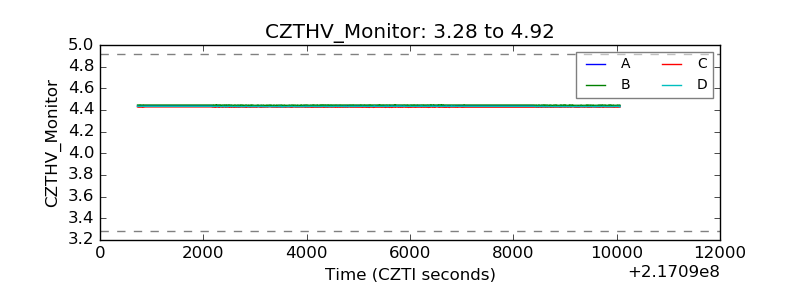 |
| D_VDD | 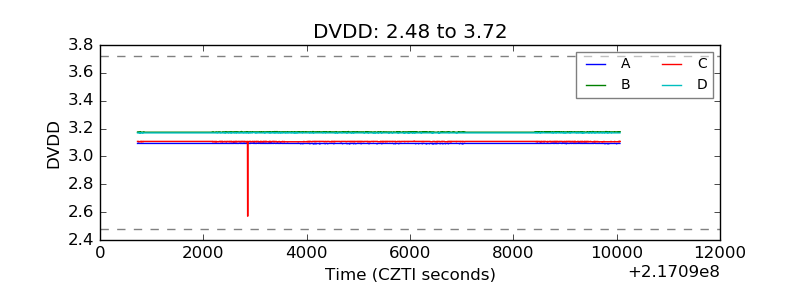 |
| Temperature 1 | 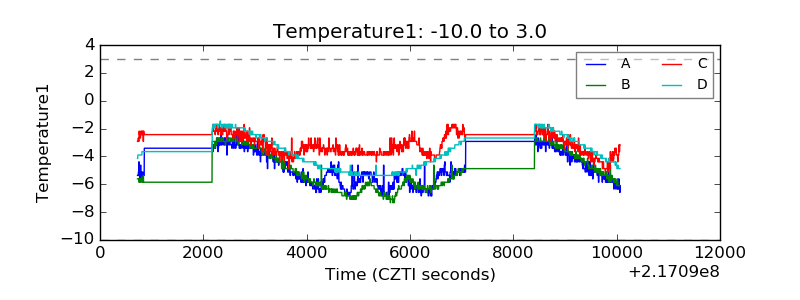 |
| Veto HV Monitor | 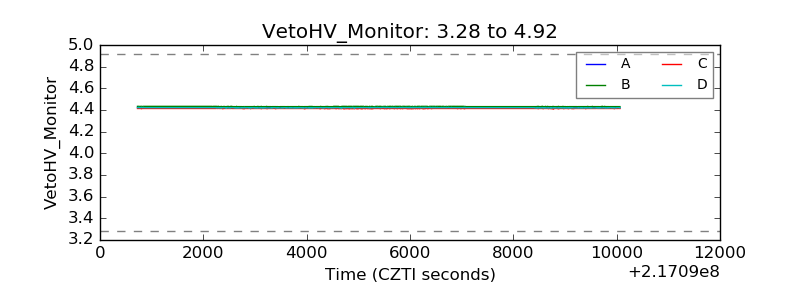 |
| Veto LLD | 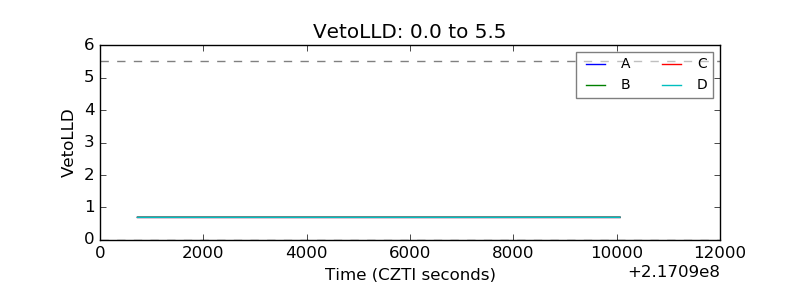 |
| Alpha Counter | 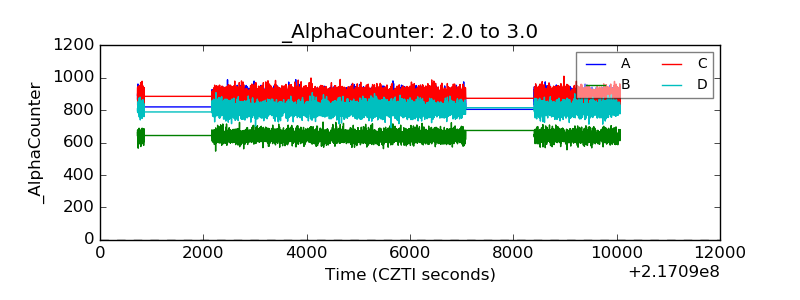 |
| _CPM_Rate | 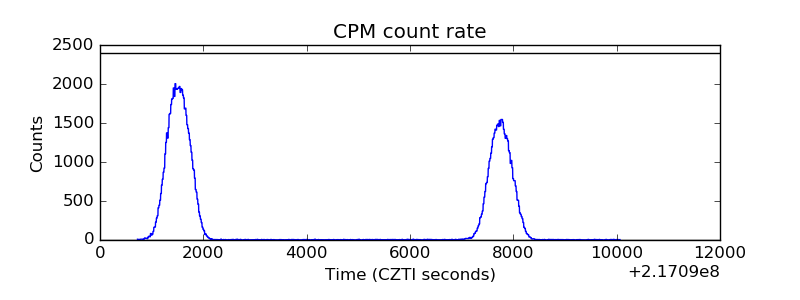 |
| CZT Counter | 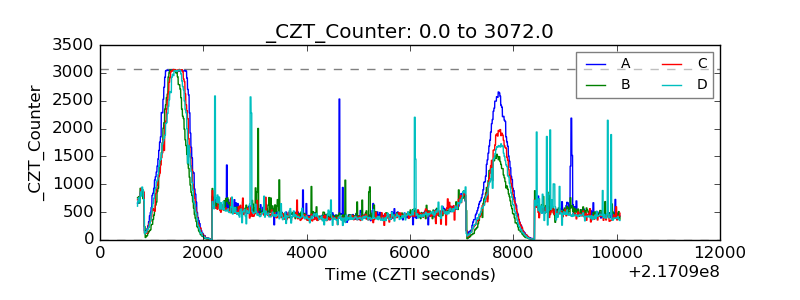 |
| +2.5 Volts monitor |  |
| +5 Volts monitor |  |
| _ROLL_ROT | 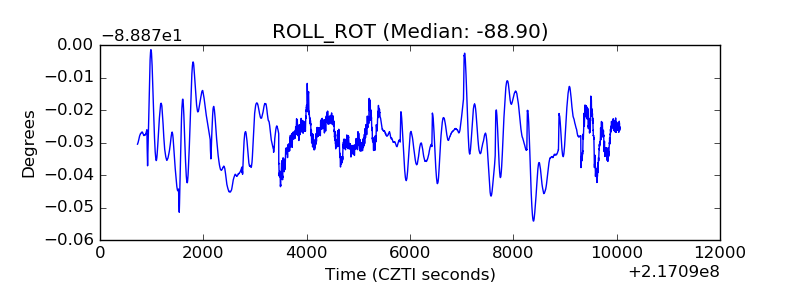 |
| _Roll_DEC | 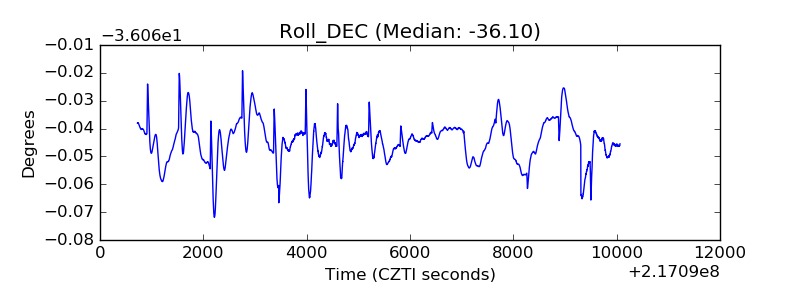 |
| _Roll_RA | 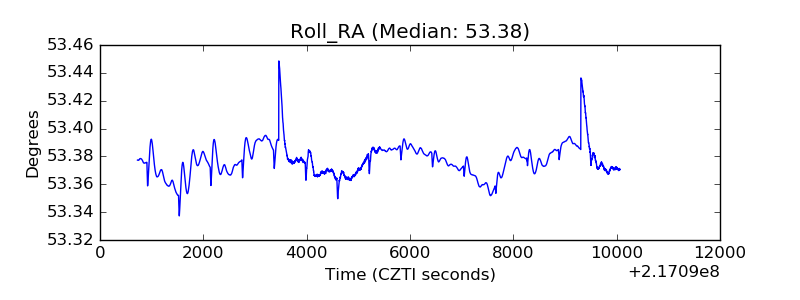 |
| Veto Counter | 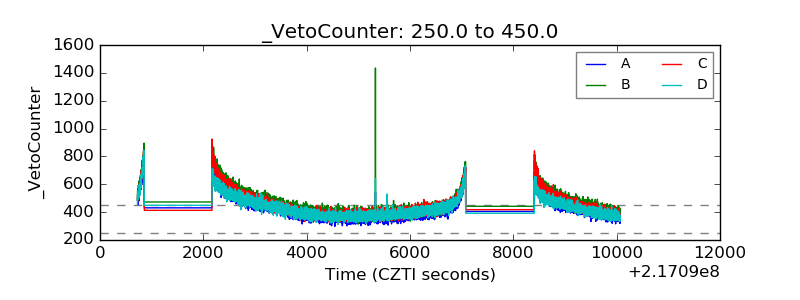 |