| Param | Original file | Final file |
|---|---|---|
| Filename | modeM0/AS1A02_006T01_9000000802_06167cztM0_level2.evt | modeM0/AS1A02_006T01_9000000802_06167cztM0_level2_quad_clean.evt |
| Size (bytes) | 455,806,080 | 105,422,400 |
| Size | 434.7 MB | 100.5 MB |
| Events in quadrant A | 3,467,192 | 687,485 |
| Events in quadrant B | 3,390,313 | 703,755 |
| Events in quadrant C | 3,203,937 | 677,189 |
| Events in quadrant D | 3,280,311 | 650,454 |
| Mode M0 | |||
|---|---|---|---|
| Quadrant | BADHDUFLAG | Total packets | Discarded packets |
| A | 0 | 14789 | 3 |
| B | 0 | 14619 | 2 |
| C | 0 | 14288 | 2 |
| D | 0 | 14770 | 2 |
| Mode SS | |||
|---|---|---|---|
| Quadrant | BADHDUFLAG | Total packets | Discarded packets |
| A | 0 | 140 | 0 |
| B | 0 | 140 | 0 |
| C | 0 | 140 | 0 |
| D | 0 | 140 | 0 |
| Mode M9 | |||
|---|---|---|---|
| Quadrant | BADHDUFLAG | Total packets | Discarded packets |
| A | 0 | 26 | 0 |
| B | 0 | 26 | 0 |
| C | 0 | 26 | 0 |
| D | 0 | 26 | 0 |
| Quadrant | Total seconds | Saturated seconds | Saturation percentage |
|---|---|---|---|
| A | 6800 | 149 | 2.191176% |
| B | 6800 | 129 | 1.897059% |
| C | 6800 | 61 | 0.897059% |
| D | 6800 | 100 | 1.470588% |
Noise dominated data is calculated using 1-second bins in cleaned event files. If a bin has >2000 counts, and if more than 50% of those come from <1% of pixels, then it is considered to be noise-dominated and hence unusable.
| Quadrant | # 1 sec bins | Bins with >0 counts | Bins with >2000 counts | High rate bins dominated by noise | Noise dominated (total time) | Noise dominated (detector-on time) | Marked lightcurve |
|---|---|---|---|---|---|---|---|
| A | 9345 | 6802 | 8 | 8 | 0.09% | 0.12% | 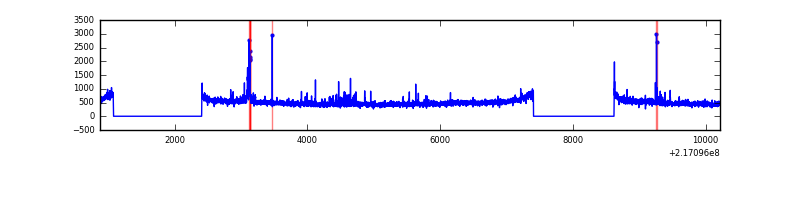 |
| B | 9345 | 6802 | 4 | 4 | 0.04% | 0.06% | 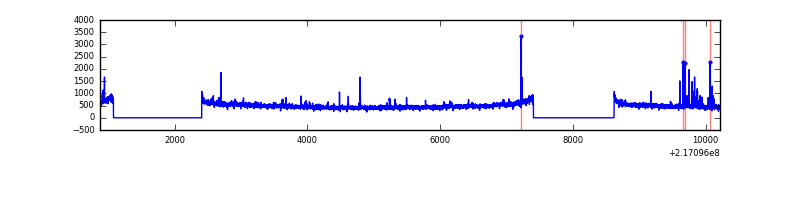 |
| C | 9345 | 6802 | 0 | 0 | 0.00% | 0.00% | 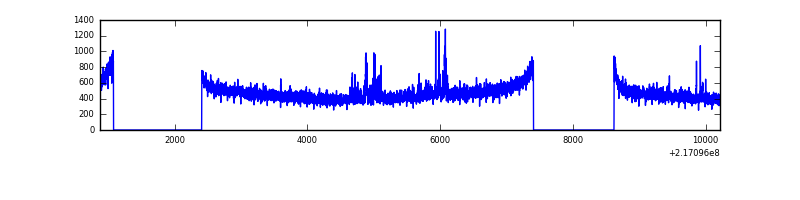 |
| D | 9345 | 6802 | 29 | 29 | 0.31% | 0.43% | 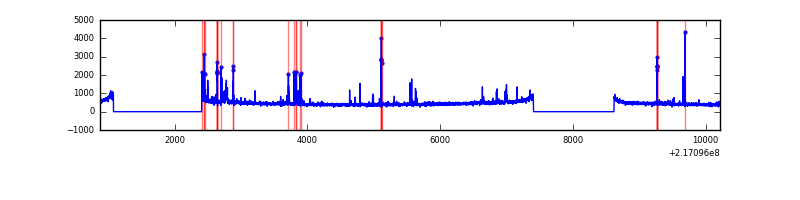 |
Top three noisy pixels from each quadrant. If the there are fewer than three noisy pixels in the level2.evt file, extra rows are filled as -1
| Pixel properties | Quadrant properties | ||||||
|---|---|---|---|---|---|---|---|
| Quadrant | DetID | PixID | Counts | Sigma | Mean | Median | Sigma |
| A | 8 | 15 | 207174 | 1230.93 | 824 | 807 | 167.7 |
| A | 0 | 50 | 64276 | 378.58 | 824 | 807 | 167.7 |
| A | 4 | 2 | 25193 | 145.46 | 824 | 807 | 167.7 |
| B | 0 | 219 | 47830 | 295.88 | 835 | 817 | 158.9 |
| B | 4 | 81 | 39423 | 242.97 | 835 | 817 | 158.9 |
| B | 3 | 64 | 36039 | 221.67 | 835 | 817 | 158.9 |
| C | 12 | 16 | 99263 | 532.43 | 794 | 797 | 184.9 |
| C | 1 | 16 | 6303 | 29.77 | 794 | 797 | 184.9 |
| C | 13 | 61 | 6222 | 29.33 | 794 | 797 | 184.9 |
| D | 13 | 169 | 128015 | 661.56 | 786 | 761 | 192.4 |
| D | 2 | 14 | 68471 | 352.0 | 786 | 761 | 192.4 |
| D | 5 | 97 | 42373 | 216.33 | 786 | 761 | 192.4 |
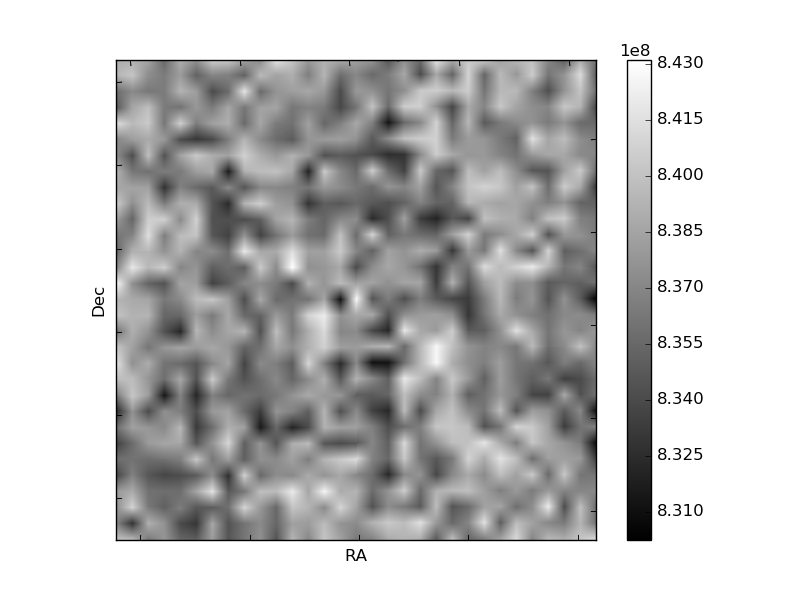
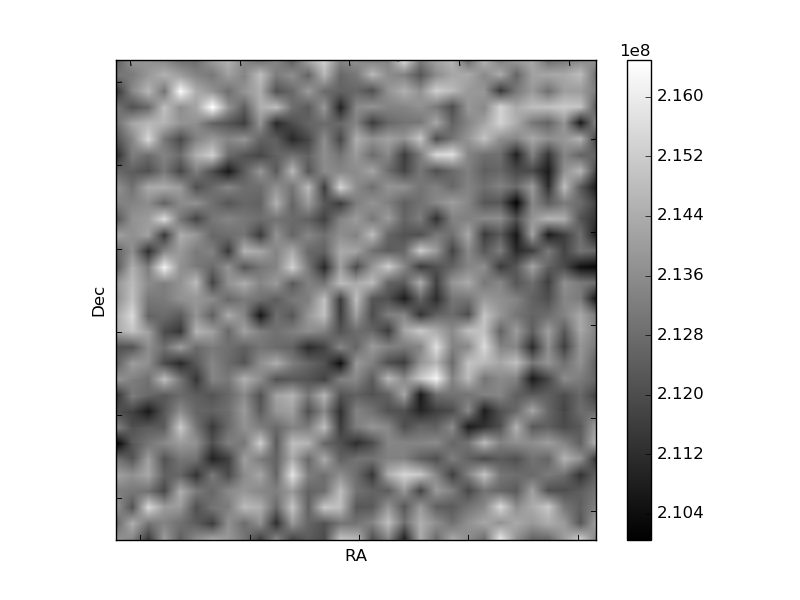
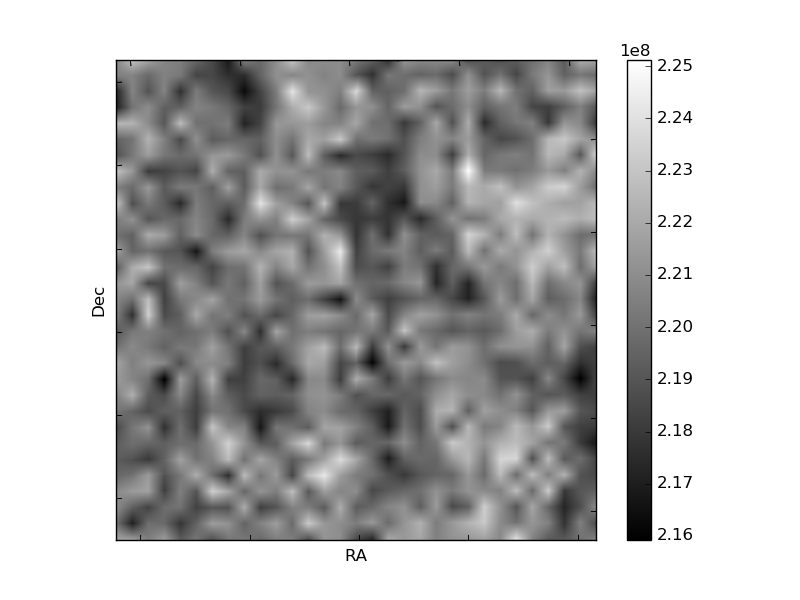
Histogram calculated using DETX and DETY for each event in the final _common_clean file
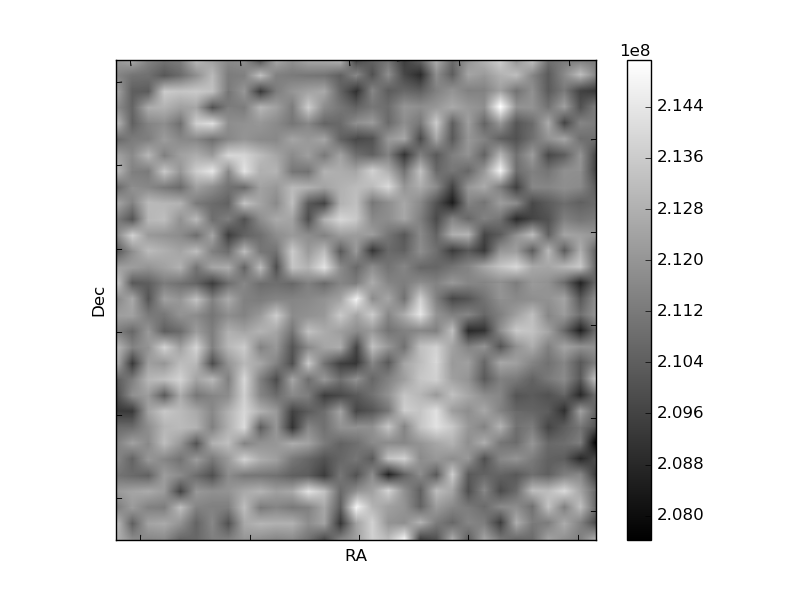
| Quadrant A | 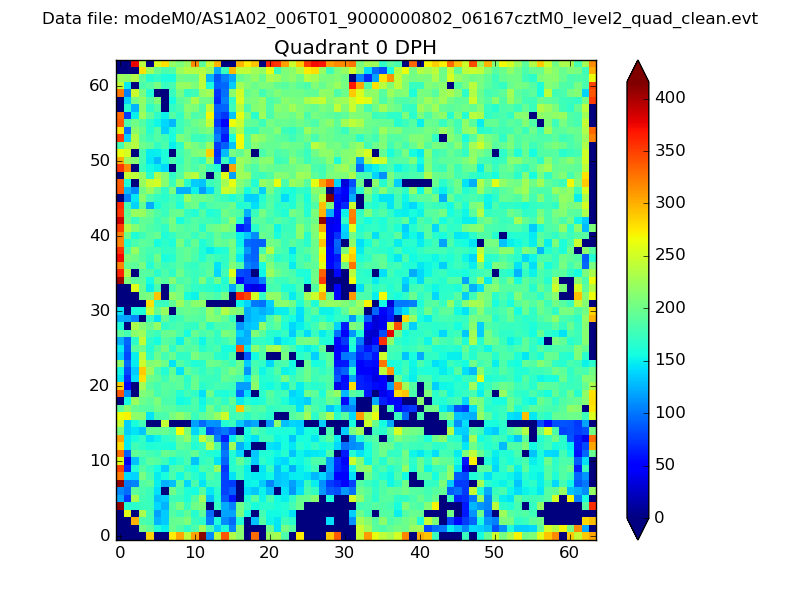 |
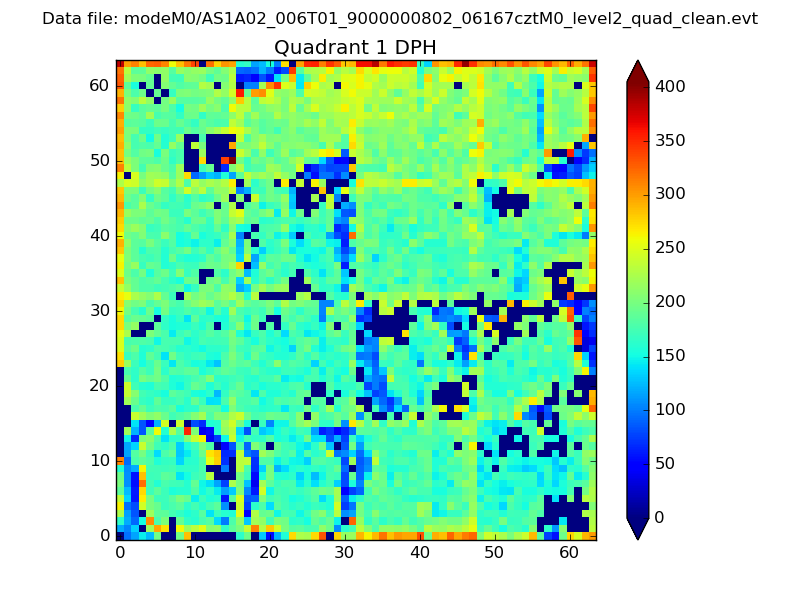 |
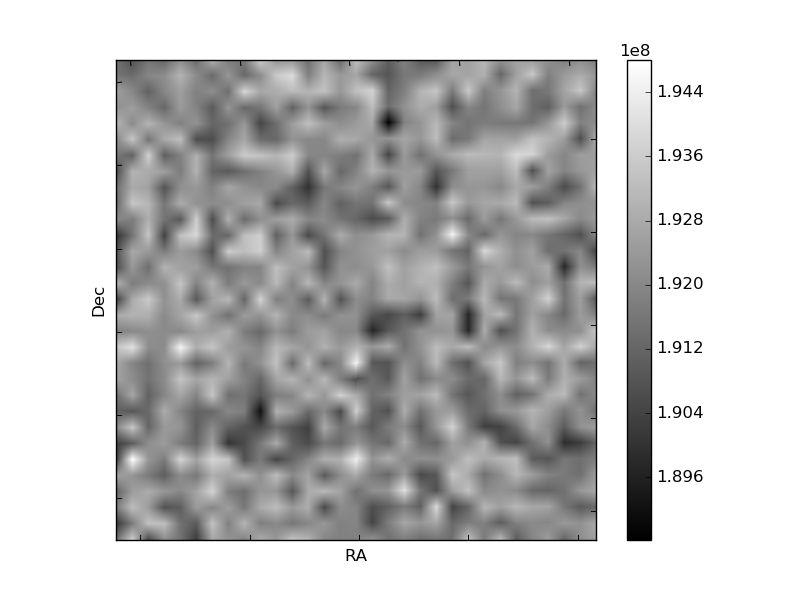
Quadrant B |
|---|---|---|---|
| Quadrant D | 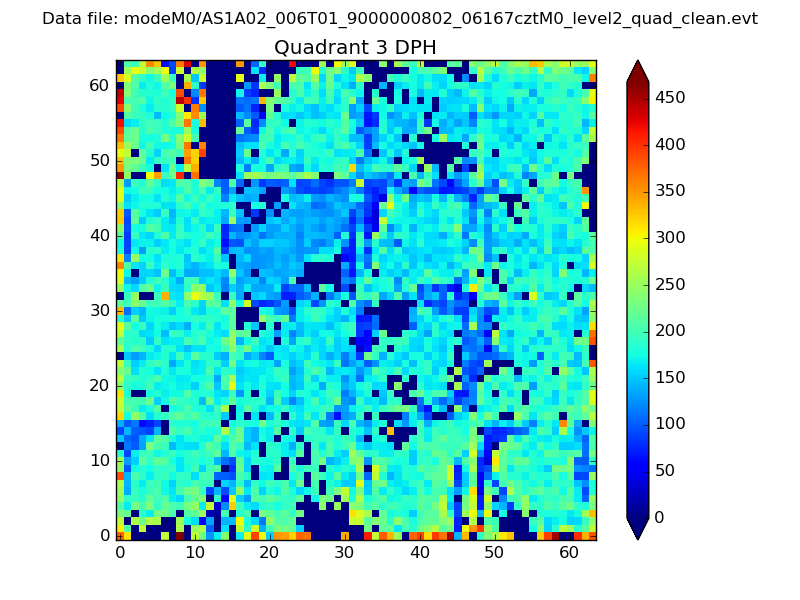 |
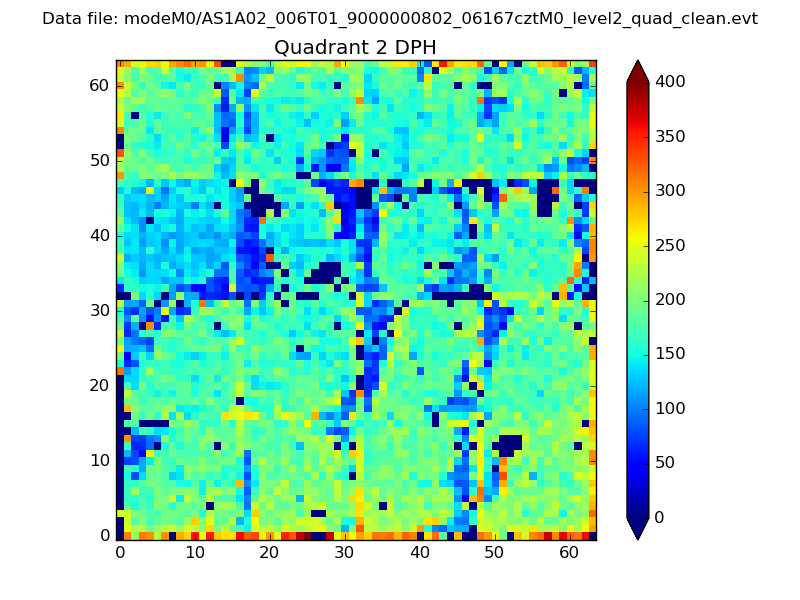 |
Quadrant C |
| Plot type | Count rate plots | Images |
|---|---|---|
| Comparison with Poisson distribution Blue bars denote a histogram of data divided into 1 sec bins. Red curve is a Poisson curve with rate = median count rate of data. |
 |
 |
| Quadrant-wise count rates Data is divided into 100 sec bins |
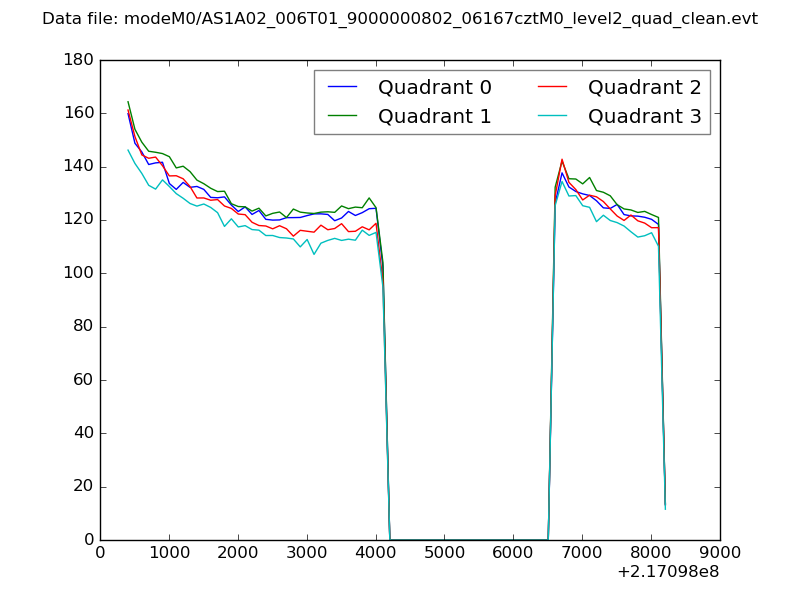 |
|
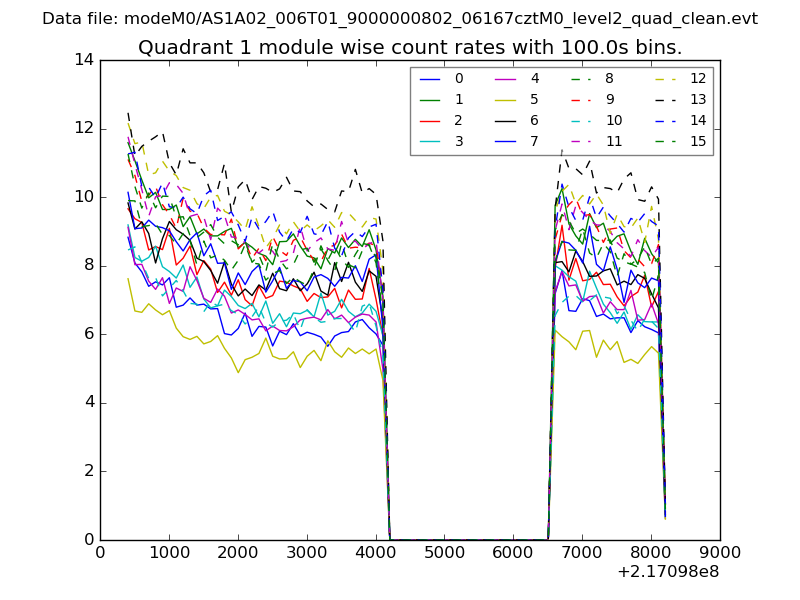
| Module-wise count rates for Quadrant A Data is divided into 100 sec bins |
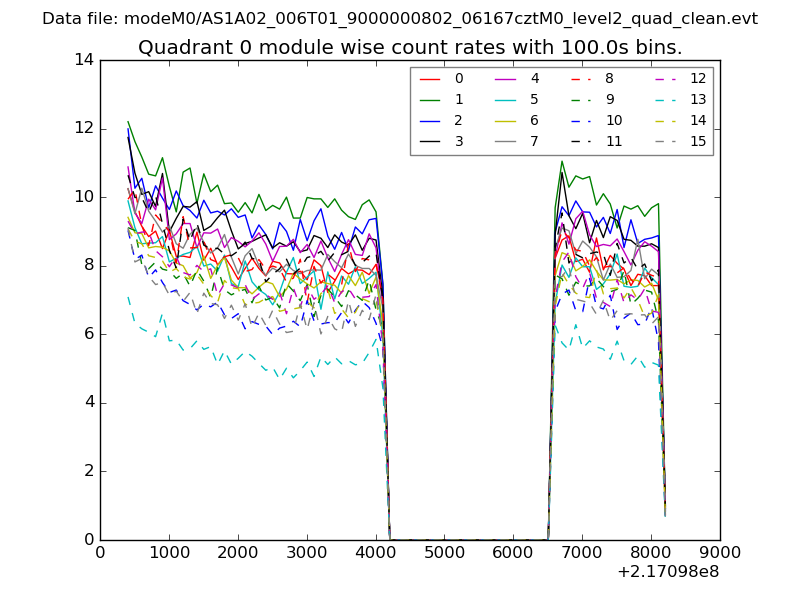 |
 |
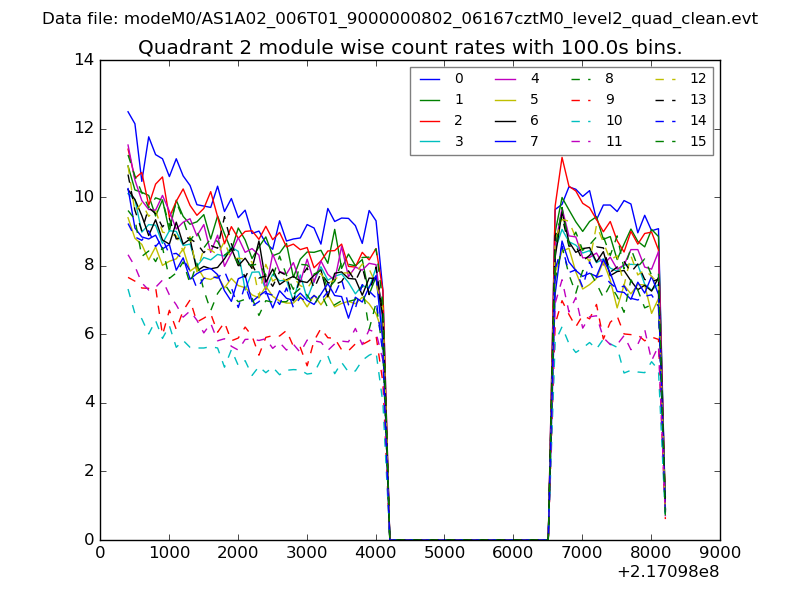
| Module-wise count rates for Quadrant B Data is divided into 100 sec bins |
 |
 |
| Module-wise count rates for Quadrant C Data is divided into 100 sec bins |
 |
 |
| Module-wise count rates for Quadrant D Data is divided into 100 sec bins |
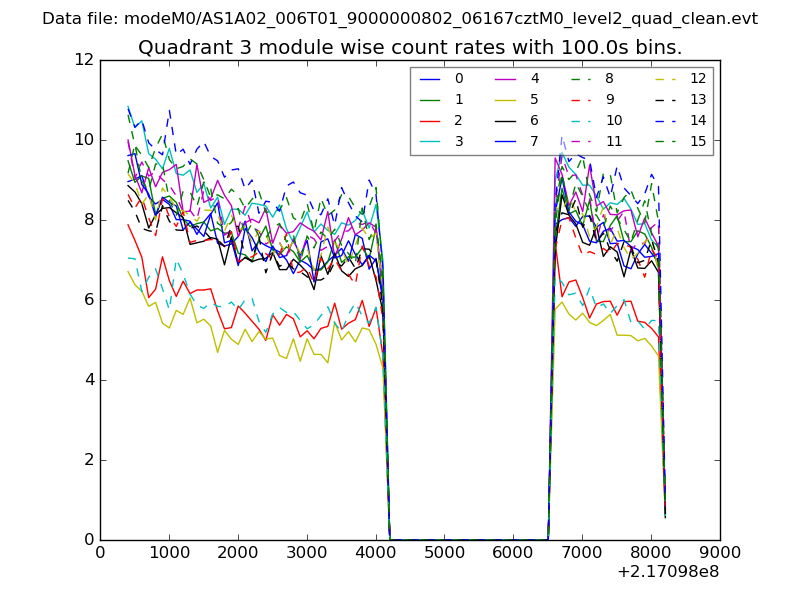 |
 |
| Parameter | Plot |
|---|---|
| CZT HV Monitor | 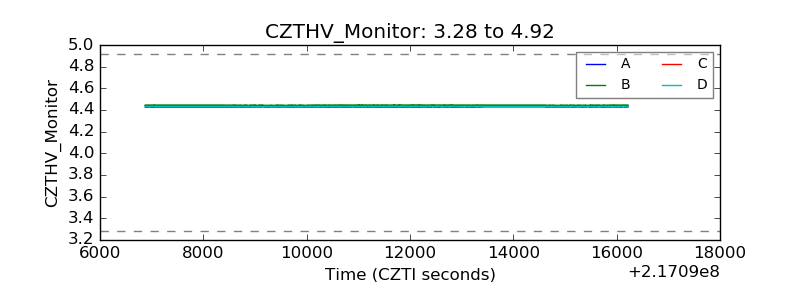 |
| D_VDD | 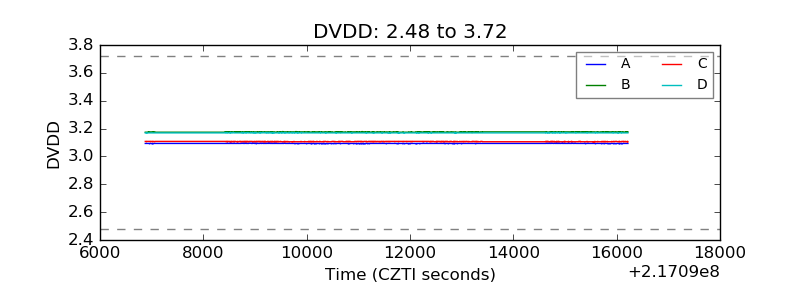 |
| Temperature 1 | 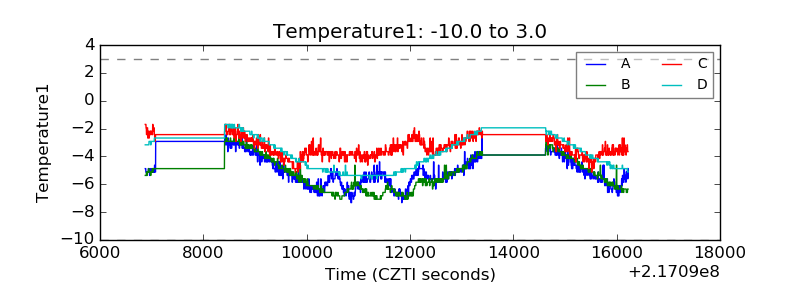 |
| Veto HV Monitor | 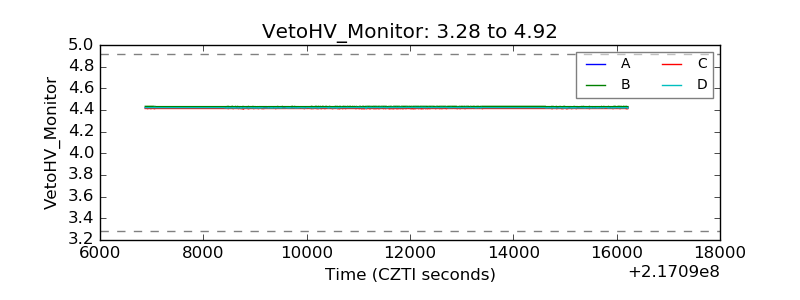 |
| Veto LLD | 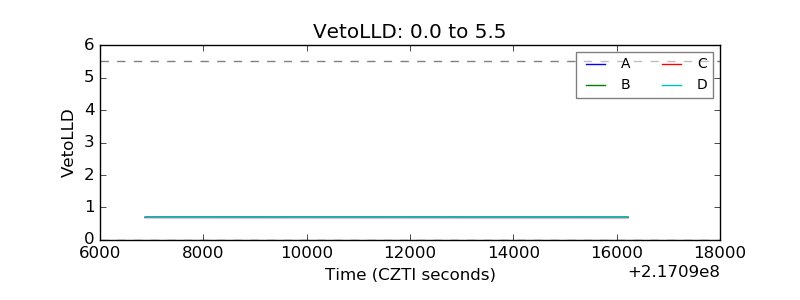 |
| Alpha Counter | 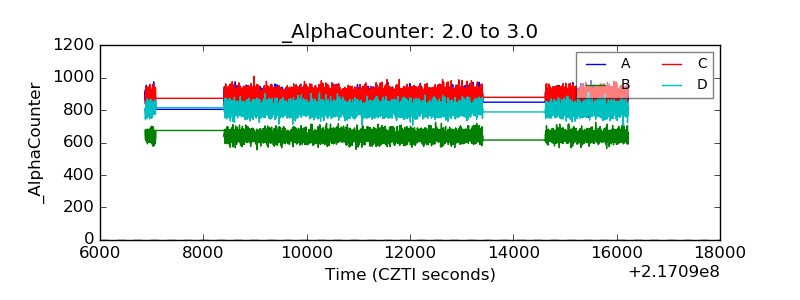 |
| _CPM_Rate | 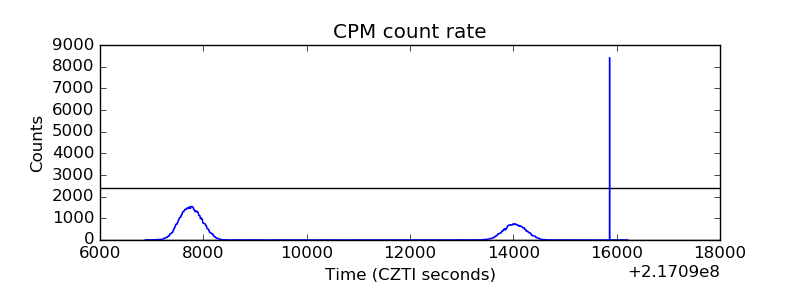 |
| CZT Counter | 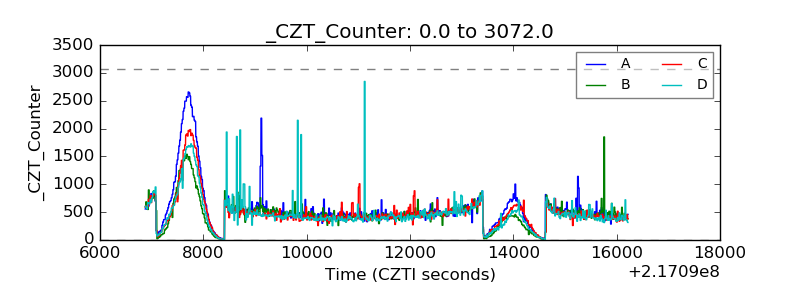 |
| +2.5 Volts monitor |  |
| +5 Volts monitor |  |
| _ROLL_ROT | 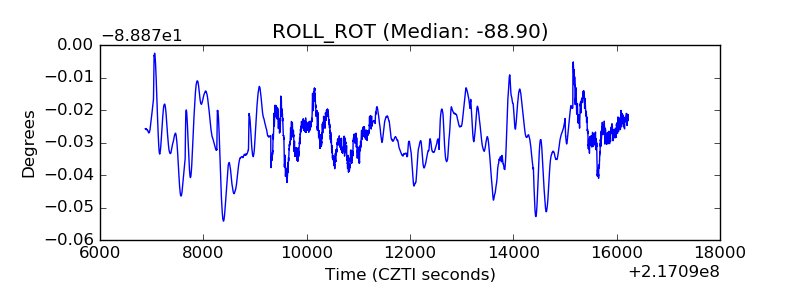 |
| _Roll_DEC |  |
| _Roll_RA | 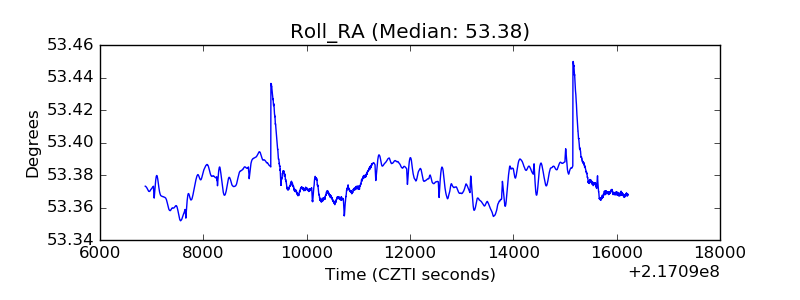 |
| Veto Counter | 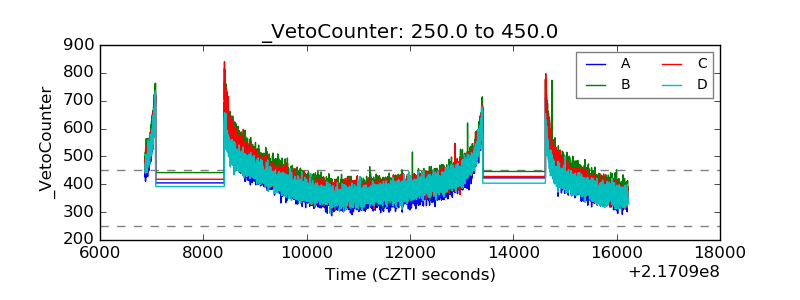 |