| Param | Original file | Final file |
|---|---|---|
| Filename | modeM0/AS1A02_006T01_9000000802_06168cztM0_level2.evt | modeM0/AS1A02_006T01_9000000802_06168cztM0_level2_quad_clean.evt |
| Size (bytes) | 478,681,920 | 95,857,920 |
| Size | 456.5 MB | 91.4 MB |
| Events in quadrant A | 3,680,615 | 606,007 |
| Events in quadrant B | 3,590,269 | 618,673 |
| Events in quadrant C | 3,325,758 | 597,710 |
| Events in quadrant D | 3,409,776 | 578,034 |
| Mode M0 | |||
|---|---|---|---|
| Quadrant | BADHDUFLAG | Total packets | Discarded packets |
| A | 0 | 15811 | 3 |
| B | 0 | 15548 | 2 |
| C | 0 | 15095 | 2 |
| D | 0 | 15552 | 2 |
| Mode SS | |||
|---|---|---|---|
| Quadrant | BADHDUFLAG | Total packets | Discarded packets |
| A | 0 | 148 | 0 |
| B | 0 | 148 | 0 |
| C | 0 | 148 | 0 |
| D | 0 | 148 | 0 |
| Mode M9 | |||
|---|---|---|---|
| Quadrant | BADHDUFLAG | Total packets | Discarded packets |
| A | 0 | 22 | 0 |
| B | 0 | 22 | 0 |
| C | 0 | 22 | 0 |
| D | 0 | 22 | 0 |
| Quadrant | Total seconds | Saturated seconds | Saturation percentage |
|---|---|---|---|
| A | 7220 | 95 | 1.315789% |
| B | 7220 | 75 | 1.038781% |
| C | 7220 | 20 | 0.277008% |
| D | 7220 | 59 | 0.817175% |
Noise dominated data is calculated using 1-second bins in cleaned event files. If a bin has >2000 counts, and if more than 50% of those come from <1% of pixels, then it is considered to be noise-dominated and hence unusable.
| Quadrant | # 1 sec bins | Bins with >0 counts | Bins with >2000 counts | High rate bins dominated by noise | Noise dominated (total time) | Noise dominated (detector-on time) | Marked lightcurve |
|---|---|---|---|---|---|---|---|
| A | 9415 | 7222 | 11 | 11 | 0.12% | 0.15% | 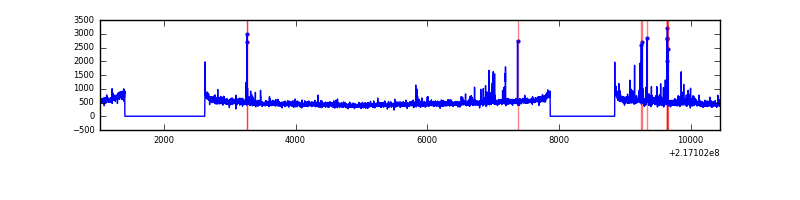 |
| B | 9415 | 7222 | 7 | 7 | 0.07% | 0.10% | 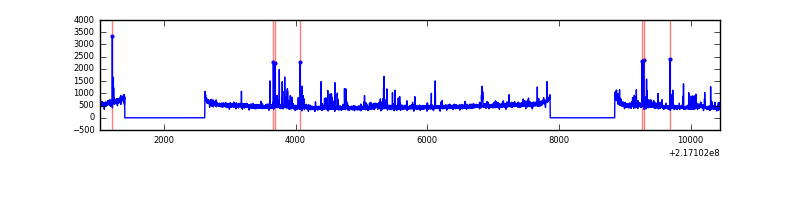 |
| C | 9415 | 7222 | 4 | 4 | 0.04% | 0.06% | 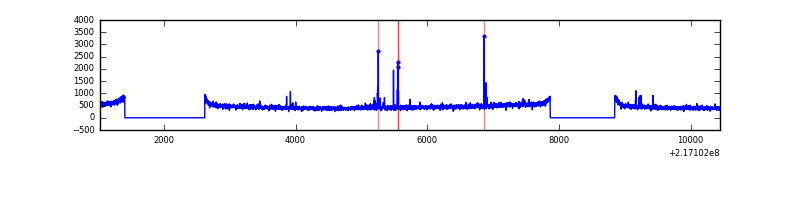 |
| D | 9415 | 7222 | 33 | 33 | 0.35% | 0.46% | 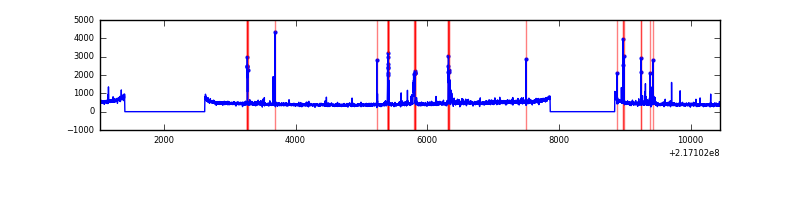 |
Top three noisy pixels from each quadrant. If the there are fewer than three noisy pixels in the level2.evt file, extra rows are filled as -1
| Pixel properties | Quadrant properties | ||||||
|---|---|---|---|---|---|---|---|
| Quadrant | DetID | PixID | Counts | Sigma | Mean | Median | Sigma |
| A | 8 | 15 | 276446 | 1589.58 | 852 | 832 | 173.4 |
| A | 4 | 2 | 122096 | 699.38 | 852 | 832 | 173.4 |
| A | 0 | 226 | 8187 | 42.42 | 852 | 832 | 173.4 |
| B | 0 | 219 | 126324 | 753.66 | 865 | 843 | 166.5 |
| B | 4 | 81 | 46283 | 272.92 | 865 | 843 | 166.5 |
| B | 3 | 64 | 26564 | 154.48 | 865 | 843 | 166.5 |
| C | 12 | 16 | 85752 | 441.43 | 825 | 827 | 192.4 |
| C | 1 | 16 | 14237 | 69.7 | 825 | 827 | 192.4 |
| C | 13 | 61 | 6505 | 29.51 | 825 | 827 | 192.4 |
| D | 2 | 14 | 107680 | 526.13 | 819 | 792 | 203.2 |
| D | 12 | 110 | 56101 | 272.24 | 819 | 792 | 203.2 |
| D | 2 | 206 | 55898 | 271.25 | 819 | 792 | 203.2 |
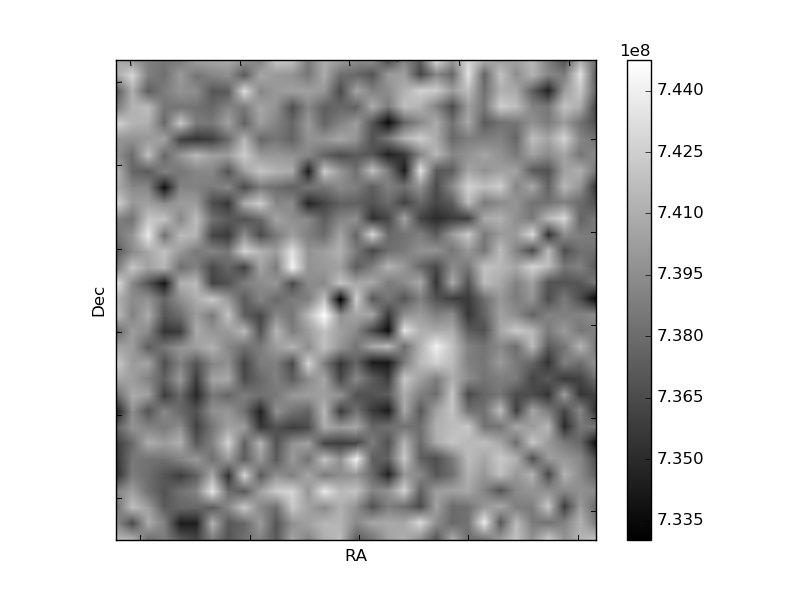
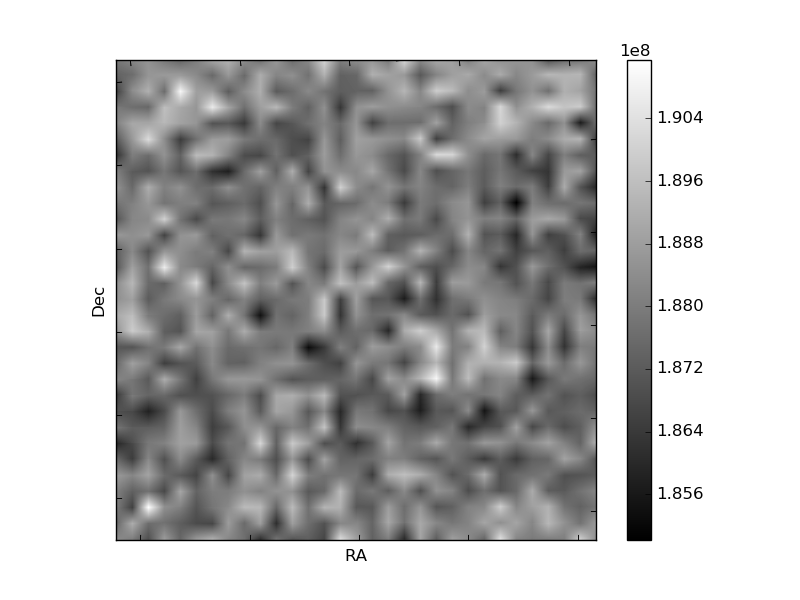
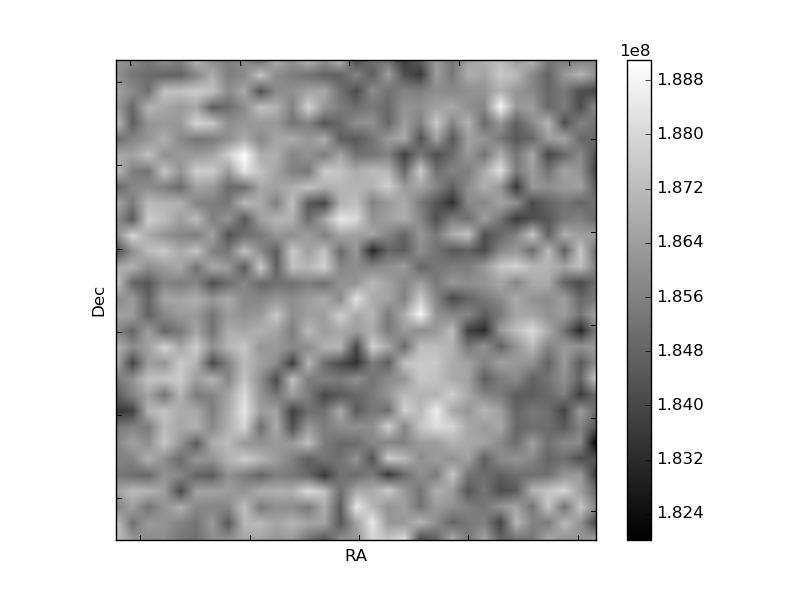
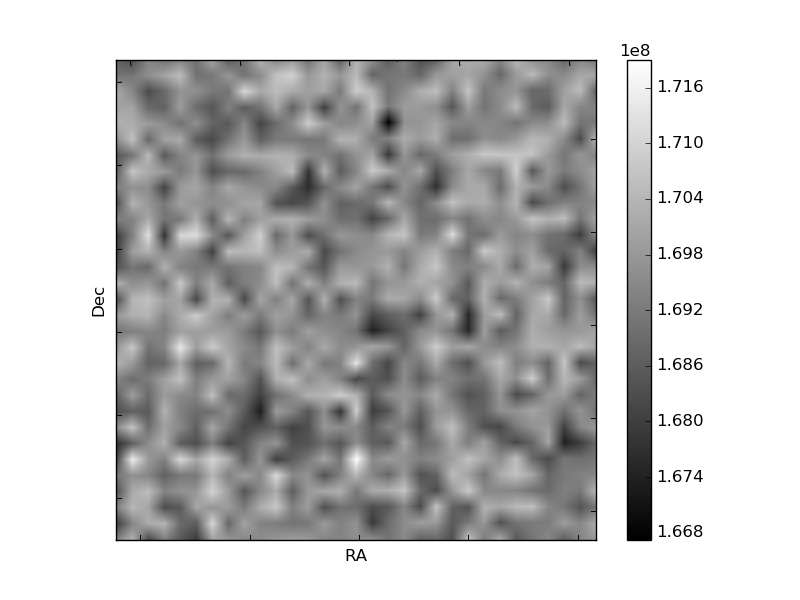
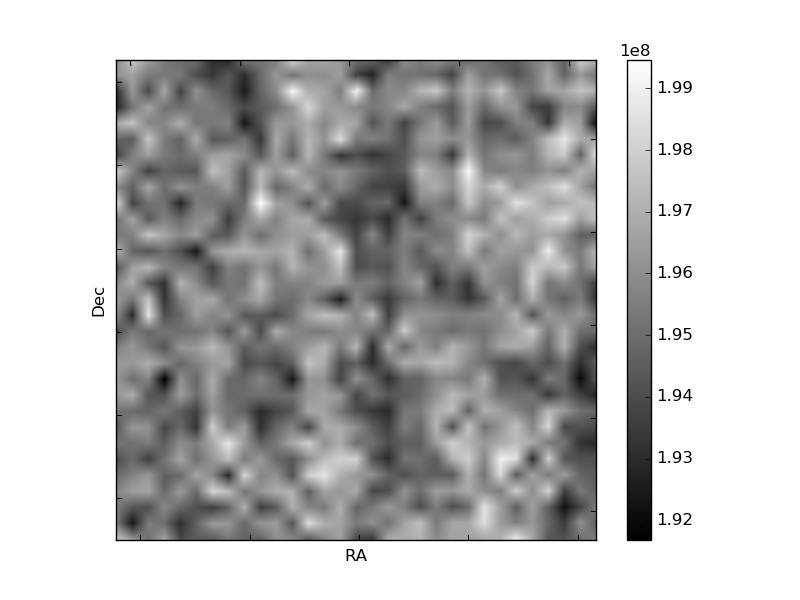
Histogram calculated using DETX and DETY for each event in the final _common_clean file
| Quadrant A | 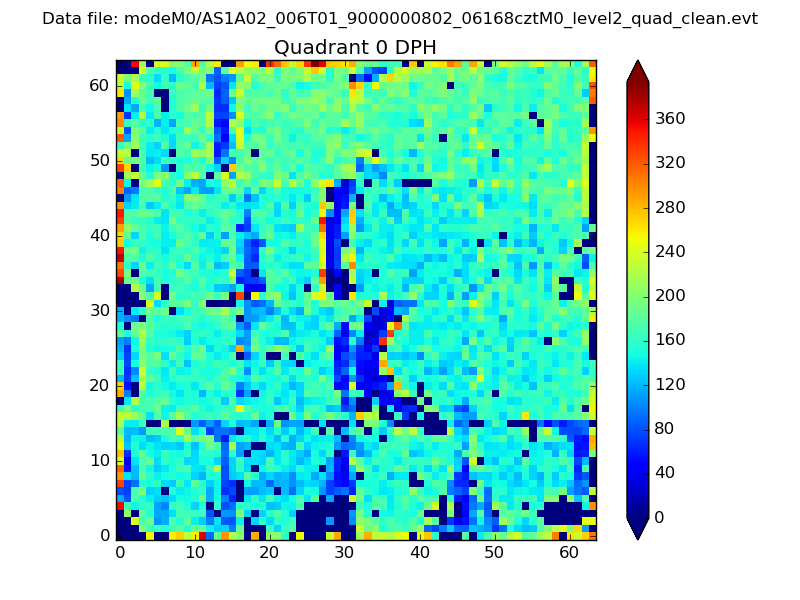 |
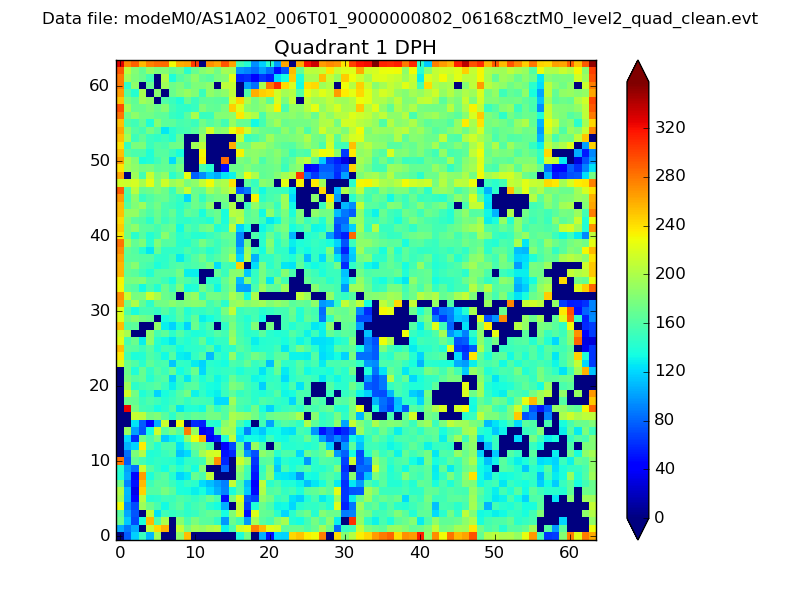 |
Quadrant B |
|---|---|---|---|
| Quadrant D | 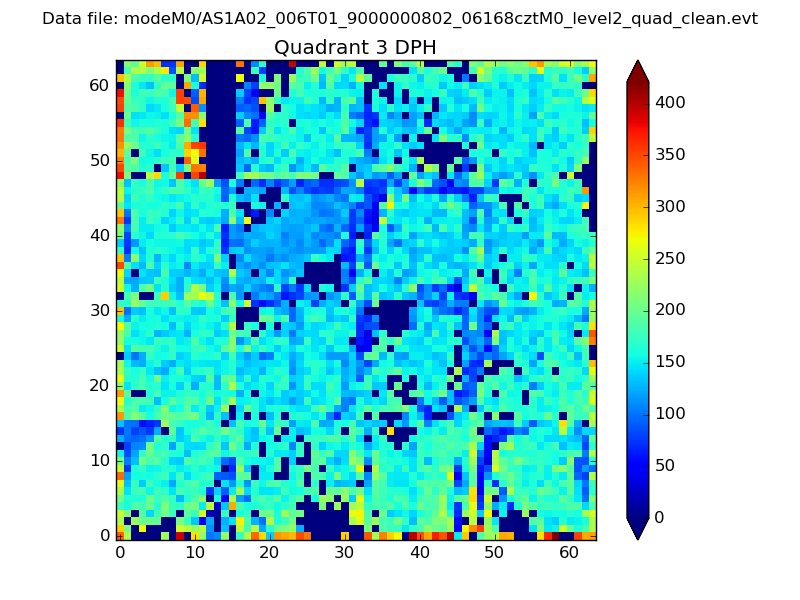 |
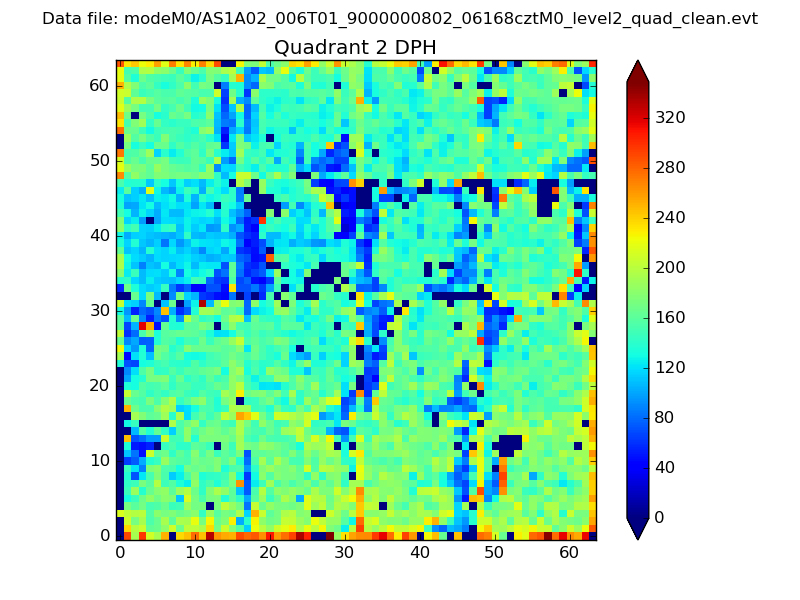 |
Quadrant C |
| Plot type | Count rate plots | Images |
|---|---|---|
| Comparison with Poisson distribution Blue bars denote a histogram of data divided into 1 sec bins. Red curve is a Poisson curve with rate = median count rate of data. |
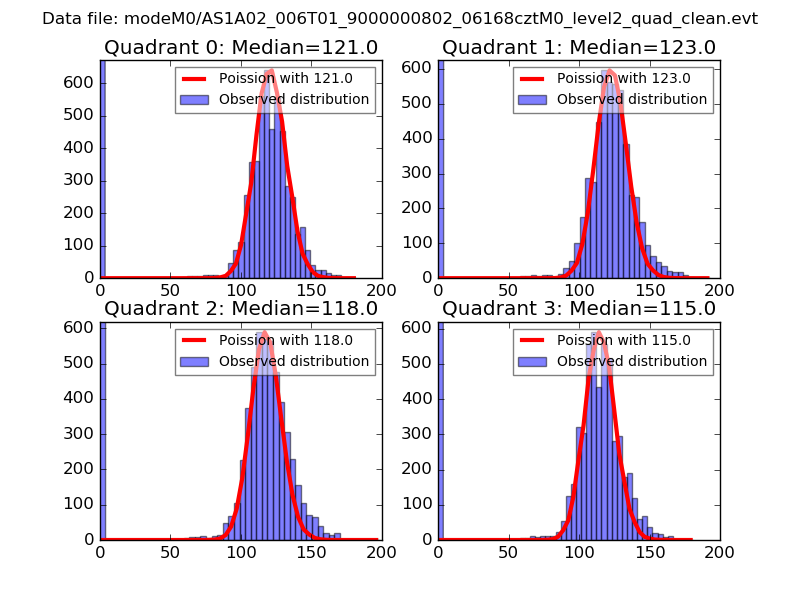 |
 |
| Quadrant-wise count rates Data is divided into 100 sec bins |
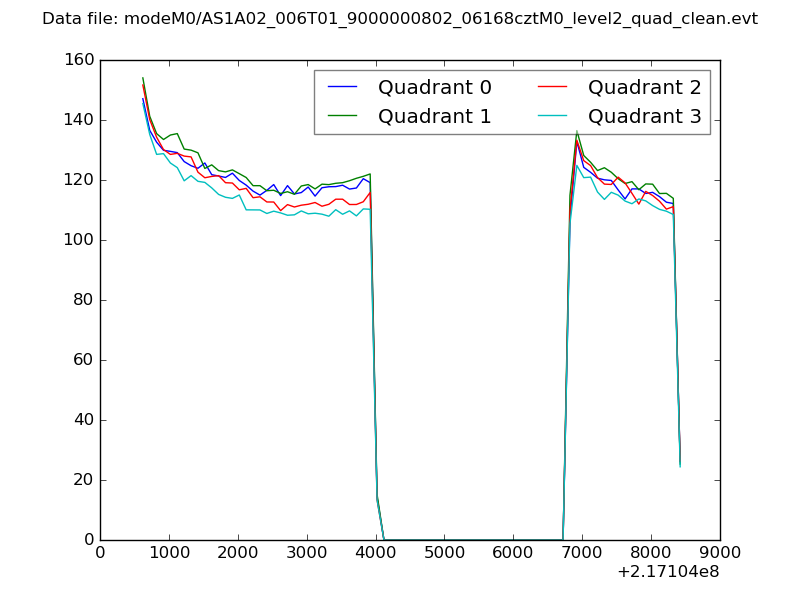 |
|
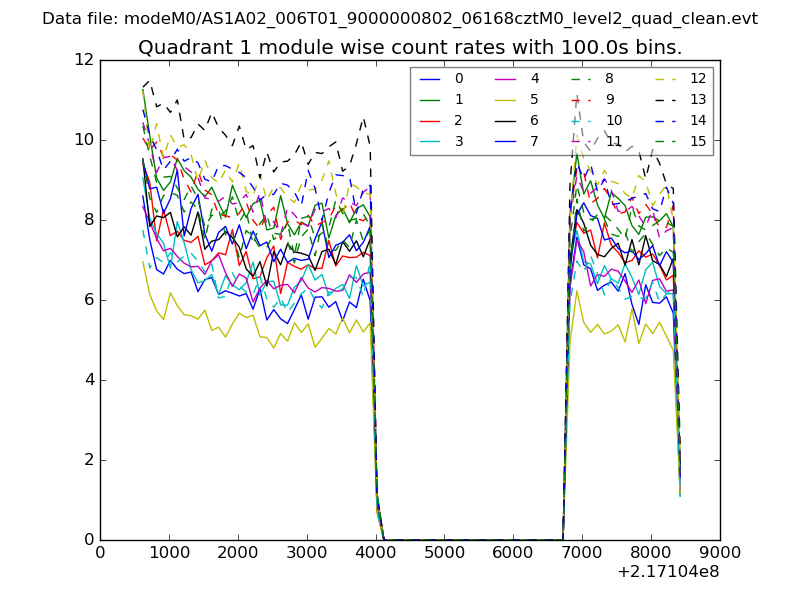
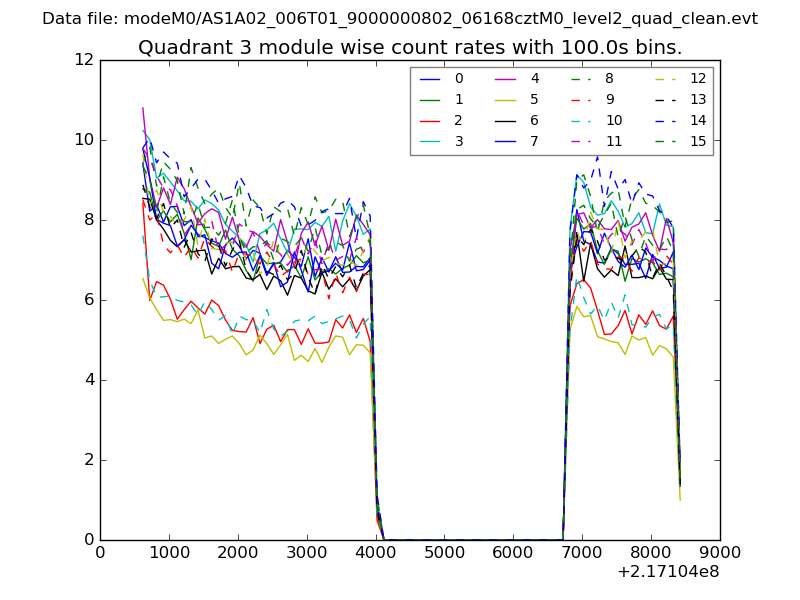
| Module-wise count rates for Quadrant A Data is divided into 100 sec bins |
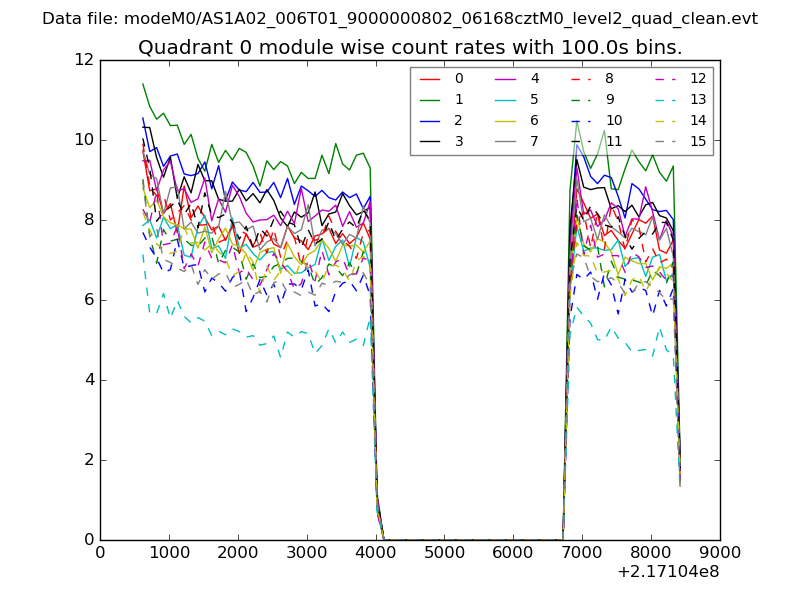 |
 |
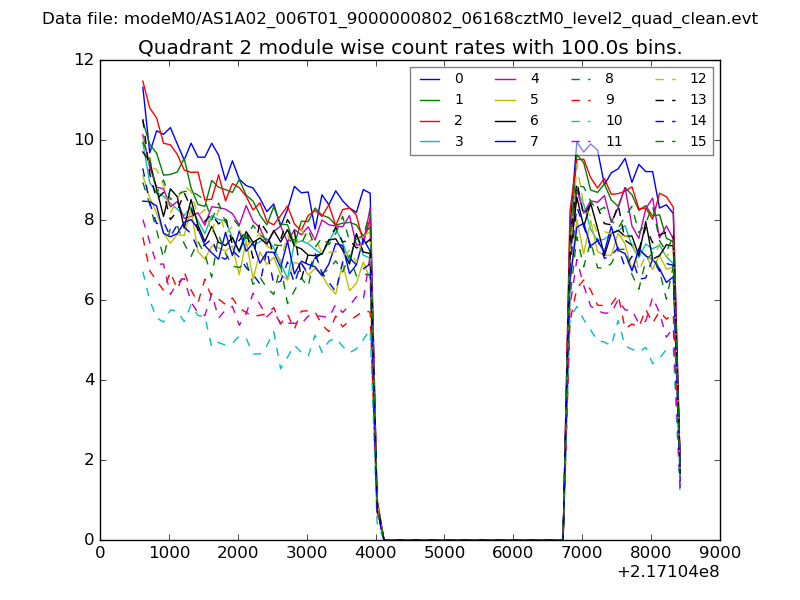
| Module-wise count rates for Quadrant B Data is divided into 100 sec bins |
 |
 |
| Module-wise count rates for Quadrant C Data is divided into 100 sec bins |
 |
 |
| Module-wise count rates for Quadrant D Data is divided into 100 sec bins |
 |
 |
| Parameter | Plot |
|---|---|
| CZT HV Monitor | 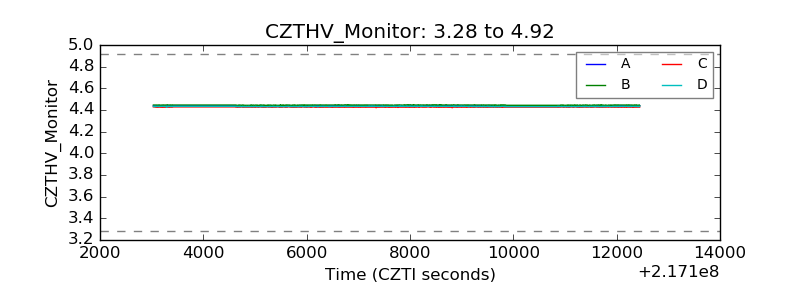 |
| D_VDD | 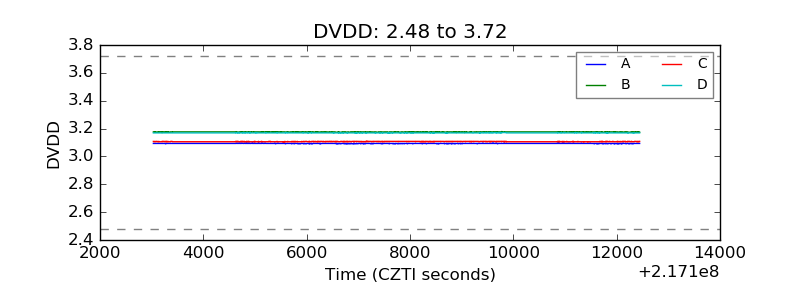 |
| Temperature 1 | 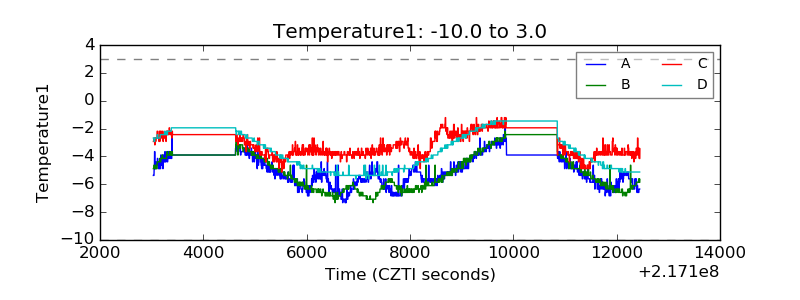 |
| Veto HV Monitor | 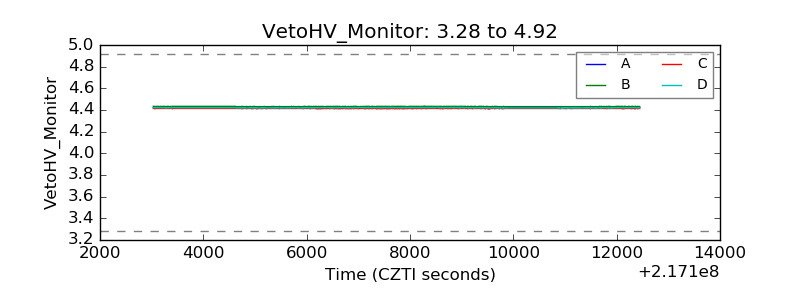 |
| Veto LLD | 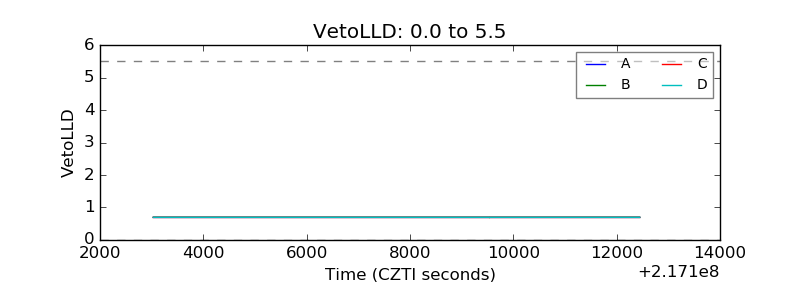 |
| Alpha Counter | 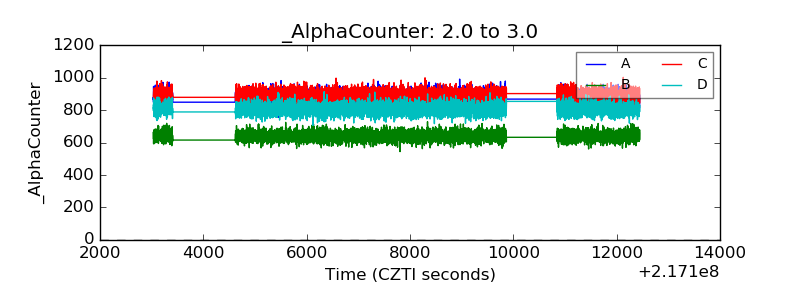 |
| _CPM_Rate | 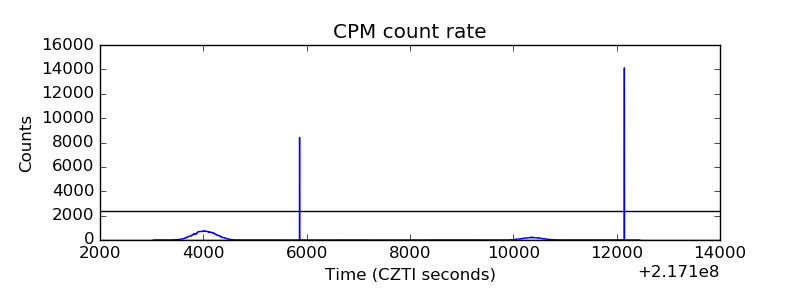 |
| CZT Counter | 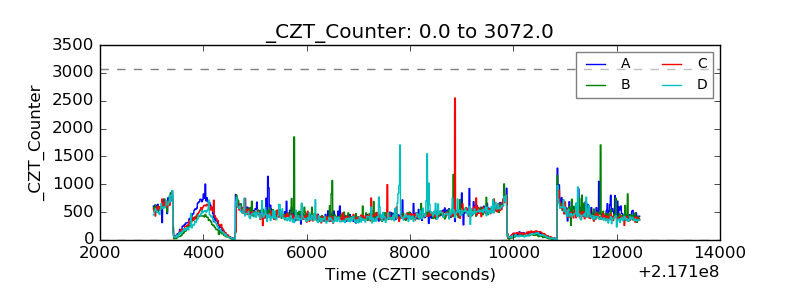 |
| +2.5 Volts monitor | 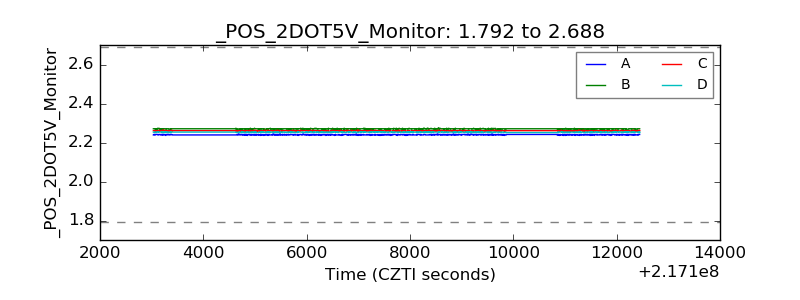 |
| +5 Volts monitor |  |
| _ROLL_ROT | 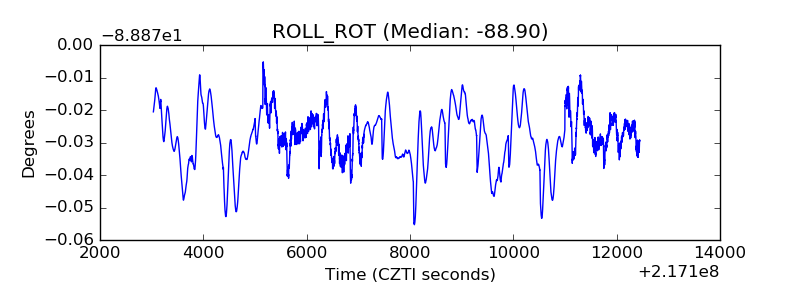 |
| _Roll_DEC | 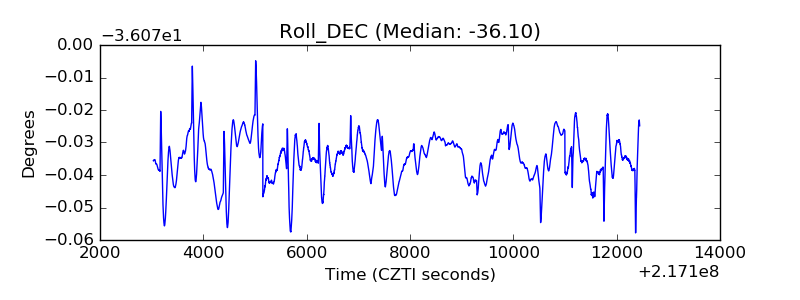 |
| _Roll_RA | 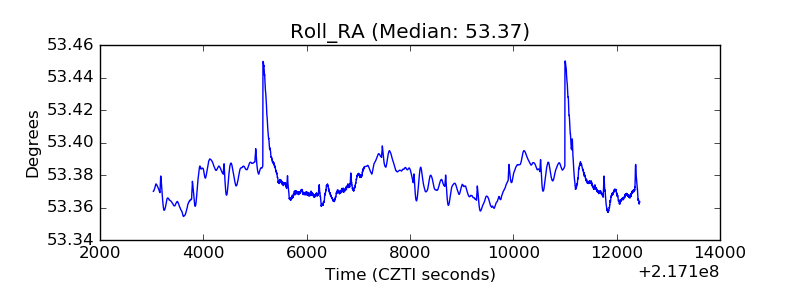 |
| Veto Counter | 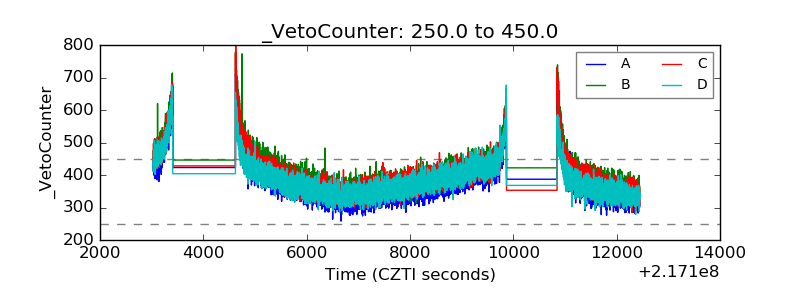 |