| Param | Original file | Final file |
|---|---|---|
| Filename | modeM0/AS1A02_006T01_9000000802_06169cztM0_level2.evt | modeM0/AS1A02_006T01_9000000802_06169cztM0_level2_quad_clean.evt |
| Size (bytes) | 146,085,120 | 41,109,120 |
| Size | 139.3 MB | 39.2 MB |
| Events in quadrant A | 1,199,897 | 271,642 |
| Events in quadrant B | 1,096,591 | 277,852 |
| Events in quadrant C | 971,152 | 268,636 |
| Events in quadrant D | 996,381 | 259,294 |
| Mode M0 | |||
|---|---|---|---|
| Quadrant | BADHDUFLAG | Total packets | Discarded packets |
| A | 0 | 5174 | 1 |
| B | 0 | 4928 | 1 |
| C | 0 | 4732 | 1 |
| D | 0 | 4894 | 1 |
| Mode SS | |||
|---|---|---|---|
| Quadrant | BADHDUFLAG | Total packets | Discarded packets |
| A | 0 | 46 | 0 |
| B | 0 | 46 | 0 |
| C | 0 | 46 | 0 |
| D | 0 | 46 | 0 |
| Mode M9 | |||
|---|---|---|---|
| Quadrant | BADHDUFLAG | Total packets | Discarded packets |
| A | 0 | 1 | 0 |
| B | 0 | 1 | 0 |
| C | 0 | 1 | 0 |
| D | 0 | 2 | 0 |
| Quadrant | Total seconds | Saturated seconds | Saturation percentage |
|---|---|---|---|
| A | 2319 | 21 | 0.905563% |
| B | 2319 | 12 | 0.517464% |
| C | 2319 | 4 | 0.172488% |
| D | 2319 | 14 | 0.603708% |
Noise dominated data is calculated using 1-second bins in cleaned event files. If a bin has >2000 counts, and if more than 50% of those come from <1% of pixels, then it is considered to be noise-dominated and hence unusable.
| Quadrant | # 1 sec bins | Bins with >0 counts | Bins with >2000 counts | High rate bins dominated by noise | Noise dominated (total time) | Noise dominated (detector-on time) | Marked lightcurve |
|---|---|---|---|---|---|---|---|
| A | 2319 | 2319 | 8 | 8 | 0.34% | 0.34% | 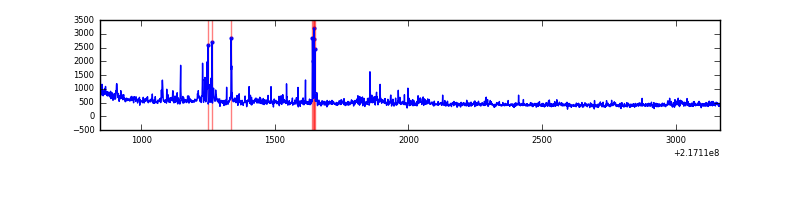 |
| B | 2319 | 2319 | 3 | 3 | 0.13% | 0.13% | 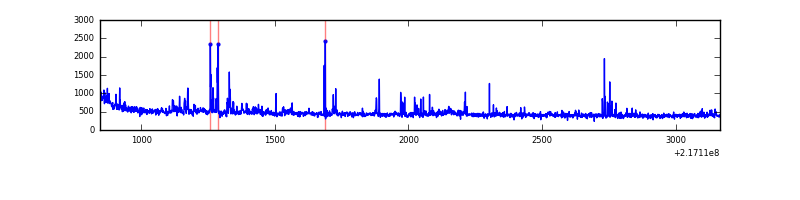 |
| C | 2319 | 2319 | 0 | 0 | 0.00% | 0.00% | 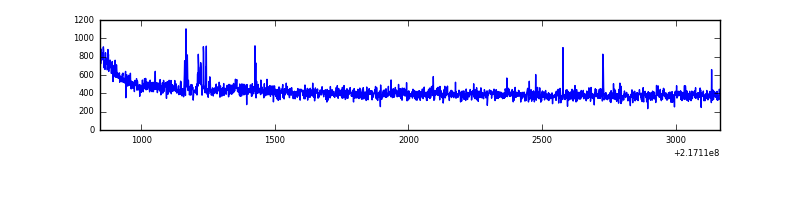 |
| D | 2319 | 2319 | 11 | 11 | 0.47% | 0.47% | 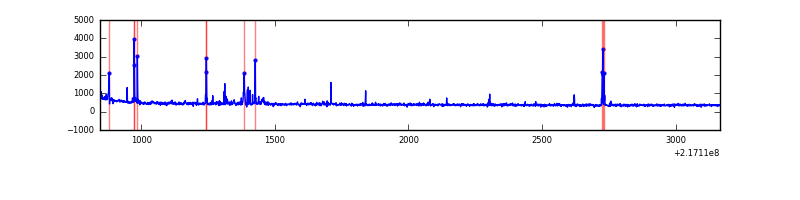 |
Top three noisy pixels from each quadrant. If the there are fewer than three noisy pixels in the level2.evt file, extra rows are filled as -1
| Pixel properties | Quadrant properties | ||||||
|---|---|---|---|---|---|---|---|
| Quadrant | DetID | PixID | Counts | Sigma | Mean | Median | Sigma |
| A | 8 | 15 | 153700 | 2890.03 | 252 | 247 | 53.1 |
| A | 4 | 2 | 70447 | 1322.1 | 252 | 247 | 53.1 |
| A | 13 | 14 | 2488 | 42.21 | 252 | 247 | 53.1 |
| B | 0 | 219 | 70025 | 1344.8 | 259 | 253 | 51.9 |
| B | 4 | 81 | 12832 | 242.45 | 259 | 253 | 51.9 |
| B | 15 | 204 | 7932 | 148.01 | 259 | 253 | 51.9 |
| C | 12 | 16 | 12763 | 216.71 | 241 | 243 | 57.8 |
| C | 1 | 16 | 11086 | 187.69 | 241 | 243 | 57.8 |
| C | 9 | 54 | 4066 | 66.17 | 241 | 243 | 57.8 |
| D | 2 | 14 | 33214 | 543.81 | 239 | 232 | 60.7 |
| D | 5 | 97 | 26082 | 426.22 | 239 | 232 | 60.7 |
| D | 6 | 112 | 11306 | 182.59 | 239 | 232 | 60.7 |
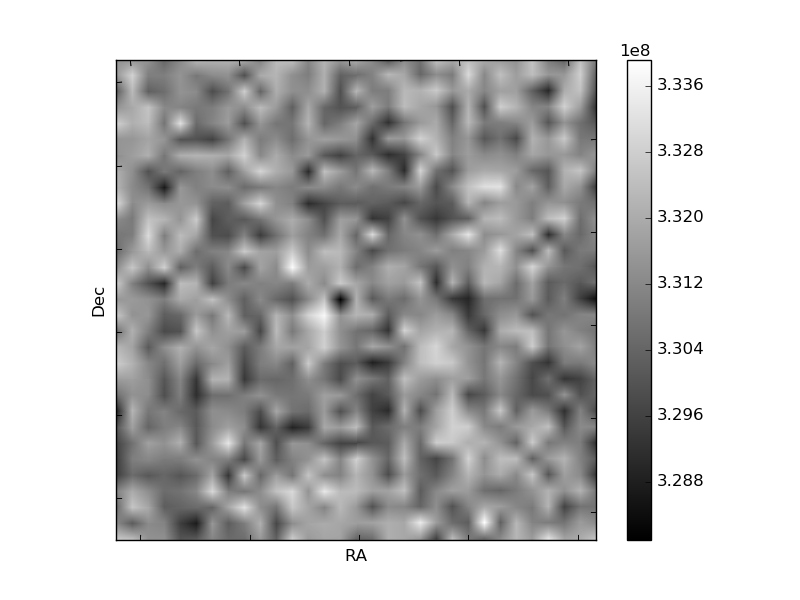
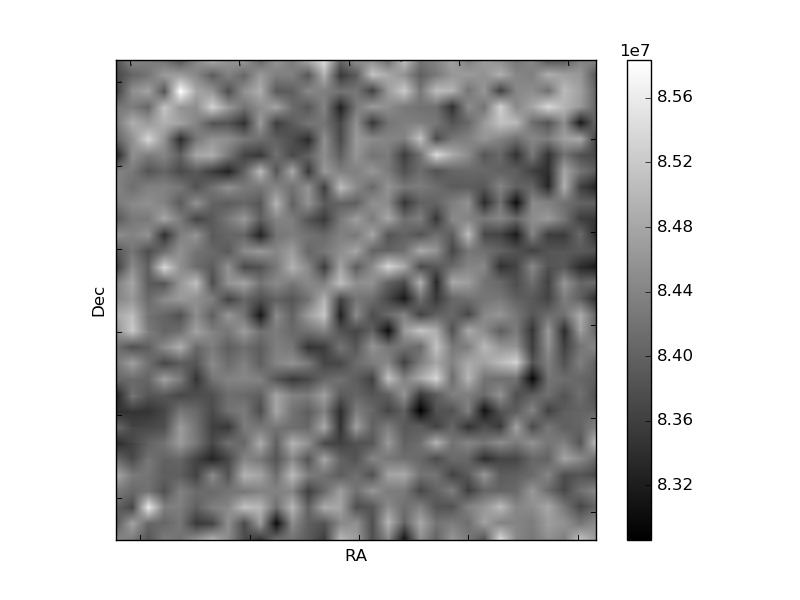
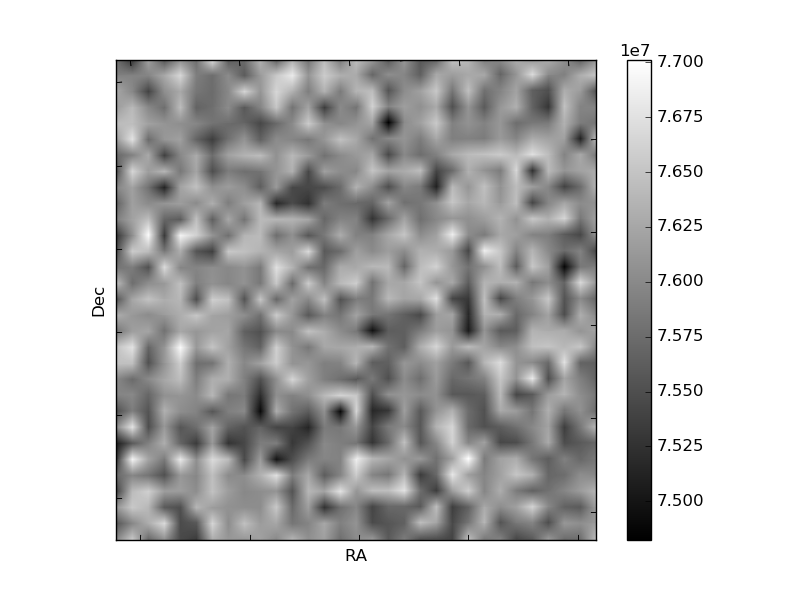
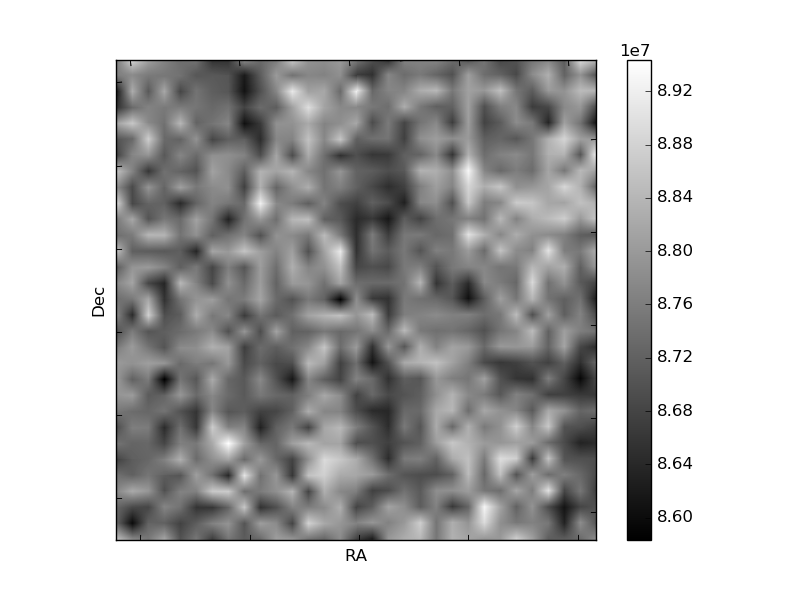
Histogram calculated using DETX and DETY for each event in the final _common_clean file
| Quadrant A | 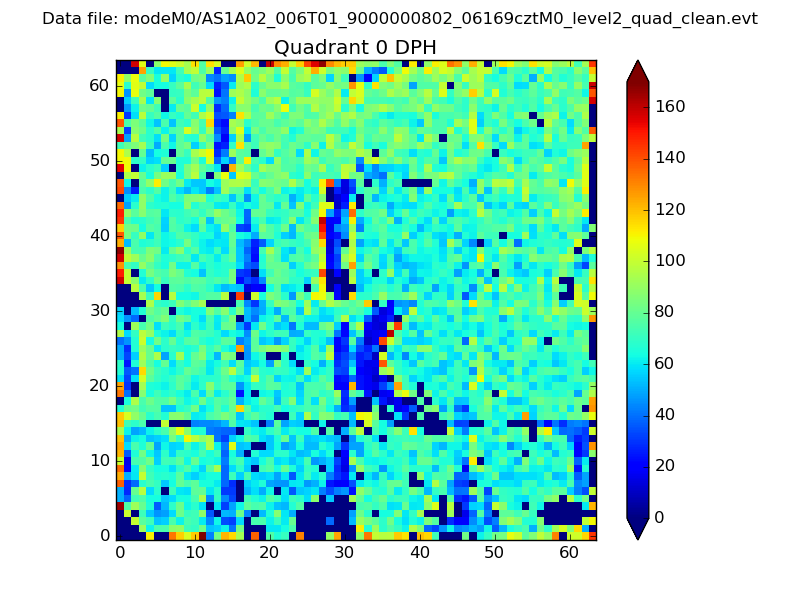 |
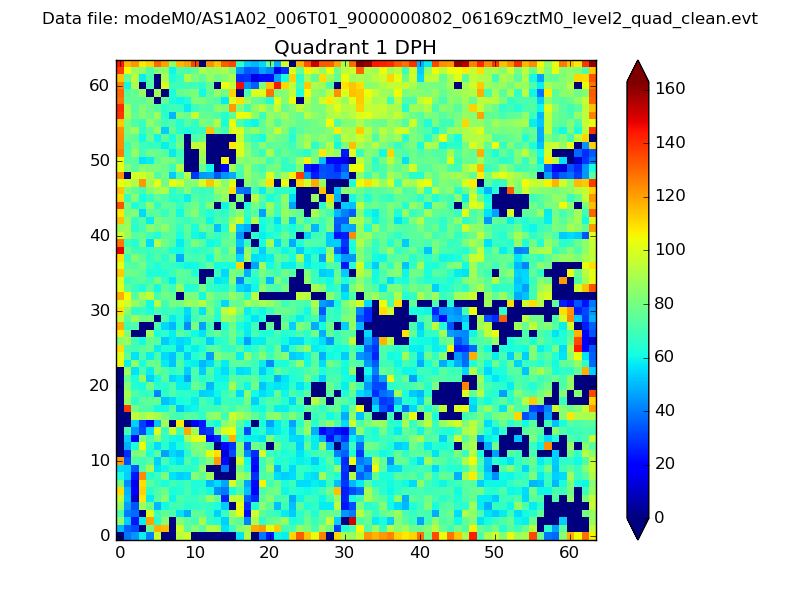 |
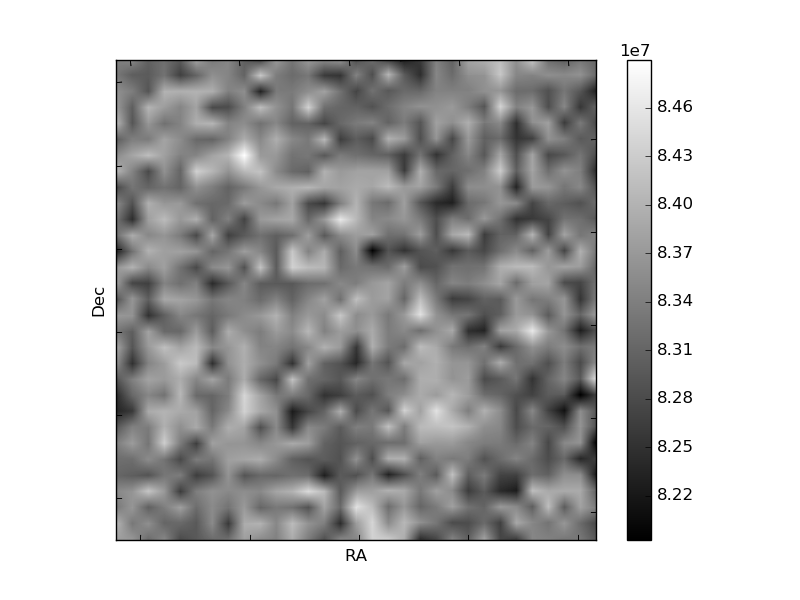
Quadrant B |
|---|---|---|---|
| Quadrant D | 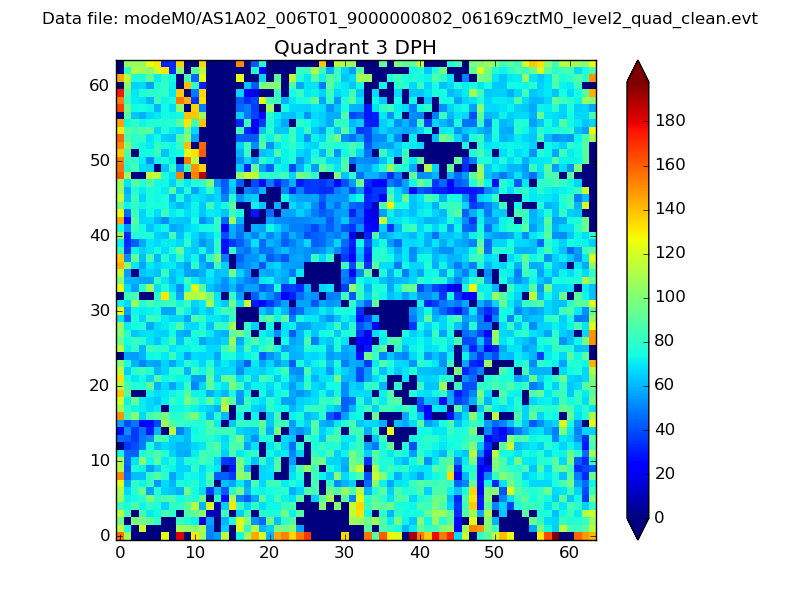 |
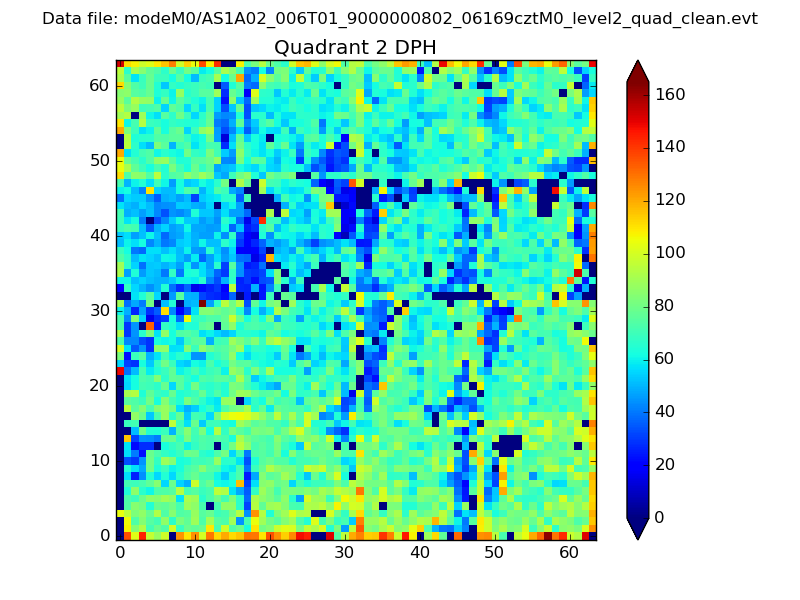 |
Quadrant C |
| Plot type | Count rate plots | Images |
|---|---|---|
| Comparison with Poisson distribution Blue bars denote a histogram of data divided into 1 sec bins. Red curve is a Poisson curve with rate = median count rate of data. |
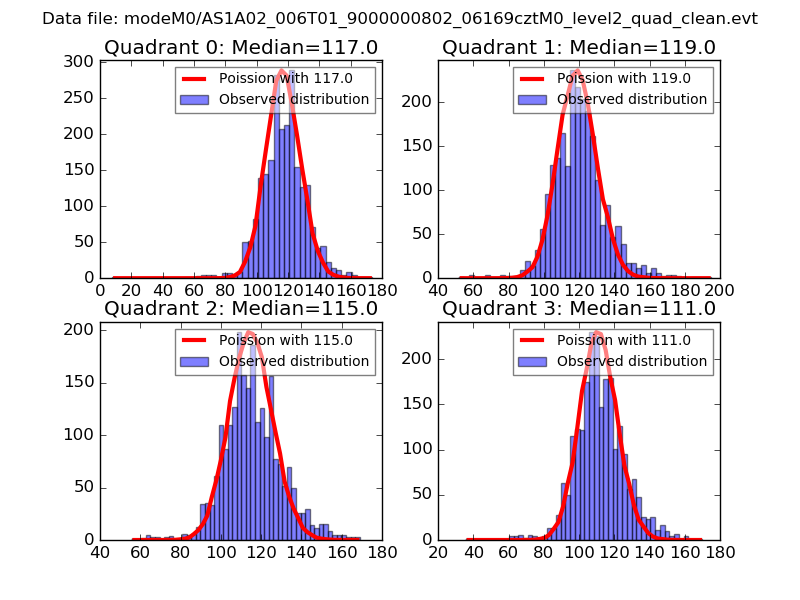 |
 |
| Quadrant-wise count rates Data is divided into 100 sec bins |
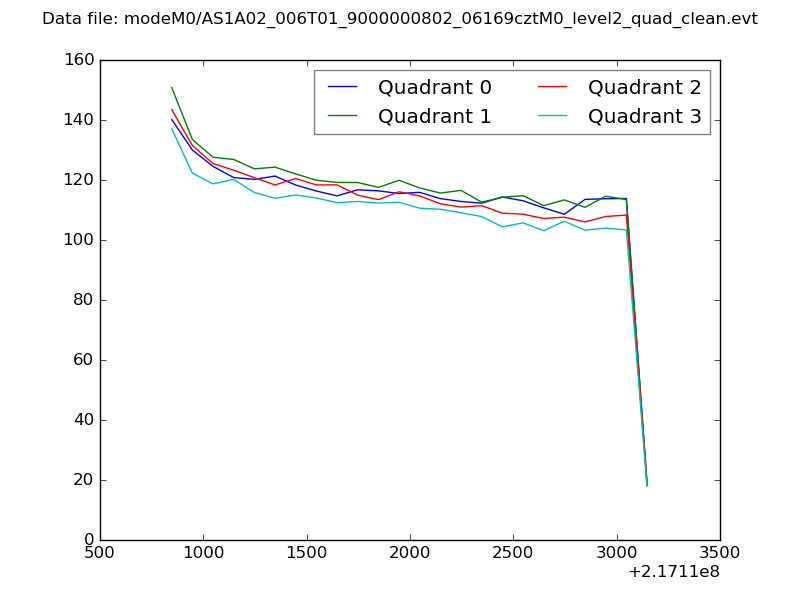 |
|
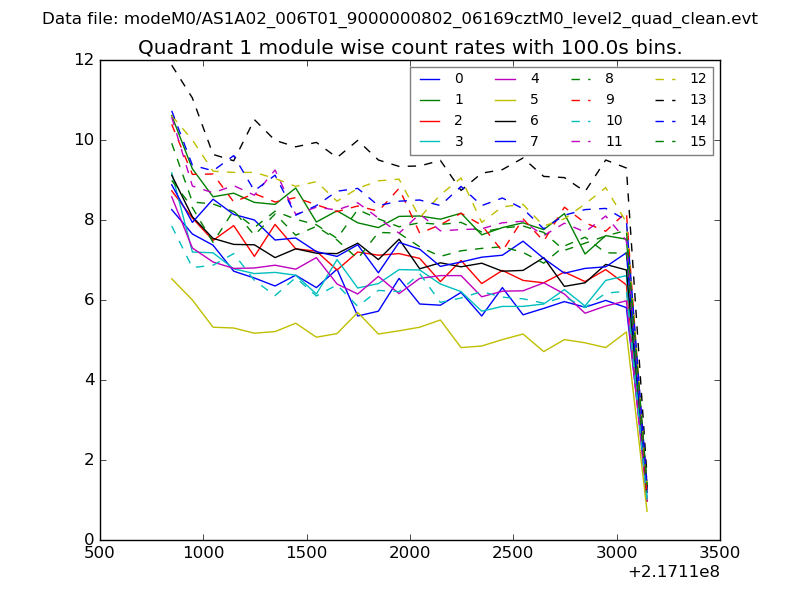
| Module-wise count rates for Quadrant A Data is divided into 100 sec bins |
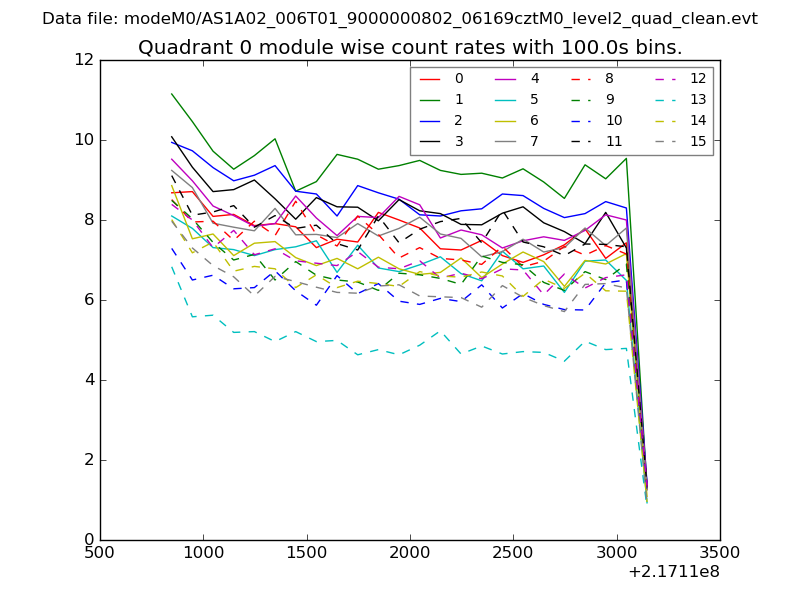 |
 |
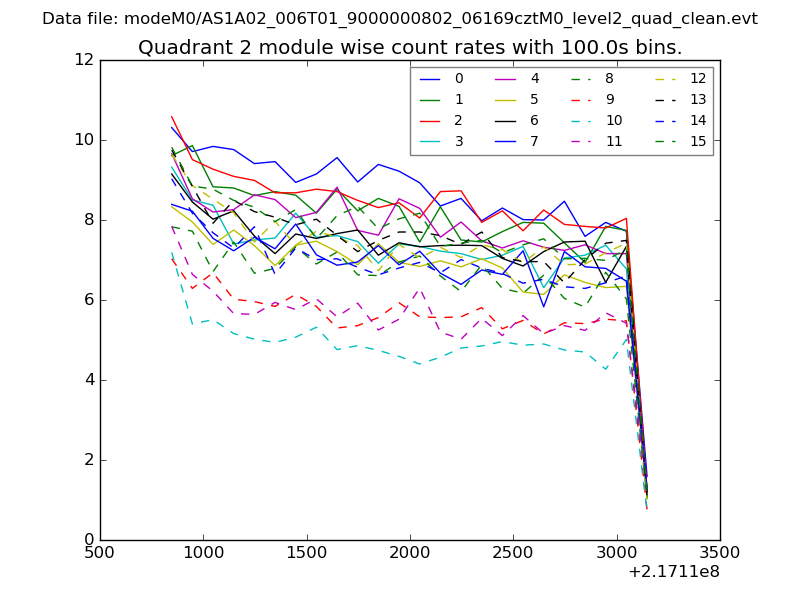
| Module-wise count rates for Quadrant B Data is divided into 100 sec bins |
 |
 |
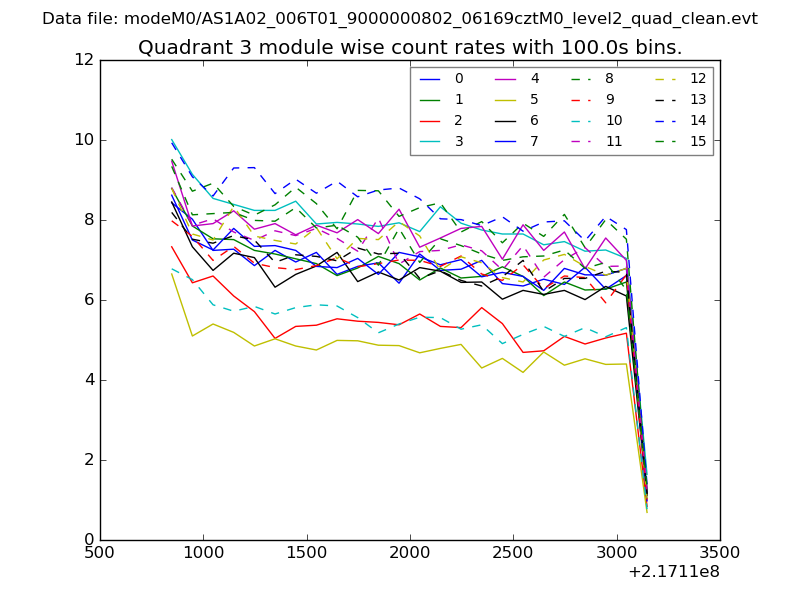
| Module-wise count rates for Quadrant C Data is divided into 100 sec bins |
 |
 |
| Module-wise count rates for Quadrant D Data is divided into 100 sec bins |
 |
 |
| Parameter | Plot |
|---|---|
| CZT HV Monitor | 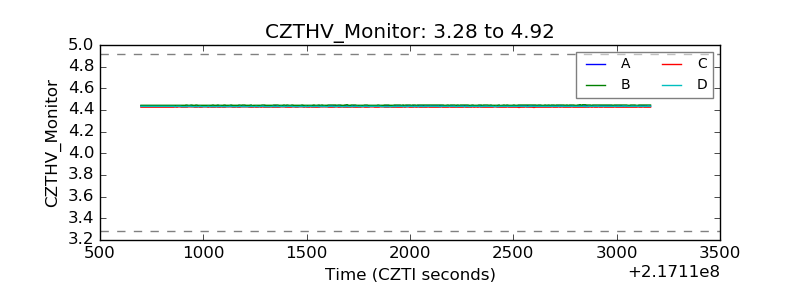 |
| D_VDD | 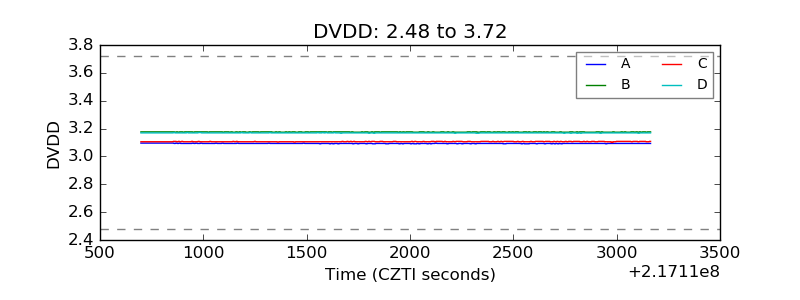 |
| Temperature 1 | 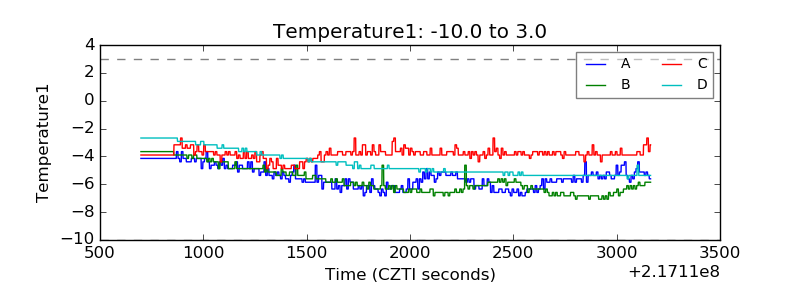 |
| Veto HV Monitor | 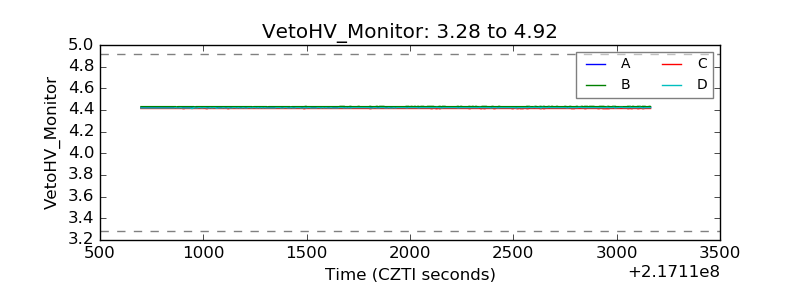 |
| Veto LLD | 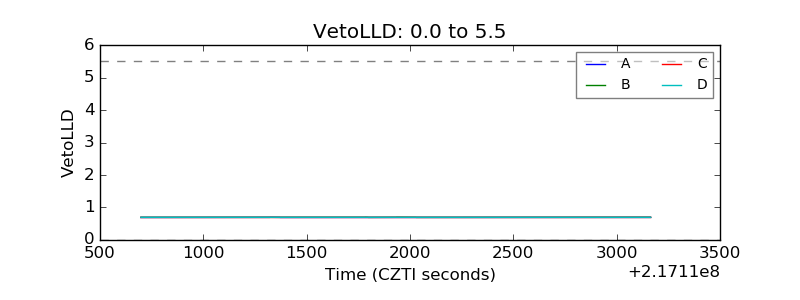 |
| Alpha Counter | 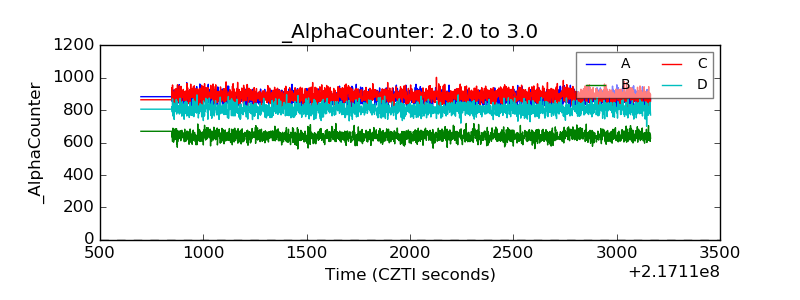 |
| _CPM_Rate | 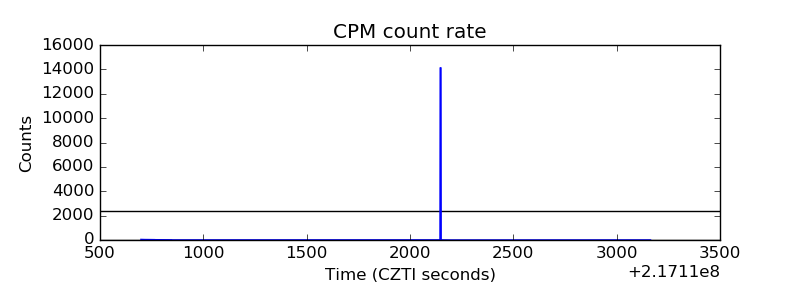 |
| CZT Counter | 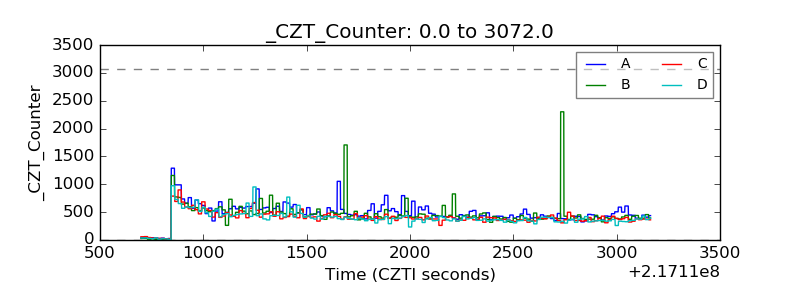 |
| +2.5 Volts monitor |  |
| +5 Volts monitor |  |
| _ROLL_ROT | 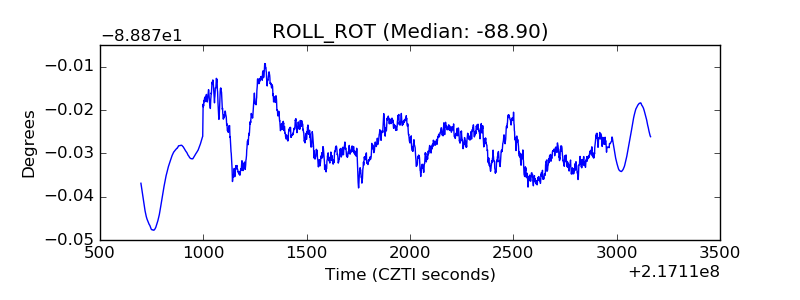 |
| _Roll_DEC | 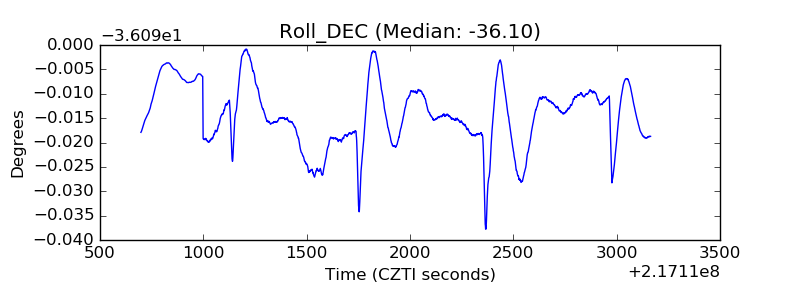 |
| _Roll_RA | 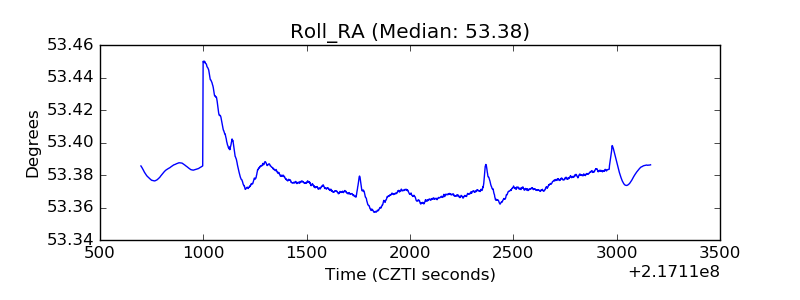 |
| Veto Counter | 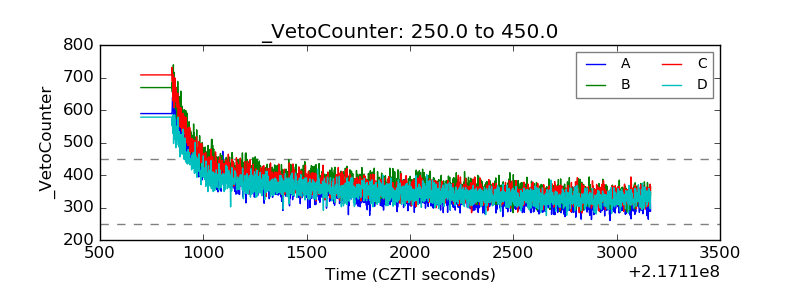 |