| Param | Original file | Final file |
|---|---|---|
| Filename | modeM0/AS1G06_139T05_9000000804cztM0_level2.fits | modeM0/AS1G06_139T05_9000000804cztM0_level2_quad_clean.evt |
| Size (bytes) | 381,208,320 | 392,356,800 |
| Size | 363.5 MB | 374.2 MB |
| Events in quadrant A | 3,354,109 | 3,114,264 |
| Events in quadrant B | 1,946,999 | 2,184,958 |
| Events in quadrant C | 1,988,135 | 2,098,148 |
| Events in quadrant D | 1,716,756 | 1,949,188 |
| Mode M9 | |||
|---|---|---|---|
| Quadrant | BADHDUFLAG | Total packets | Discarded packets |
| A | 0 | 53 | 0 |
| B | 0 | 52 | 0 |
| C | 0 | 51 | 0 |
| D | 0 | 53 | 0 |
| Mode SS | |||
|---|---|---|---|
| Quadrant | BADHDUFLAG | Total packets | Discarded packets |
| A | 0 | 748 | 0 |
| B | 0 | 764 | 0 |
| C | 0 | 754 | 0 |
| D | 0 | 750 | 0 |
| Mode M0 | |||
|---|---|---|---|
| Quadrant | BADHDUFLAG | Total packets | Discarded packets |
| A | 0 | 82417 | 0 |
| B | 0 | 82848 | 0 |
| C | 0 | 77296 | 0 |
| D | 0 | 79281 | 0 |
| Quadrant | Total seconds | Saturated seconds | Saturation percentage |
|---|---|---|---|
| A | 36781 | 473 | 1.285990% |
| B | 36888 | 922 | 2.499458% |
| C | 37006 | 321 | 0.867427% |
| D | 36927 | 414 | 1.121131% |
Noise dominated data is calculated using 1-second bins in cleaned event files. If a bin has >2000 counts, and if more than 50% of those come from <1% of pixels, then it is considered to be noise-dominated and hence unusable.
| Quadrant | # 1 sec bins | Bins with >0 counts | Bins with >2000 counts | High rate bins dominated by noise | Noise dominated (total time) | Noise dominated (detector-on time) | Marked lightcurve |
|---|---|---|---|---|---|---|---|
| A | 57659 | 38769 | 0 | 0 | 0.00% | 0.00% |  |
| B | 57659 | 38949 | 0 | 0 | 0.00% | 0.00% |  |
| C | 57659 | 39067 | 0 | 0 | 0.00% | 0.00% |  |
| D | 57659 | 38986 | 0 | 0 | 0.00% | 0.00% |  |
Top three noisy pixels from each quadrant. If the there are fewer than three noisy pixels in the level2.evt file, extra rows are filled as -1
| Pixel properties | Quadrant properties | ||||||
|---|---|---|---|---|---|---|---|
| Quadrant | DetID | PixID | Counts | Sigma | Mean | Median | Sigma |
| A | 0 | 29 | 2115 | 7.14 | 883 | 858 | 176.0 |
| A | -1 | -1 | -1 | -1.0 | 883 | 858 | 176.0 |
| A | -1 | -1 | -1 | -1.0 | 883 | 858 | 176.0 |
| B | 2 | 9 | 1702 | 11.5 | 512 | 484 | 105.9 |
| B | 12 | 226 | 1401 | 8.66 | 512 | 484 | 105.9 |
| B | 14 | 254 | 1349 | 8.17 | 512 | 484 | 105.9 |
| C | 1 | 81 | 1427 | 6.68 | 524 | 483 | 141.3 |
| C | 1 | 80 | 1425 | 6.67 | 524 | 483 | 141.3 |
| C | 12 | 241 | 1403 | 6.51 | 524 | 483 | 141.3 |
| D | 3 | 31 | 1253 | 6.01 | 490 | 444 | 134.5 |
| D | 3 | 14 | 1253 | 6.01 | 490 | 444 | 134.5 |
| D | 6 | 231 | 1250 | 5.99 | 490 | 444 | 134.5 |
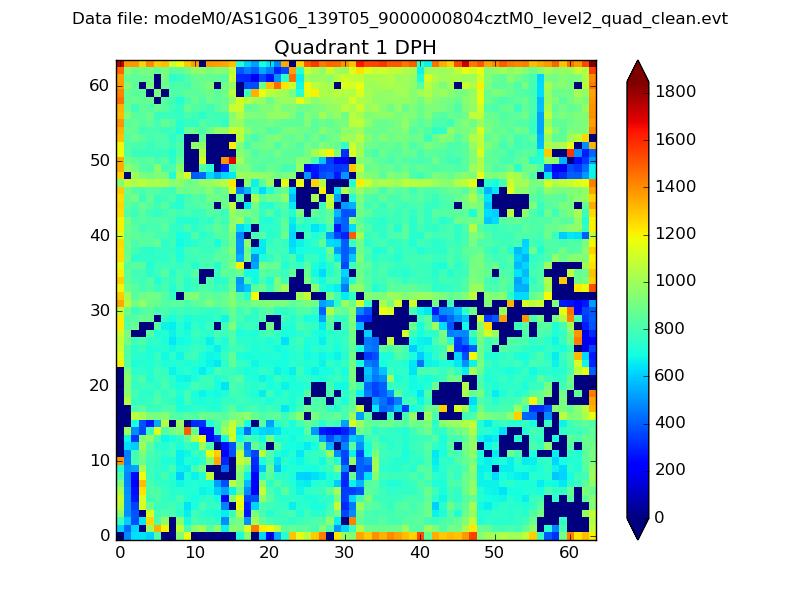
Histogram calculated using DETX and DETY for each event in the final _common_clean file
| Quadrant A |  |
 |
Quadrant B |
|---|---|---|---|
| Quadrant D | 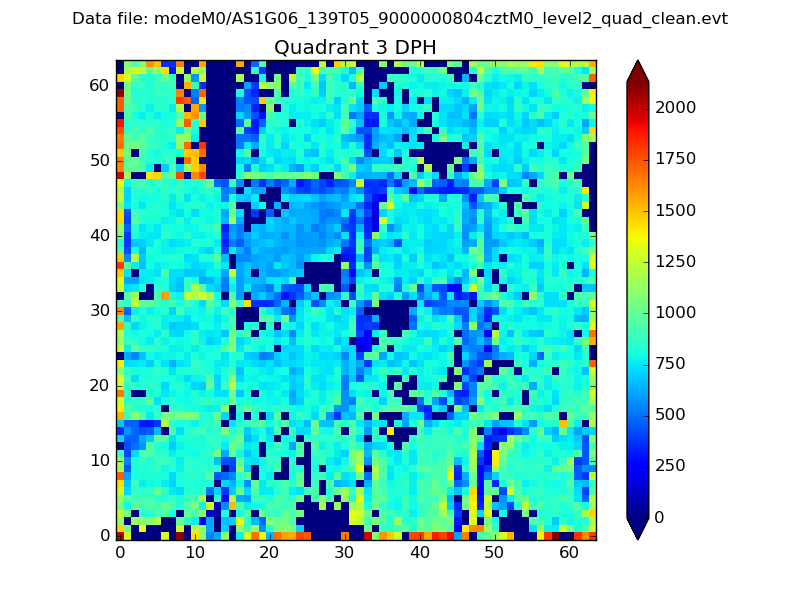 |
 |
Quadrant C |
| Plot type | Count rate plots | Images |
|---|---|---|
| Comparison with Poisson distribution Blue bars denote a histogram of data divided into 1 sec bins. Red curve is a Poisson curve with rate = median count rate of data. |
 |
 |
| Quadrant-wise count rates Data is divided into 100 sec bins |
 |
|
| Module-wise count rates for Quadrant A Data is divided into 100 sec bins |
 |
 |
| Module-wise count rates for Quadrant B Data is divided into 100 sec bins |
 |
 |
| Module-wise count rates for Quadrant C Data is divided into 100 sec bins |
 |
 |
| Module-wise count rates for Quadrant D Data is divided into 100 sec bins |
 |
 |
| Parameter | Plot |
|---|---|
| CZT HV Monitor |  |
| D_VDD |  |
| Temperature 1 |  |
| Veto HV Monitor |  |
| Veto LLD |  |
| Alpha Counter |  |
| _CPM_Rate |  |
| CZT Counter |  |
| +2.5 Volts monitor |  |
| +5 Volts monitor |  |
| _ROLL_ROT |  |
| _Roll_DEC |  |
| _Roll_RA |  |
| Veto Counter |  |