| Param | Original file | Final file |
|---|---|---|
| Filename | modeM0/AS1G06_139T05_9000000804_06169cztM0_level2.evt | modeM0/AS1G06_139T05_9000000804_06169cztM0_level2_quad_clean.evt |
| Size (bytes) | 316,212,480 | 56,304,000 |
| Size | 301.6 MB | 53.7 MB |
| Events in quadrant A | 2,611,839 | 348,381 |
| Events in quadrant B | 2,223,813 | 358,167 |
| Events in quadrant C | 2,022,100 | 352,464 |
| Events in quadrant D | 2,416,865 | 334,395 |
| Mode M9 | |||
|---|---|---|---|
| Quadrant | BADHDUFLAG | Total packets | Discarded packets |
| A | 0 | 5 | 0 |
| B | 0 | 5 | 0 |
| C | 0 | 5 | 0 |
| D | 0 | 5 | 0 |
| Mode SS | |||
|---|---|---|---|
| Quadrant | BADHDUFLAG | Total packets | Discarded packets |
| A | 0 | 92 | 0 |
| B | 0 | 92 | 0 |
| C | 0 | 92 | 0 |
| D | 0 | 92 | 0 |
| Mode M0 | |||
|---|---|---|---|
| Quadrant | BADHDUFLAG | Total packets | Discarded packets |
| A | 0 | 10629 | 2 |
| B | 0 | 9476 | 1 |
| C | 0 | 9038 | 1 |
| D | 0 | 10355 | 1 |
| Quadrant | Total seconds | Saturated seconds | Saturation percentage |
|---|---|---|---|
| A | 4420 | 78 | 1.764706% |
| B | 4420 | 37 | 0.837104% |
| C | 4420 | 7 | 0.158371% |
| D | 4420 | 87 | 1.968326% |
Noise dominated data is calculated using 1-second bins in cleaned event files. If a bin has >2000 counts, and if more than 50% of those come from <1% of pixels, then it is considered to be noise-dominated and hence unusable.
| Quadrant | # 1 sec bins | Bins with >0 counts | Bins with >2000 counts | High rate bins dominated by noise | Noise dominated (total time) | Noise dominated (detector-on time) | Marked lightcurve |
|---|---|---|---|---|---|---|---|
| A | 4955 | 4421 | 21 | 21 | 0.42% | 0.48% | 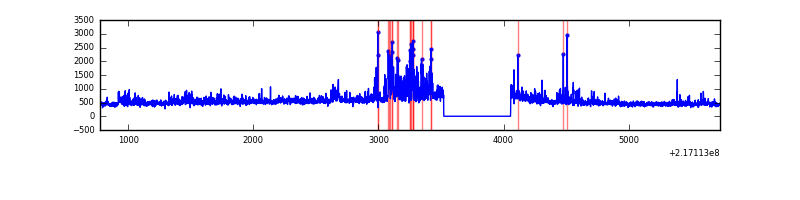 |
| B | 4955 | 4421 | 5 | 5 | 0.10% | 0.11% | 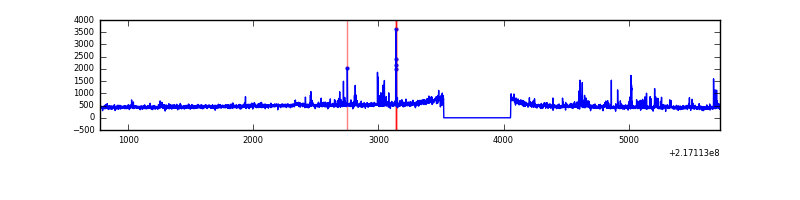 |
| C | 4955 | 4421 | 0 | 0 | 0.00% | 0.00% | 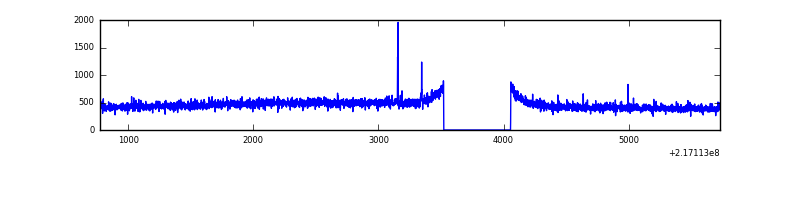 |
| D | 4955 | 4421 | 73 | 73 | 1.47% | 1.65% | 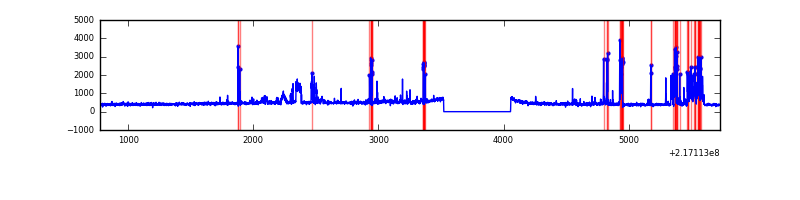 |
Top three noisy pixels from each quadrant. If the there are fewer than three noisy pixels in the level2.evt file, extra rows are filled as -1
| Pixel properties | Quadrant properties | ||||||
|---|---|---|---|---|---|---|---|
| Quadrant | DetID | PixID | Counts | Sigma | Mean | Median | Sigma |
| A | 8 | 15 | 501456 | 4592.89 | 525 | 512 | 109.1 |
| A | 4 | 2 | 79342 | 722.75 | 525 | 512 | 109.1 |
| A | 0 | 254 | 6231 | 52.43 | 525 | 512 | 109.1 |
| B | 0 | 219 | 62926 | 595.78 | 533 | 519 | 104.7 |
| B | 3 | 64 | 31730 | 297.96 | 533 | 519 | 104.7 |
| B | 0 | 214 | 27691 | 259.4 | 533 | 519 | 104.7 |
| C | 12 | 16 | 22446 | 182.5 | 511 | 512 | 120.2 |
| C | 1 | 16 | 4004 | 29.06 | 511 | 512 | 120.2 |
| C | 13 | 61 | 3991 | 28.95 | 511 | 512 | 120.2 |
| D | 2 | 206 | 273274 | 2157.27 | 505 | 487 | 126.5 |
| D | 13 | 169 | 144596 | 1139.65 | 505 | 487 | 126.5 |
| D | 5 | 97 | 30810 | 239.8 | 505 | 487 | 126.5 |
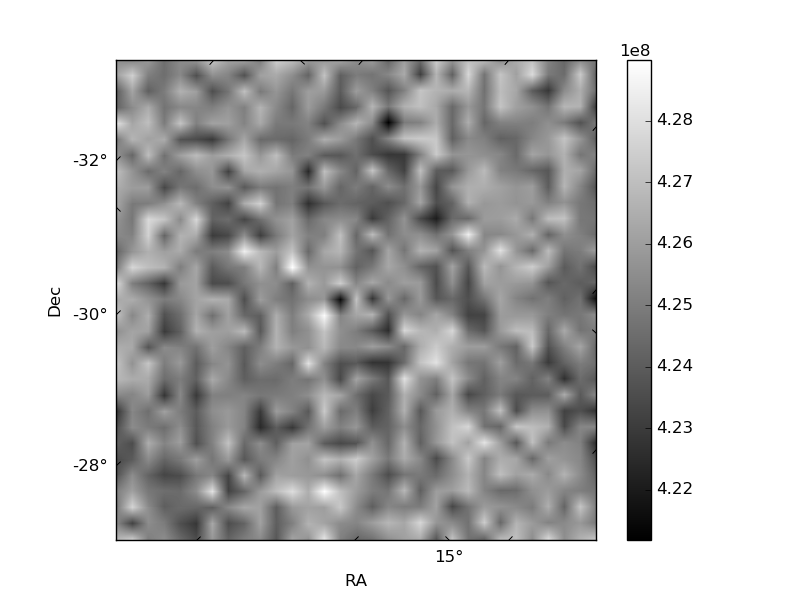
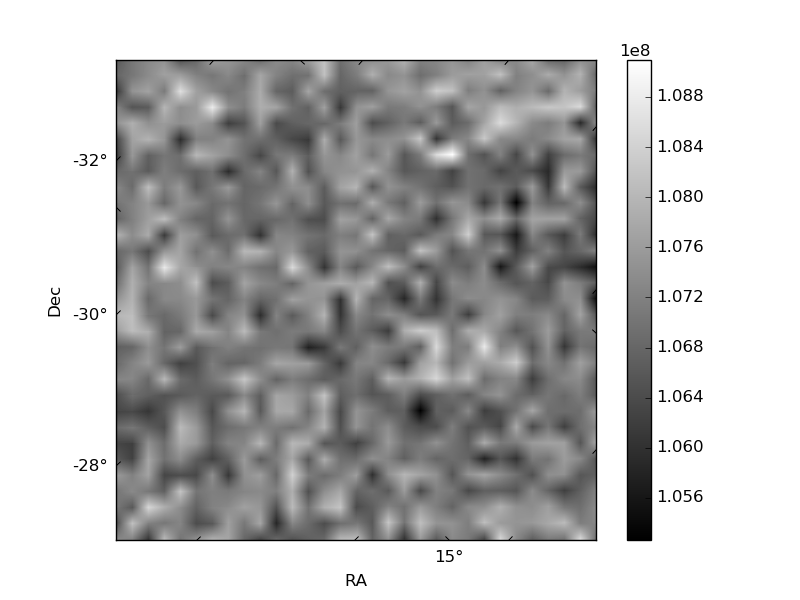
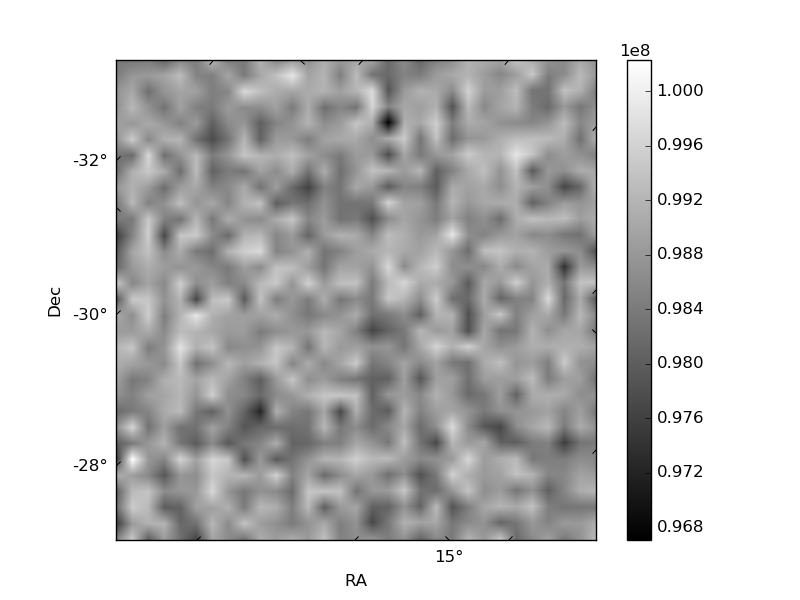
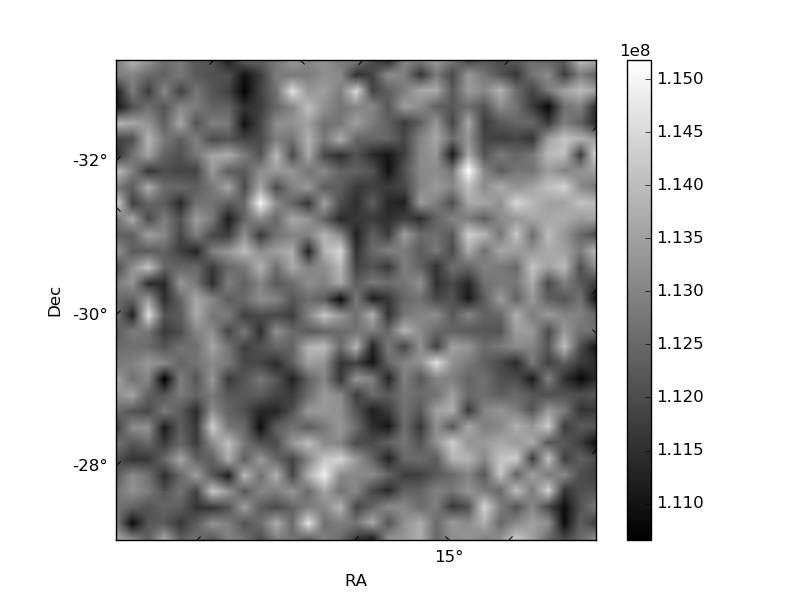
Histogram calculated using DETX and DETY for each event in the final _common_clean file
| Quadrant A | 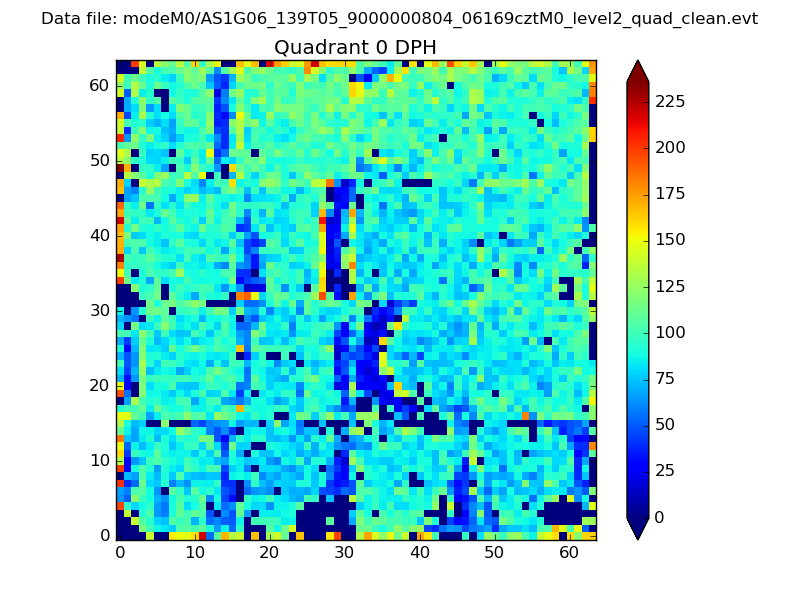 |
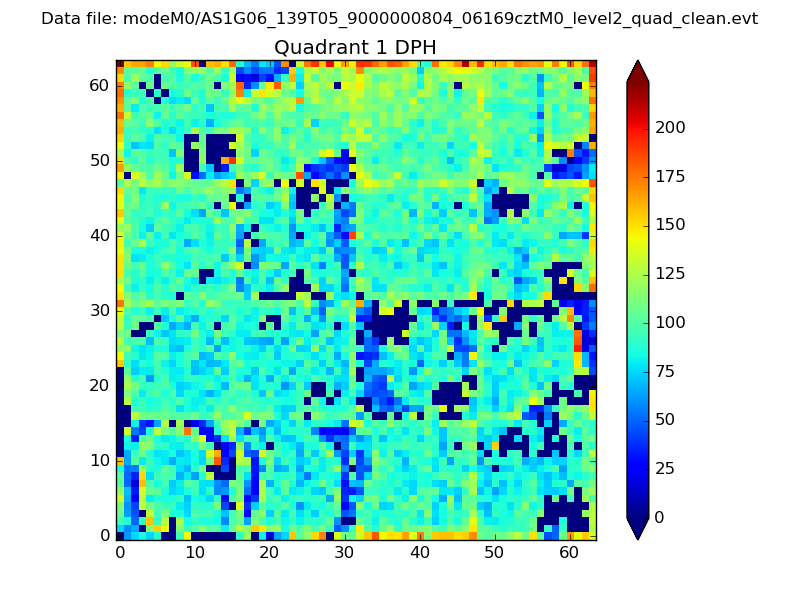 |
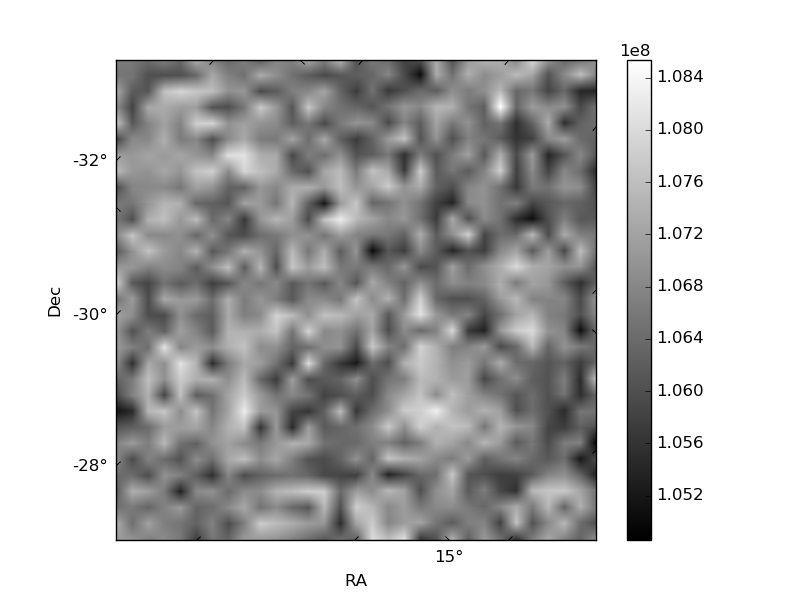
Quadrant B |
|---|---|---|---|
| Quadrant D | 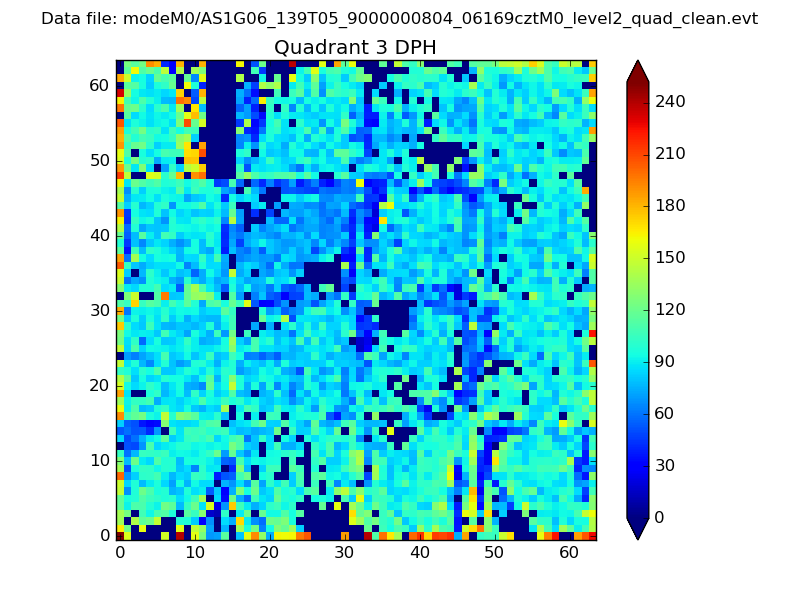 |
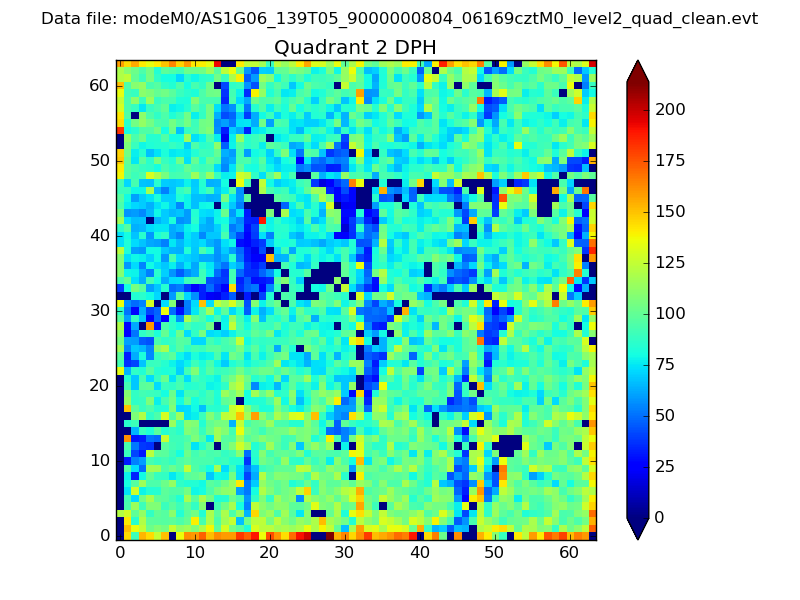 |
Quadrant C |
| Plot type | Count rate plots | Images |
|---|---|---|
| Comparison with Poisson distribution Blue bars denote a histogram of data divided into 1 sec bins. Red curve is a Poisson curve with rate = median count rate of data. |
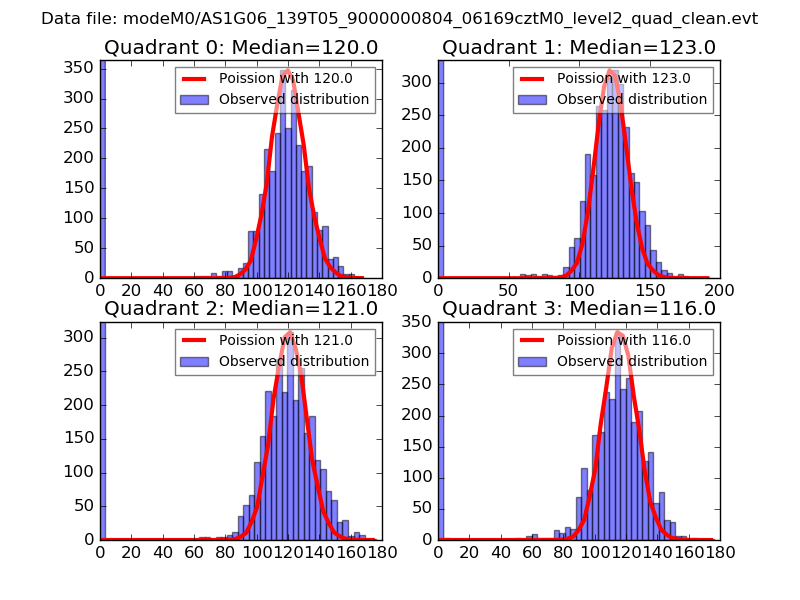 |
 |
| Quadrant-wise count rates Data is divided into 100 sec bins |
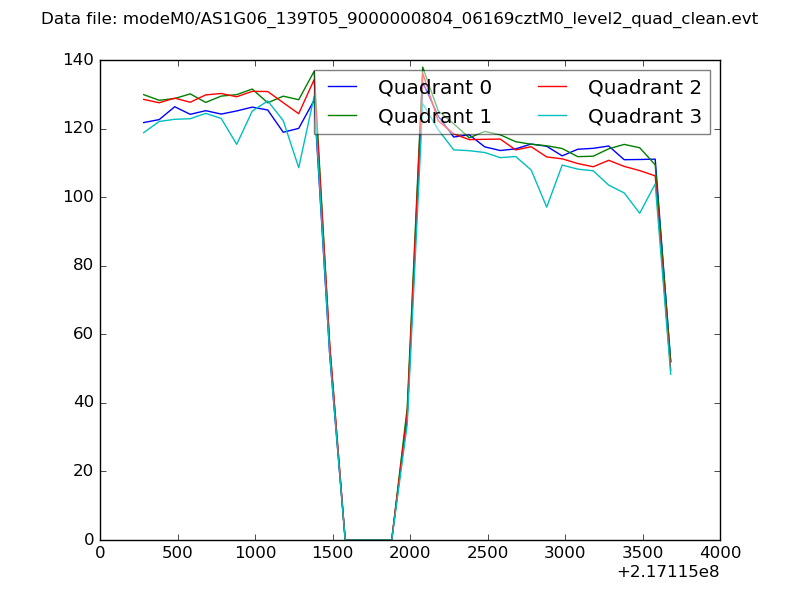 |
|
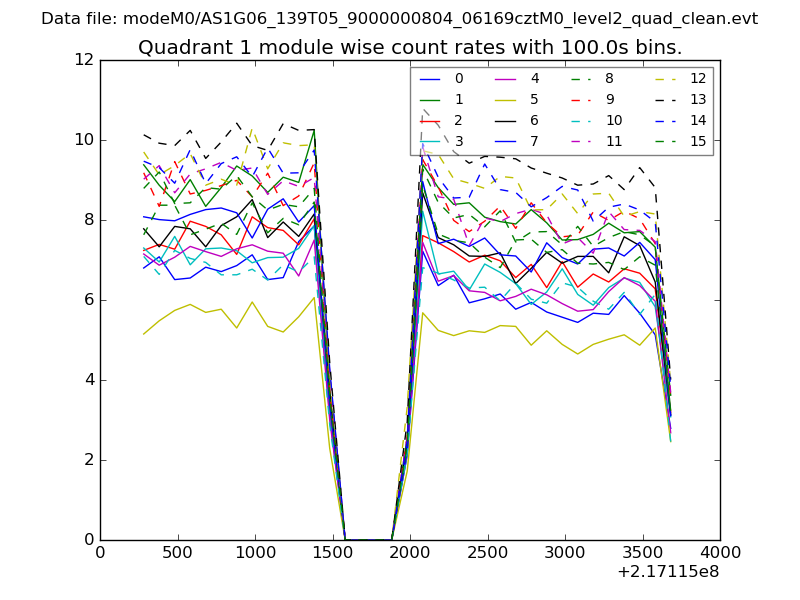
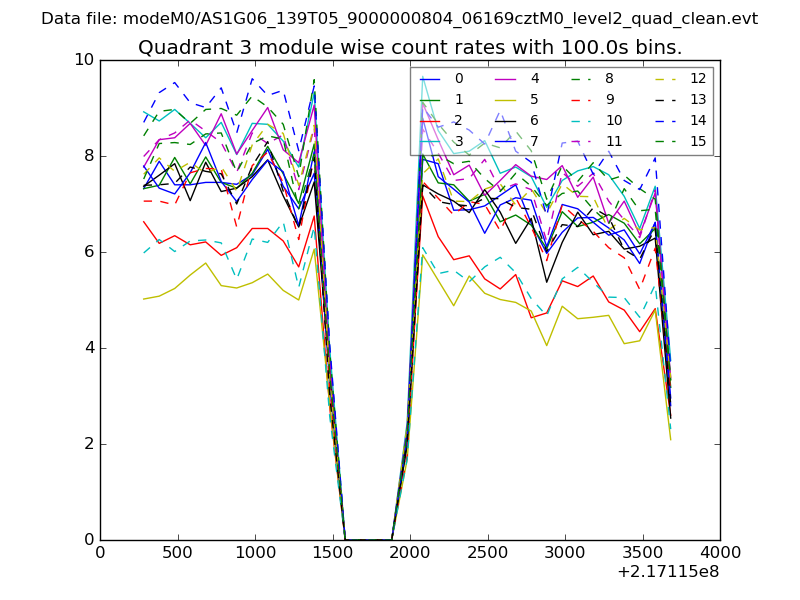
| Module-wise count rates for Quadrant A Data is divided into 100 sec bins |
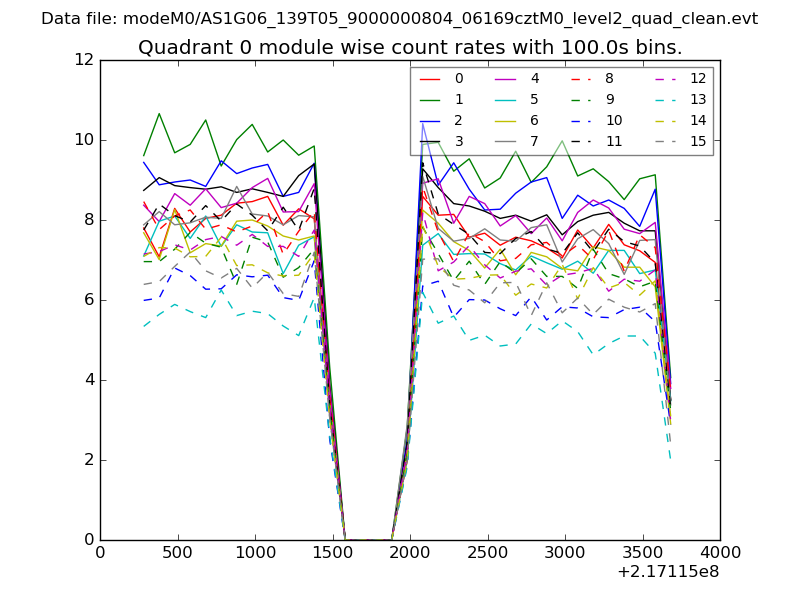 |
 |
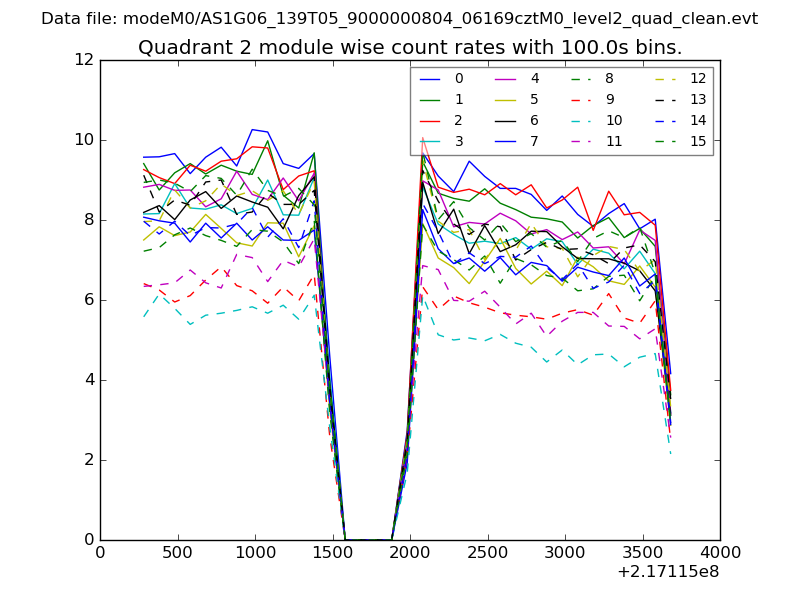
| Module-wise count rates for Quadrant B Data is divided into 100 sec bins |
 |
 |
| Module-wise count rates for Quadrant C Data is divided into 100 sec bins |
 |
 |
| Module-wise count rates for Quadrant D Data is divided into 100 sec bins |
 |
 |
| Parameter | Plot |
|---|---|
| CZT HV Monitor | 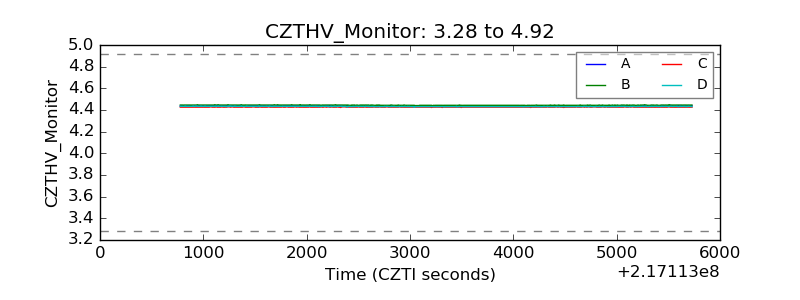 |
| D_VDD | 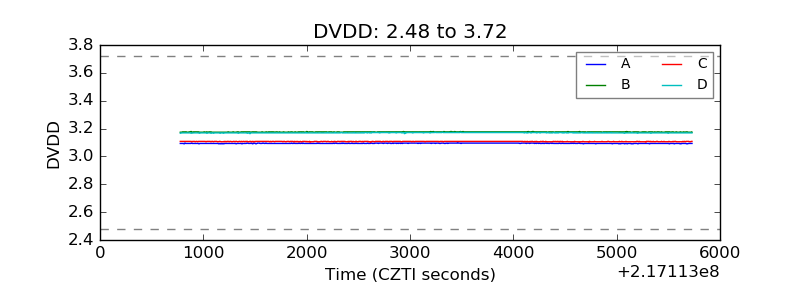 |
| Temperature 1 | 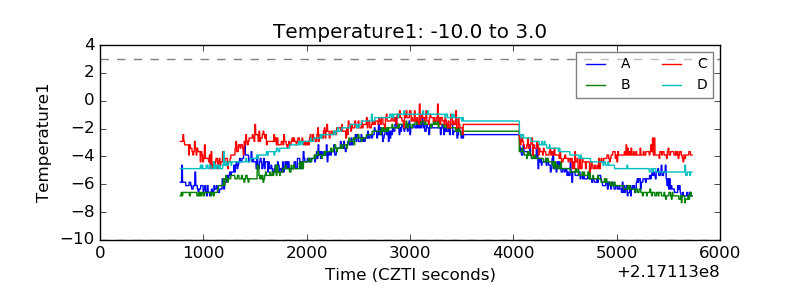 |
| Veto HV Monitor | 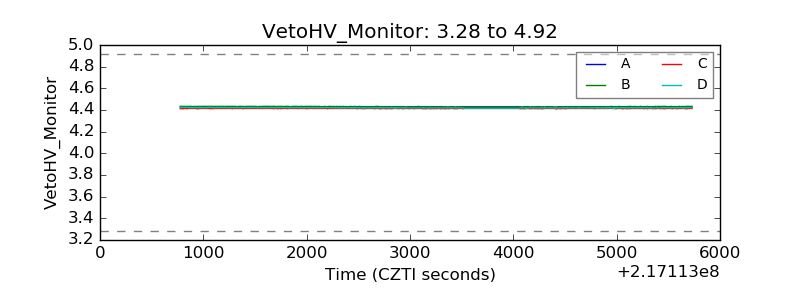 |
| Veto LLD | 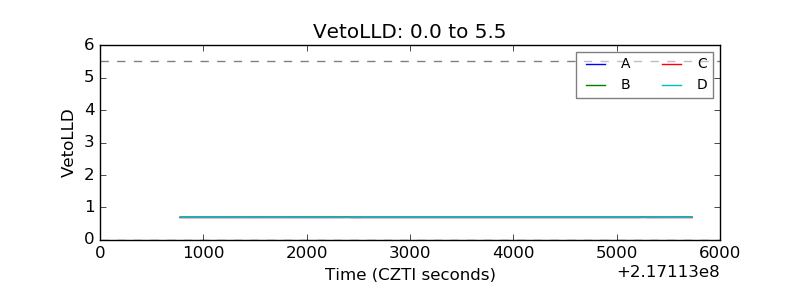 |
| Alpha Counter | 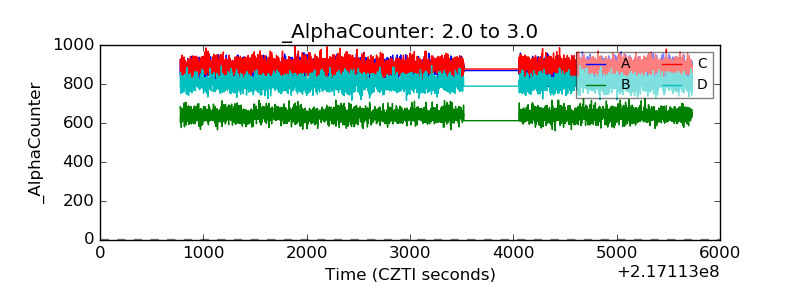 |
| _CPM_Rate | 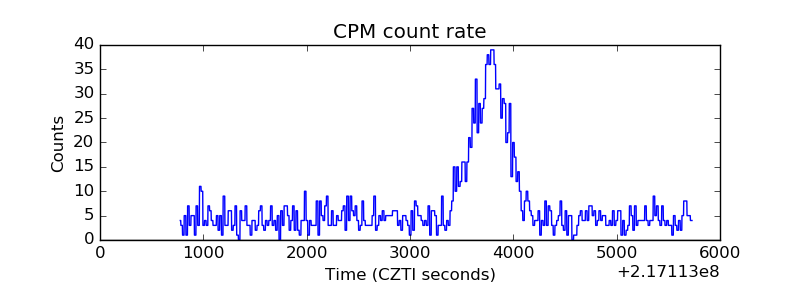 |
| CZT Counter | 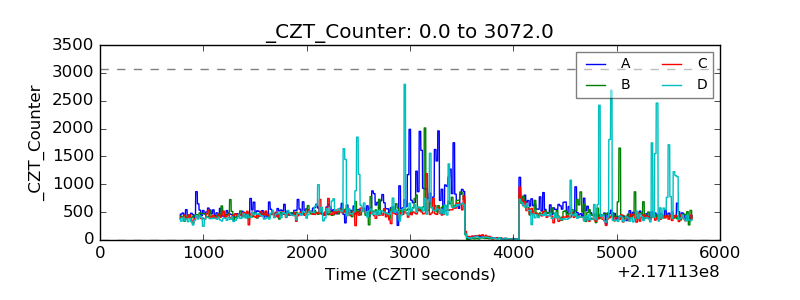 |
| +2.5 Volts monitor |  |
| +5 Volts monitor |  |
| _ROLL_ROT | 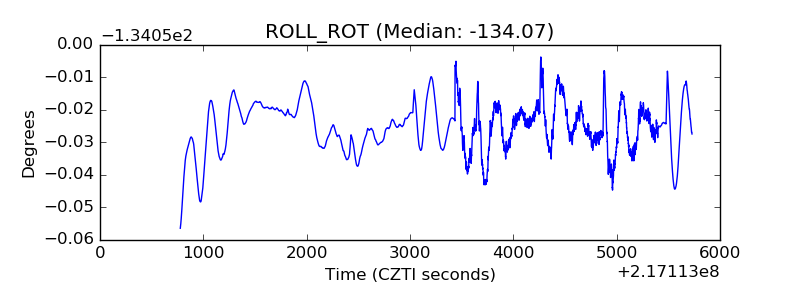 |
| _Roll_DEC | 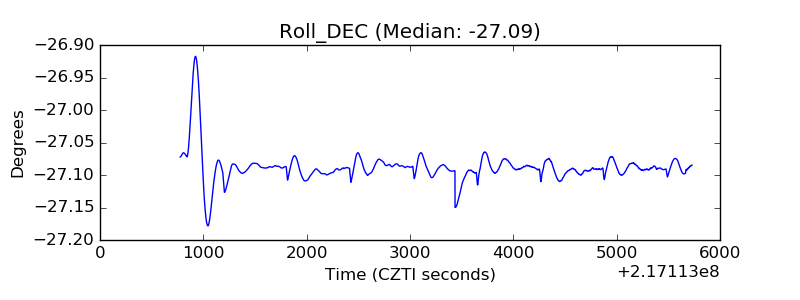 |
| _Roll_RA | 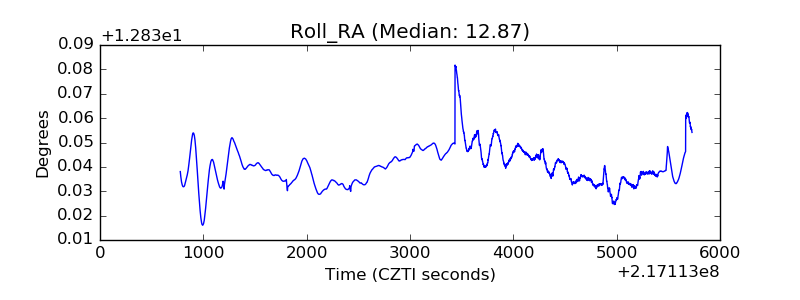 |
| Veto Counter | 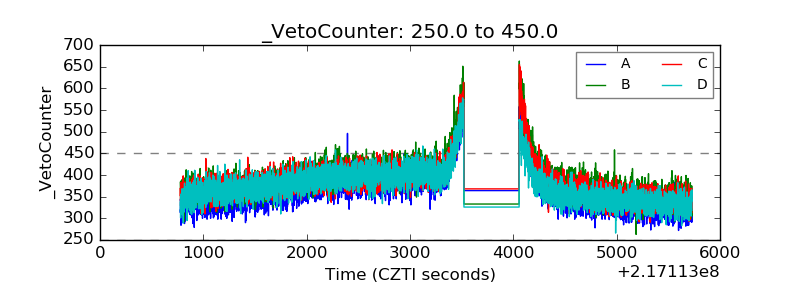 |