| Param | Original file | Final file |
|---|---|---|
| Filename | modeM0/AS1G06_139T05_9000000804_06170cztM0_level2.evt | modeM0/AS1G06_139T05_9000000804_06170cztM0_level2_quad_clean.evt |
| Size (bytes) | 523,586,880 | 106,205,760 |
| Size | 499.3 MB | 101.3 MB |
| Events in quadrant A | 4,058,703 | 670,690 |
| Events in quadrant B | 3,845,333 | 685,662 |
| Events in quadrant C | 3,495,305 | 670,042 |
| Events in quadrant D | 3,923,893 | 644,259 |
| Mode M9 | |||
|---|---|---|---|
| Quadrant | BADHDUFLAG | Total packets | Discarded packets |
| A | 0 | 6 | 0 |
| B | 0 | 6 | 0 |
| C | 0 | 6 | 0 |
| D | 0 | 6 | 0 |
| Mode SS | |||
|---|---|---|---|
| Quadrant | BADHDUFLAG | Total packets | Discarded packets |
| A | 0 | 168 | 2 |
| B | 0 | 168 | 14 |
| C | 0 | 168 | 4 |
| D | 0 | 168 | 4 |
| Mode M0 | |||
|---|---|---|---|
| Quadrant | BADHDUFLAG | Total packets | Discarded packets |
| A | 0 | 17998 | 735 |
| B | 0 | 17563 | 754 |
| C | 0 | 16817 | 683 |
| D | 0 | 18243 | 861 |
| Quadrant | Total seconds | Saturated seconds | Saturation percentage |
|---|---|---|---|
| A | 7852 | 138 | 1.757514% |
| B | 7827 | 118 | 1.507602% |
| C | 7840 | 60 | 0.765306% |
| D | 7838 | 134 | 1.709620% |
Noise dominated data is calculated using 1-second bins in cleaned event files. If a bin has >2000 counts, and if more than 50% of those come from <1% of pixels, then it is considered to be noise-dominated and hence unusable.
| Quadrant | # 1 sec bins | Bins with >0 counts | Bins with >2000 counts | High rate bins dominated by noise | Noise dominated (total time) | Noise dominated (detector-on time) | Marked lightcurve |
|---|---|---|---|---|---|---|---|
| A | 8818 | 8158 | 16 | 16 | 0.18% | 0.20% | 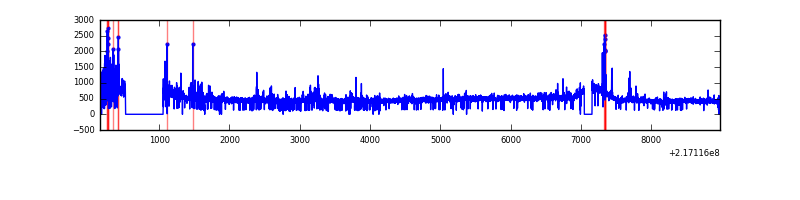 |
| B | 8818 | 8156 | 5 | 5 | 0.06% | 0.06% | 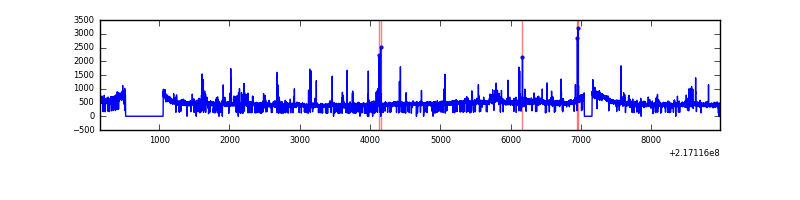 |
| C | 8818 | 8150 | 0 | 0 | 0.00% | 0.00% | 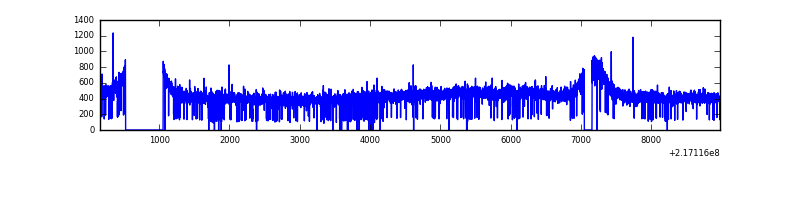 |
| D | 8818 | 8146 | 61 | 61 | 0.69% | 0.75% | 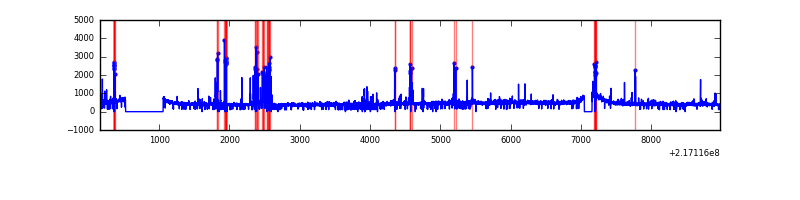 |
Top three noisy pixels from each quadrant. If the there are fewer than three noisy pixels in the level2.evt file, extra rows are filled as -1
| Pixel properties | Quadrant properties | ||||||
|---|---|---|---|---|---|---|---|
| Quadrant | DetID | PixID | Counts | Sigma | Mean | Median | Sigma |
| A | 8 | 15 | 499090 | 2655.82 | 912 | 893 | 187.6 |
| A | 4 | 2 | 33761 | 175.22 | 912 | 893 | 187.6 |
| A | 12 | 194 | 8603 | 41.1 | 912 | 893 | 187.6 |
| B | 0 | 219 | 114386 | 632.07 | 925 | 900 | 179.5 |
| B | 0 | 214 | 48481 | 265.0 | 925 | 900 | 179.5 |
| B | 15 | 204 | 34746 | 188.51 | 925 | 900 | 179.5 |
| C | 12 | 16 | 19473 | 89.92 | 888 | 889 | 206.7 |
| C | 1 | 16 | 10944 | 48.65 | 888 | 889 | 206.7 |
| C | 13 | 61 | 7005 | 29.59 | 888 | 889 | 206.7 |
| D | 2 | 206 | 246459 | 1132.47 | 881 | 853 | 216.9 |
| D | 2 | 14 | 118823 | 543.95 | 881 | 853 | 216.9 |
| D | 12 | 110 | 85967 | 392.45 | 881 | 853 | 216.9 |
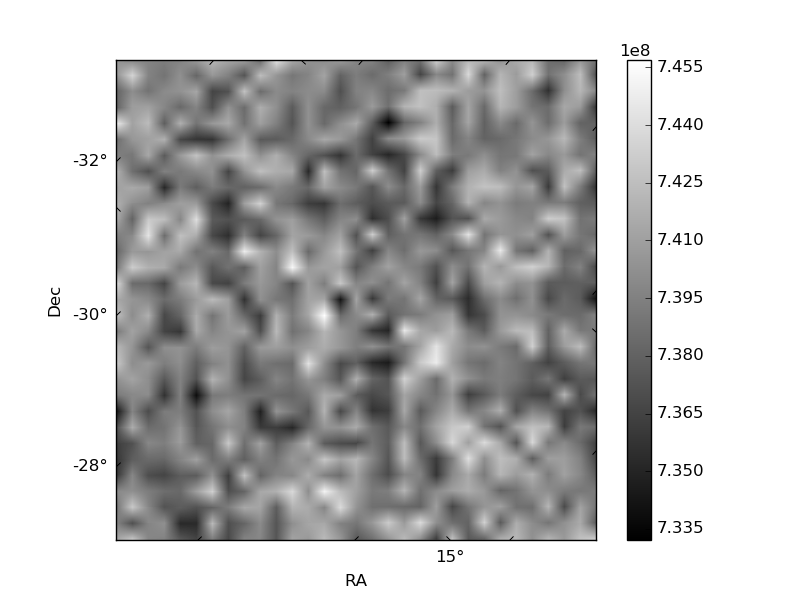
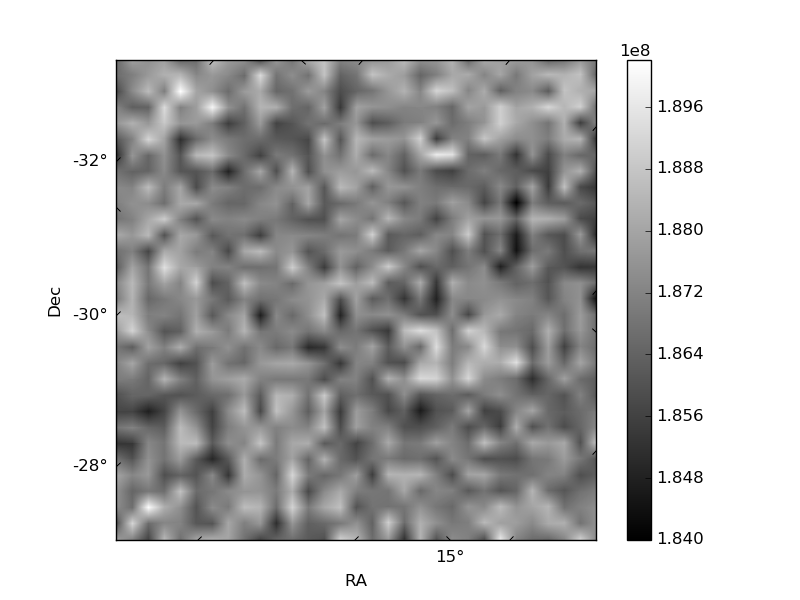
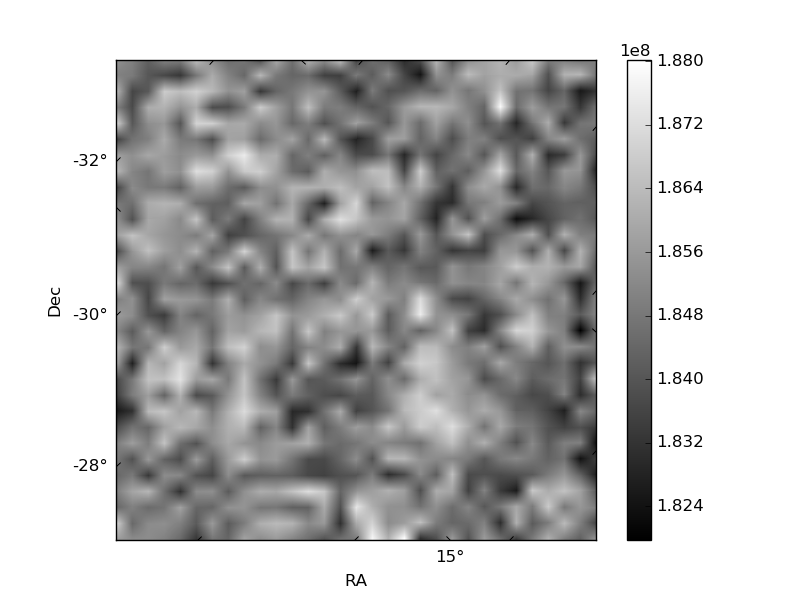
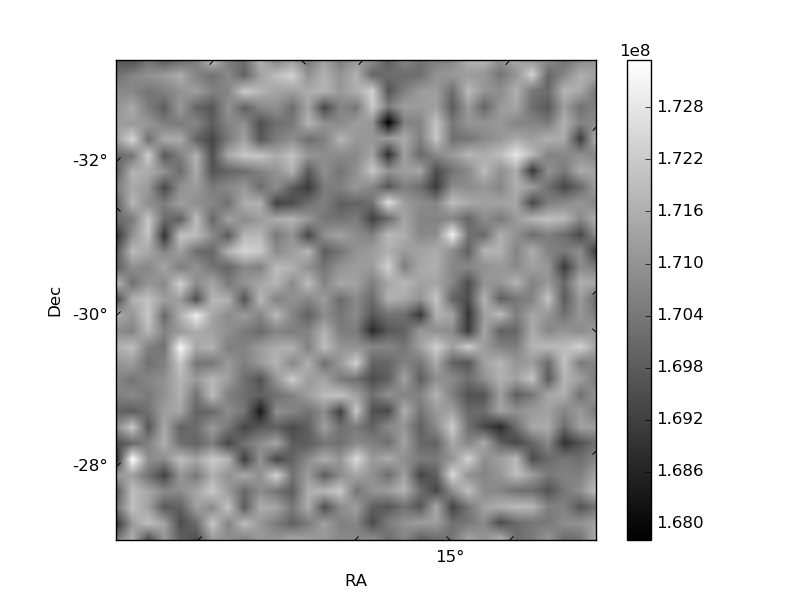
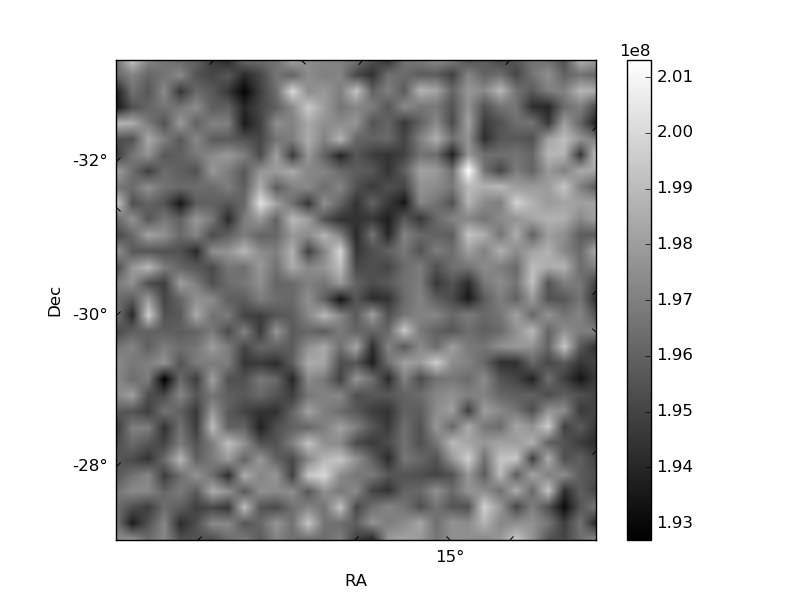
Histogram calculated using DETX and DETY for each event in the final _common_clean file
| Quadrant A | 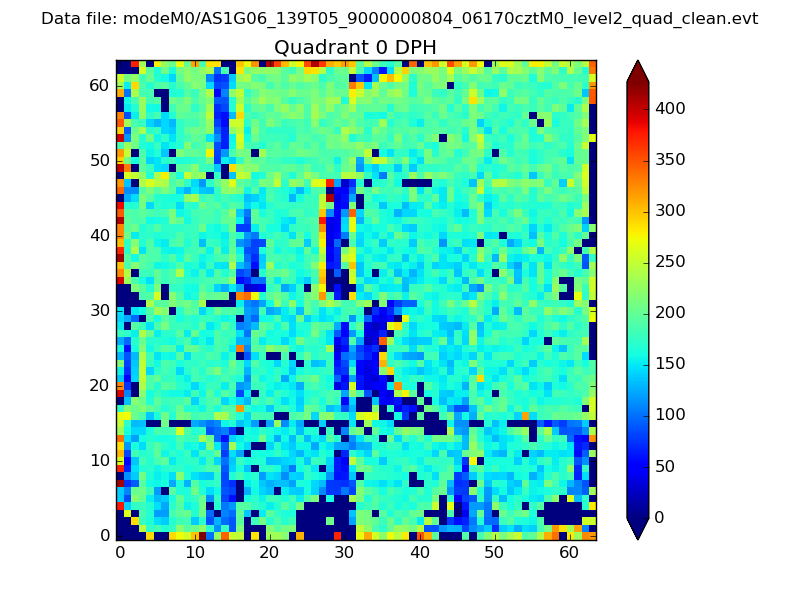 |
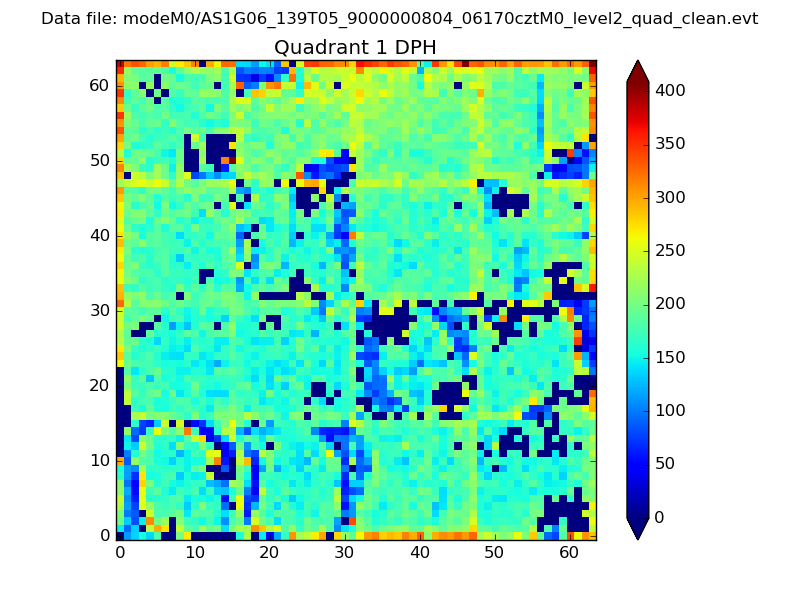 |
Quadrant B |
|---|---|---|---|
| Quadrant D | 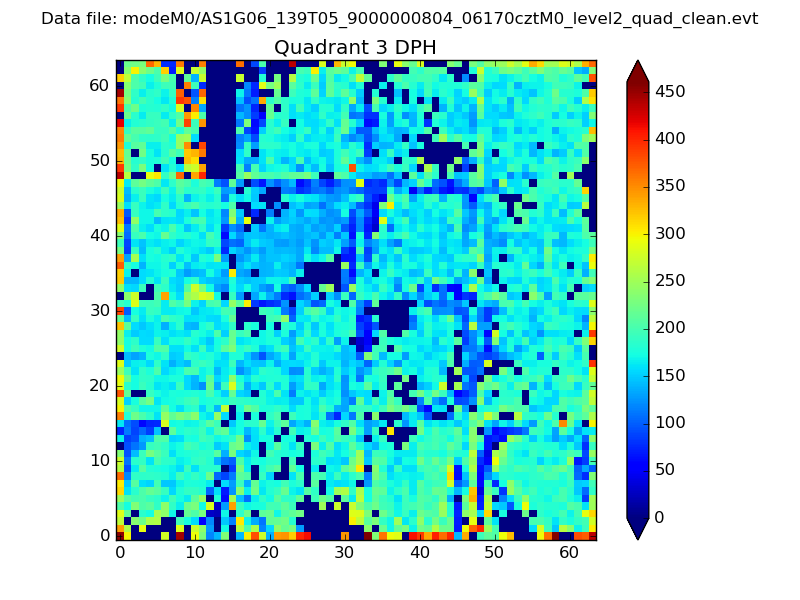 |
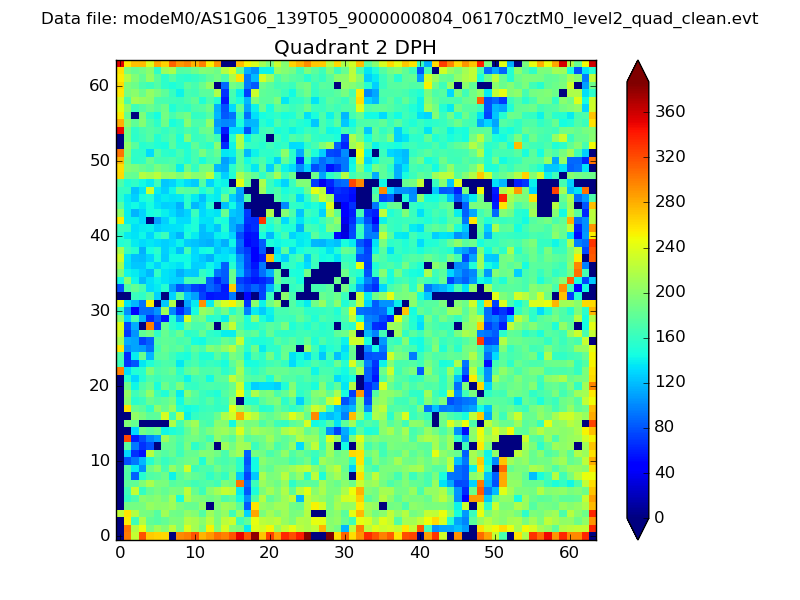 |
Quadrant C |
| Plot type | Count rate plots | Images |
|---|---|---|
| Comparison with Poisson distribution Blue bars denote a histogram of data divided into 1 sec bins. Red curve is a Poisson curve with rate = median count rate of data. |
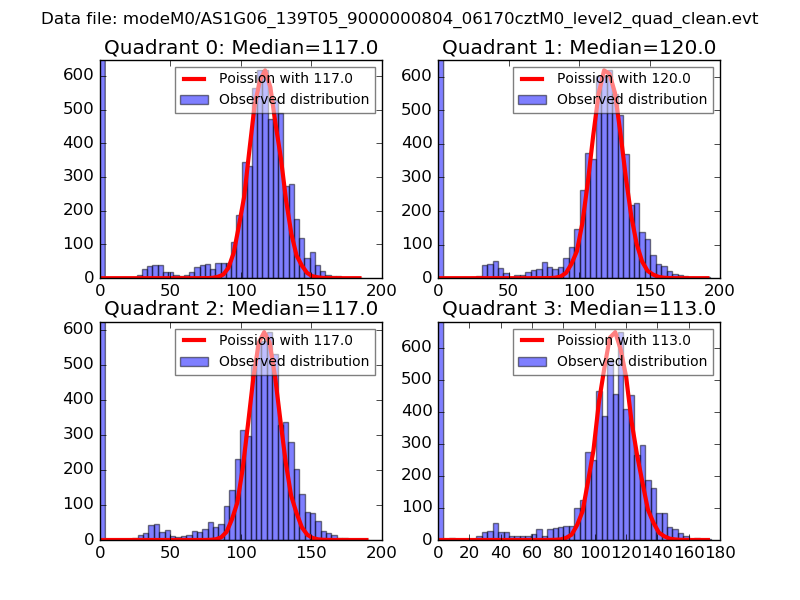 |
 |
| Quadrant-wise count rates Data is divided into 100 sec bins |
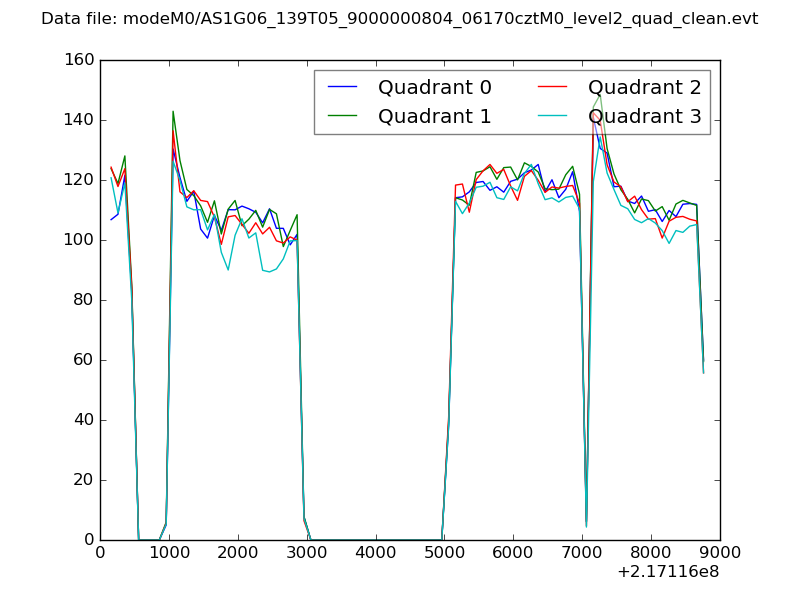 |
|
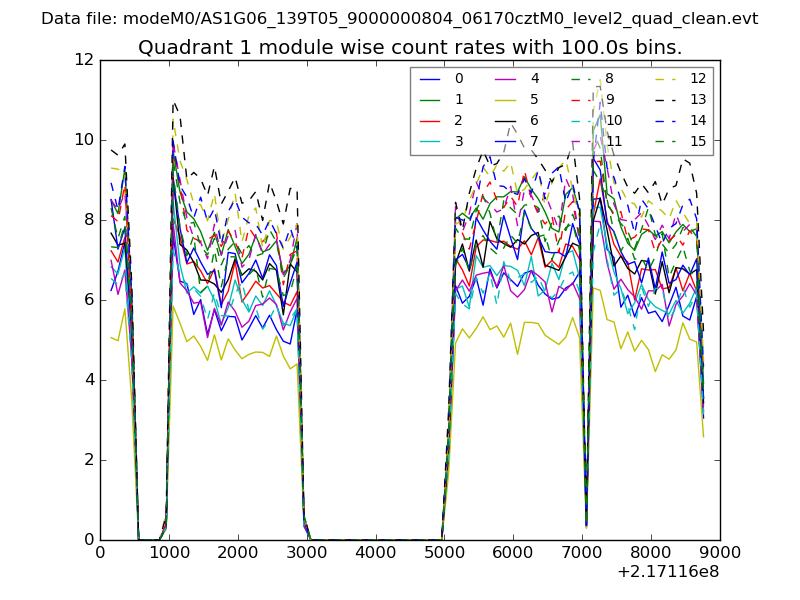
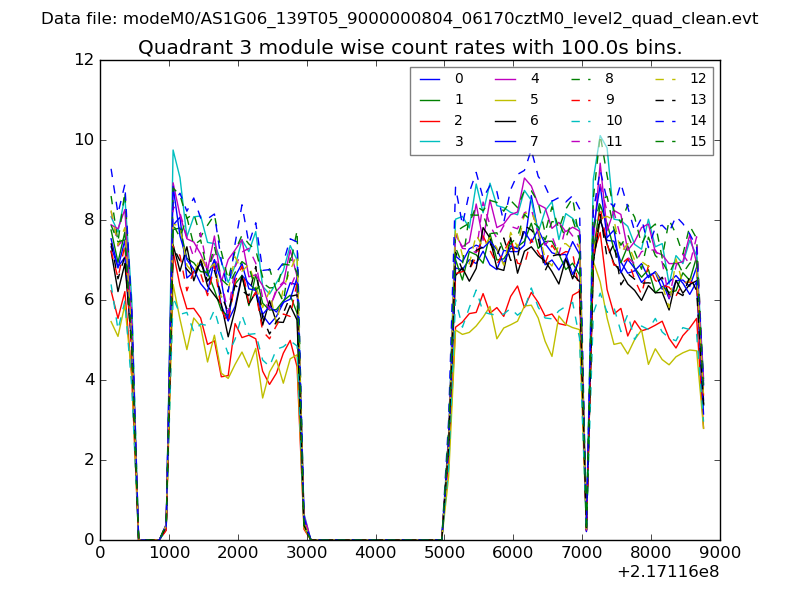
| Module-wise count rates for Quadrant A Data is divided into 100 sec bins |
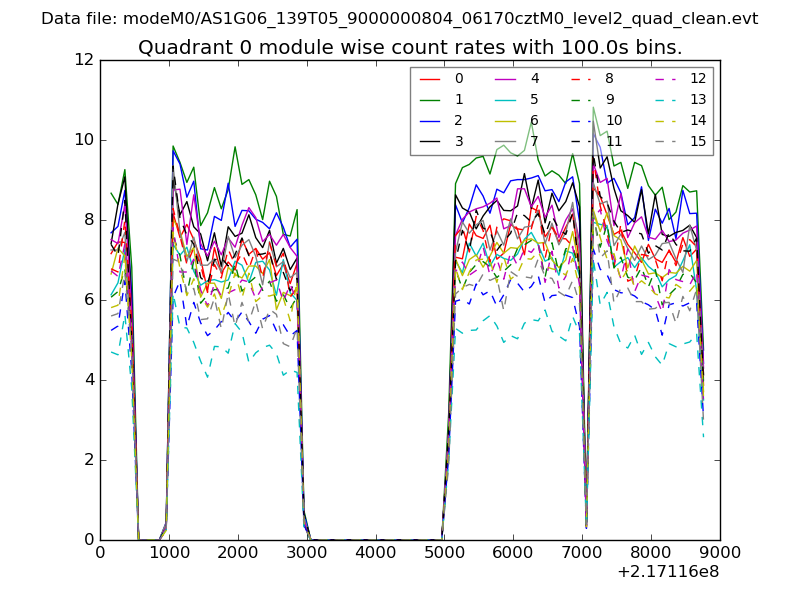 |
 |
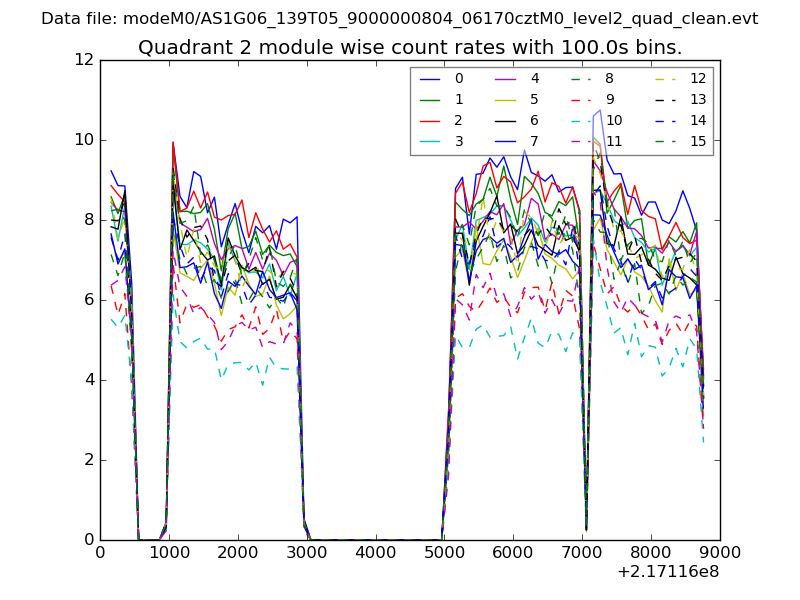
| Module-wise count rates for Quadrant B Data is divided into 100 sec bins |
 |
 |
| Module-wise count rates for Quadrant C Data is divided into 100 sec bins |
 |
 |
| Module-wise count rates for Quadrant D Data is divided into 100 sec bins |
 |
 |
| Parameter | Plot |
|---|---|
| CZT HV Monitor | 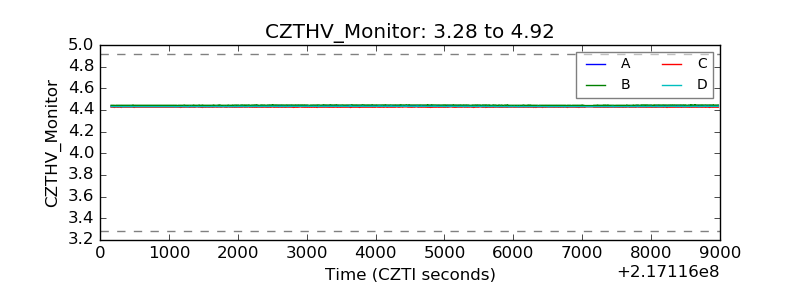 |
| D_VDD | 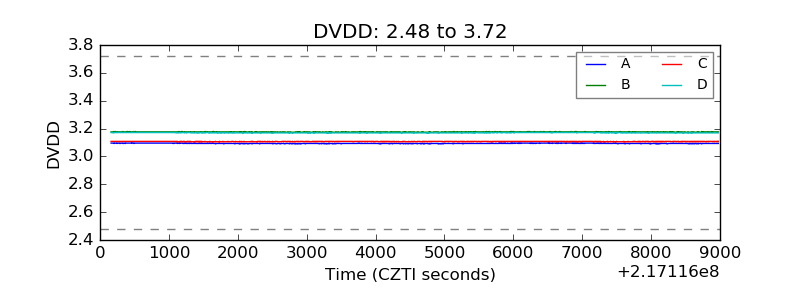 |
| Temperature 1 | 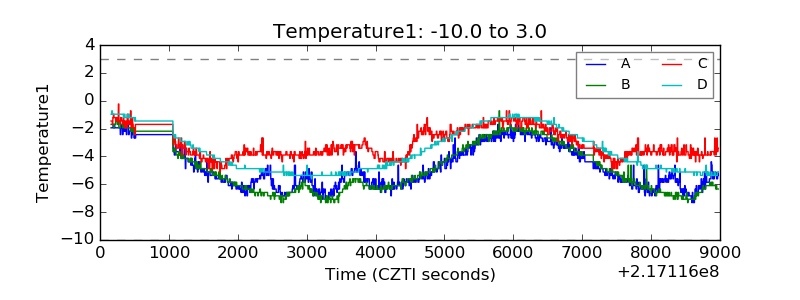 |
| Veto HV Monitor | 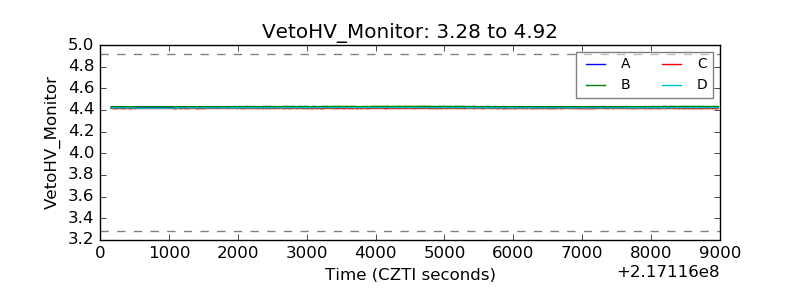 |
| Veto LLD | 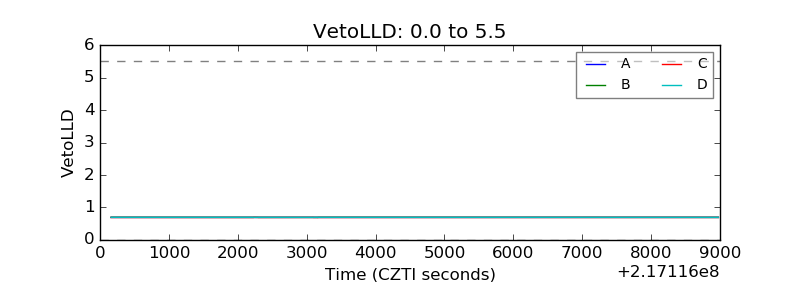 |
| Alpha Counter | 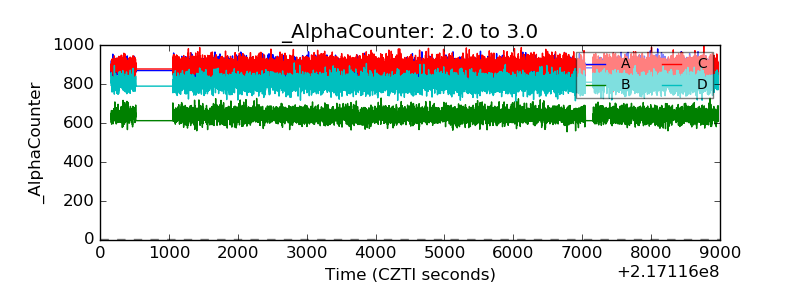 |
| _CPM_Rate | 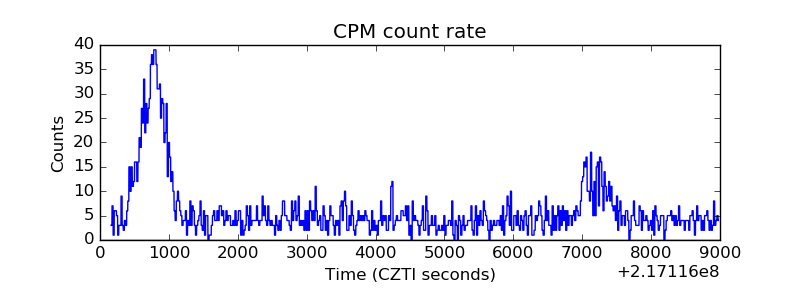 |
| CZT Counter | 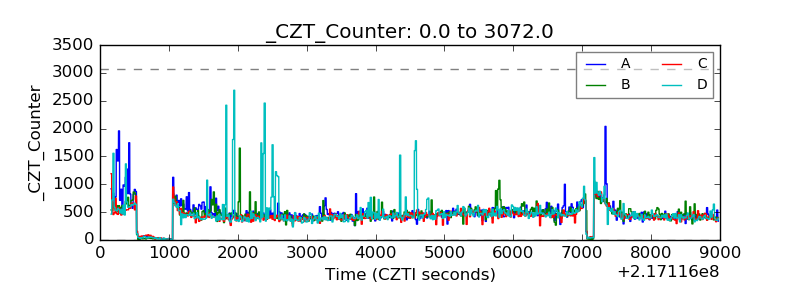 |
| +2.5 Volts monitor |  |
| +5 Volts monitor |  |
| _ROLL_ROT | 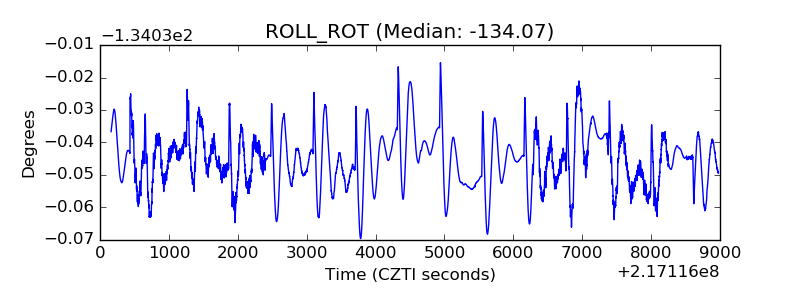 |
| _Roll_DEC | 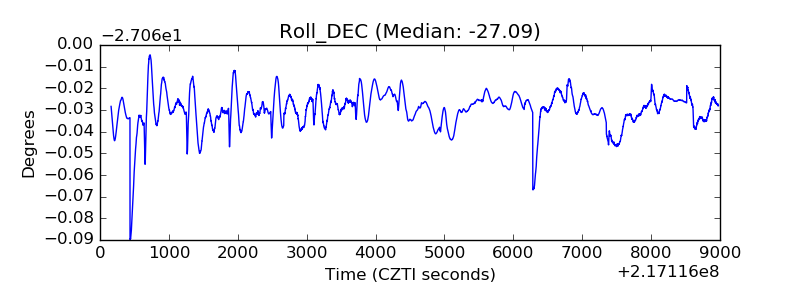 |
| _Roll_RA | 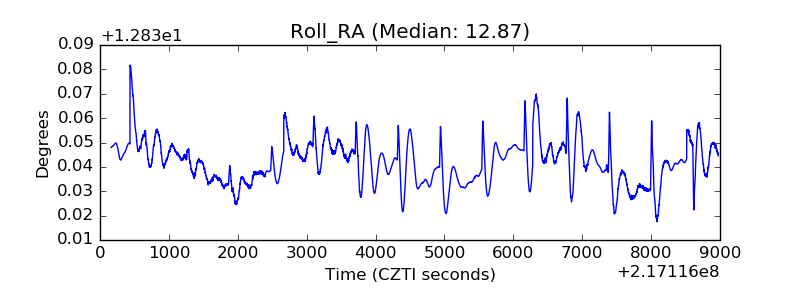 |
| Veto Counter | 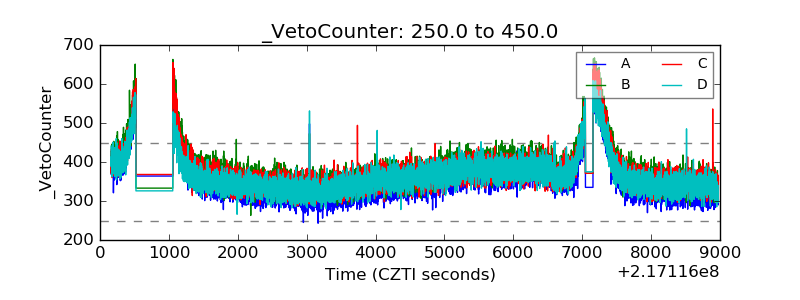 |