| Param | Original file | Final file |
|---|---|---|
| Filename | modeM0/AS1G06_139T05_9000000804_06175cztM0_level2.evt | modeM0/AS1G06_139T05_9000000804_06175cztM0_level2_quad_clean.evt |
| Size (bytes) | 542,963,520 | 84,870,720 |
| Size | 517.8 MB | 80.9 MB |
| Events in quadrant A | 4,423,623 | 508,636 |
| Events in quadrant B | 4,282,453 | 516,562 |
| Events in quadrant C | 3,614,953 | 516,658 |
| Events in quadrant D | 3,607,909 | 500,575 |
| Mode M9 | |||
|---|---|---|---|
| Quadrant | BADHDUFLAG | Total packets | Discarded packets |
| A | 0 | 16 | 0 |
| B | 0 | 16 | 0 |
| C | 0 | 16 | 0 |
| D | 0 | 16 | 0 |
| Mode SS | |||
|---|---|---|---|
| Quadrant | BADHDUFLAG | Total packets | Discarded packets |
| A | 0 | 158 | 2 |
| B | 0 | 158 | 2 |
| C | 0 | 158 | 0 |
| D | 0 | 158 | 0 |
| Mode M0 | |||
|---|---|---|---|
| Quadrant | BADHDUFLAG | Total packets | Discarded packets |
| A | 0 | 18350 | 280 |
| B | 0 | 17987 | 297 |
| C | 0 | 16149 | 234 |
| D | 0 | 16366 | 200 |
| Quadrant | Total seconds | Saturated seconds | Saturation percentage |
|---|---|---|---|
| A | 7561 | 175 | 2.314509% |
| B | 7553 | 422 | 5.587184% |
| C | 7571 | 133 | 1.756703% |
| D | 7584 | 145 | 1.911920% |
Noise dominated data is calculated using 1-second bins in cleaned event files. If a bin has >2000 counts, and if more than 50% of those come from <1% of pixels, then it is considered to be noise-dominated and hence unusable.
| Quadrant | # 1 sec bins | Bins with >0 counts | Bins with >2000 counts | High rate bins dominated by noise | Noise dominated (total time) | Noise dominated (detector-on time) | Marked lightcurve |
|---|---|---|---|---|---|---|---|
| A | 9323 | 7668 | 0 | 0 | 0.00% | 0.00% | 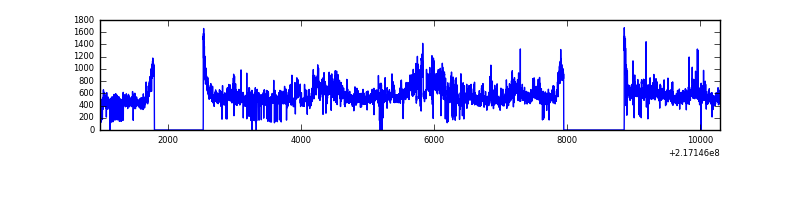 |
| B | 9323 | 7661 | 195 | 195 | 2.09% | 2.55% | 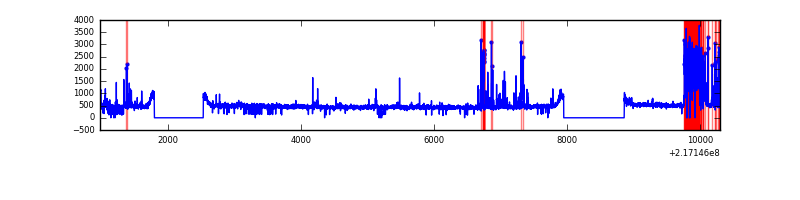 |
| C | 9323 | 7670 | 0 | 0 | 0.00% | 0.00% | 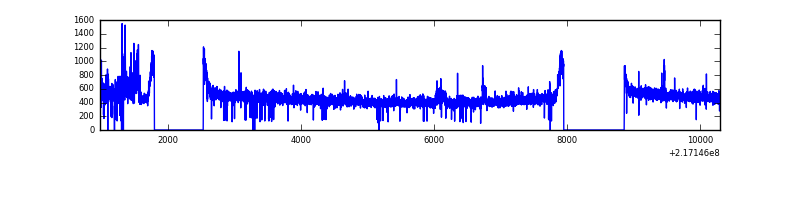 |
| D | 9323 | 7673 | 7 | 7 | 0.08% | 0.09% | 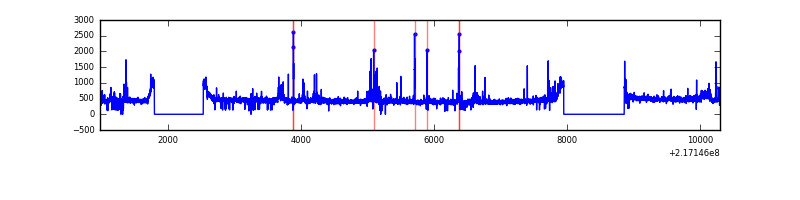 |
Top three noisy pixels from each quadrant. If the there are fewer than three noisy pixels in the level2.evt file, extra rows are filled as -1
| Pixel properties | Quadrant properties | ||||||
|---|---|---|---|---|---|---|---|
| Quadrant | DetID | PixID | Counts | Sigma | Mean | Median | Sigma |
| A | 13 | 34 | 686842 | 3715.89 | 900 | 878 | 184.6 |
| A | 15 | 234 | 187650 | 1011.75 | 900 | 878 | 184.6 |
| A | 8 | 15 | 57407 | 306.22 | 900 | 878 | 184.6 |
| B | 3 | 64 | 753652 | 4283.71 | 898 | 873 | 175.7 |
| B | 12 | 111 | 18100 | 98.03 | 898 | 873 | 175.7 |
| B | 15 | 204 | 14736 | 78.89 | 898 | 873 | 175.7 |
| C | 12 | 16 | 152230 | 731.27 | 885 | 889 | 207.0 |
| C | 1 | 16 | 7046 | 29.75 | 885 | 889 | 207.0 |
| C | 13 | 61 | 6894 | 29.02 | 885 | 889 | 207.0 |
| D | 2 | 136 | 142704 | 649.66 | 884 | 856 | 218.3 |
| D | 5 | 97 | 28866 | 128.28 | 884 | 856 | 218.3 |
| D | 12 | 233 | 28202 | 125.24 | 884 | 856 | 218.3 |
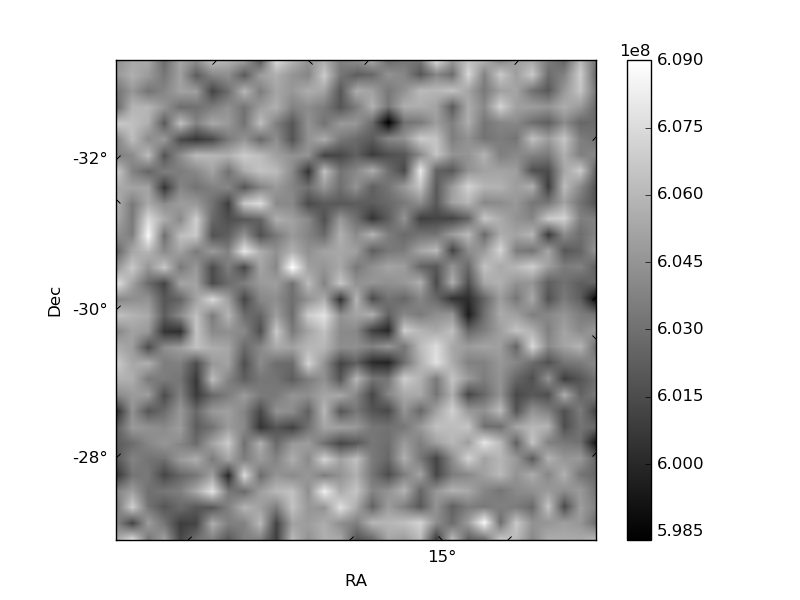
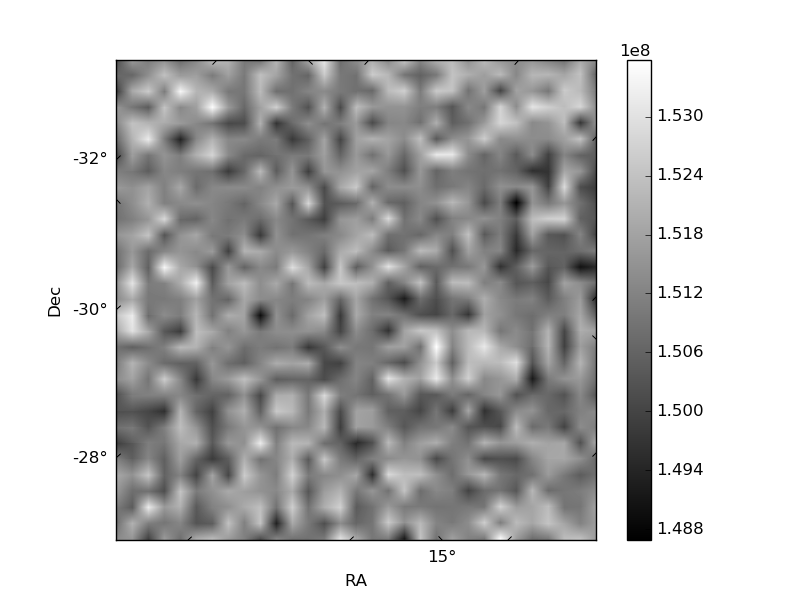
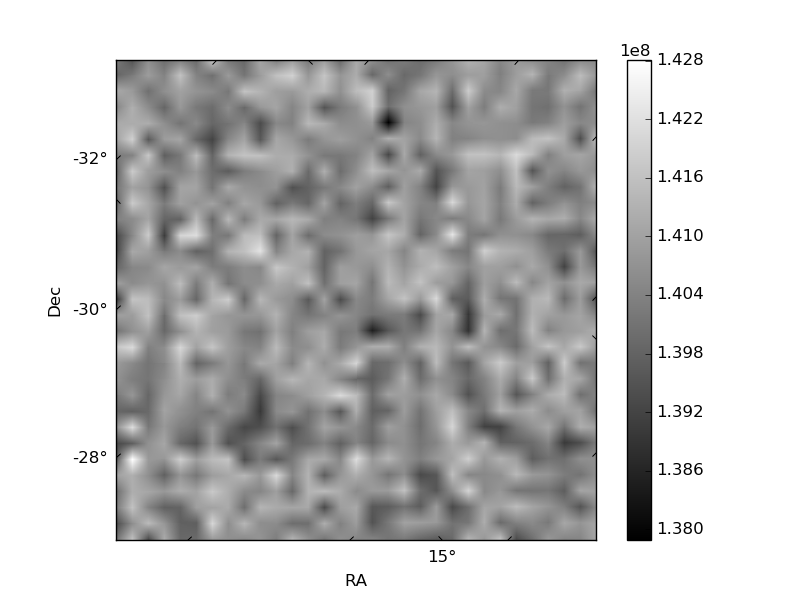
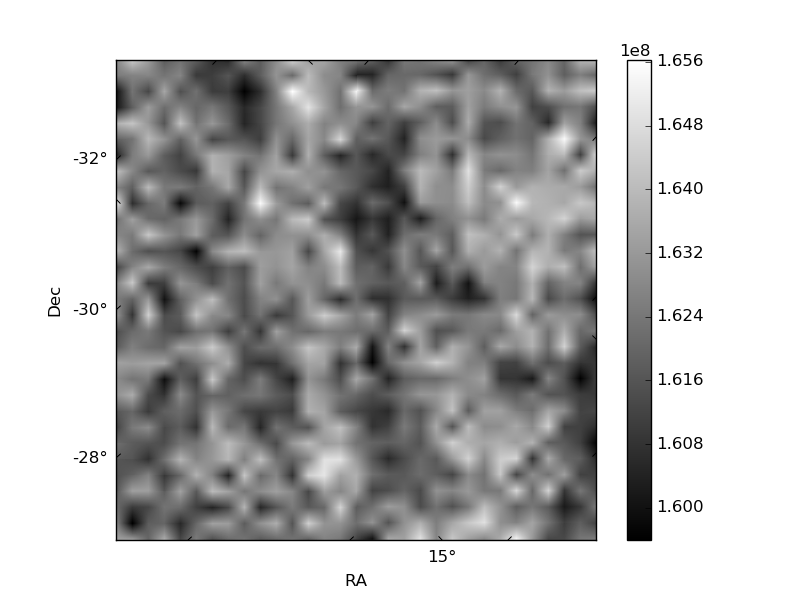
Histogram calculated using DETX and DETY for each event in the final _common_clean file
| Quadrant A | 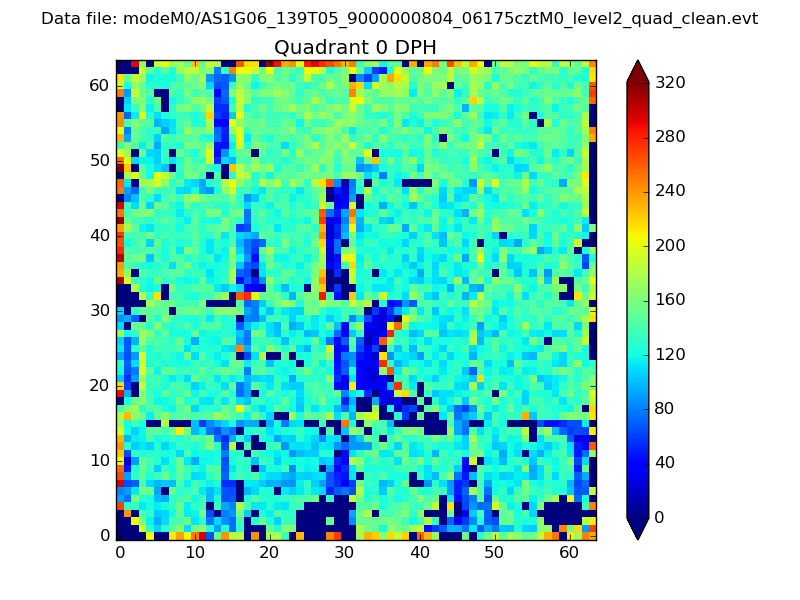 |
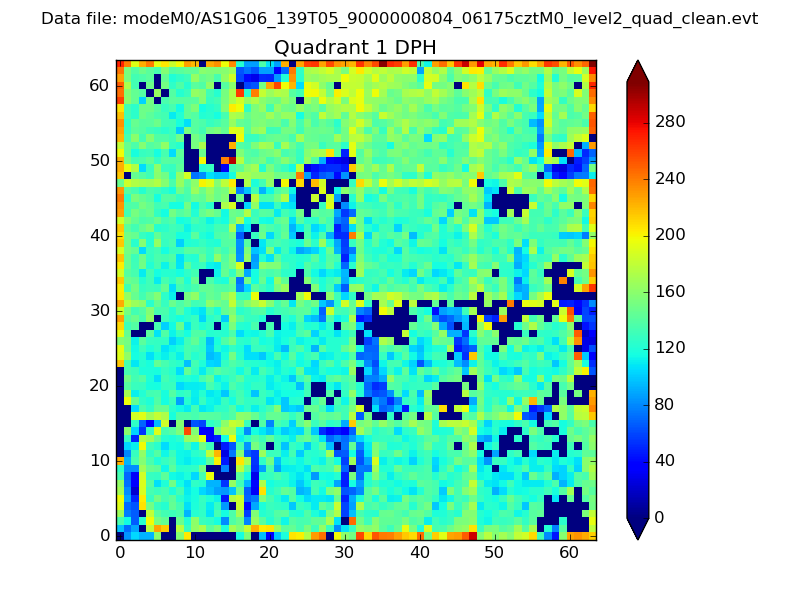 |
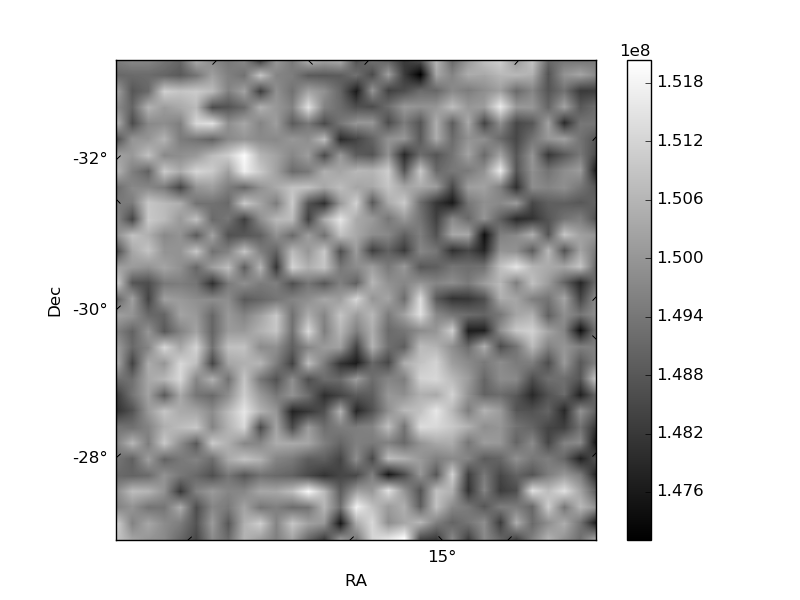
Quadrant B |
|---|---|---|---|
| Quadrant D | 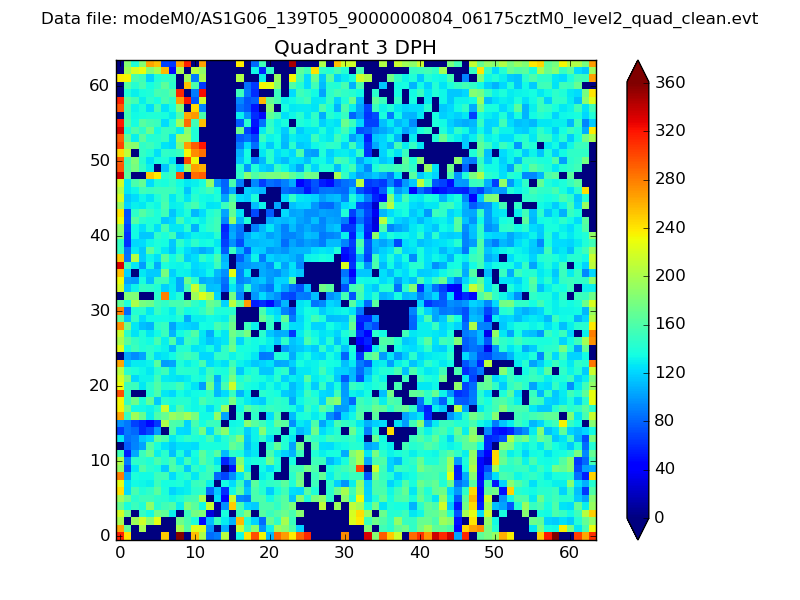 |
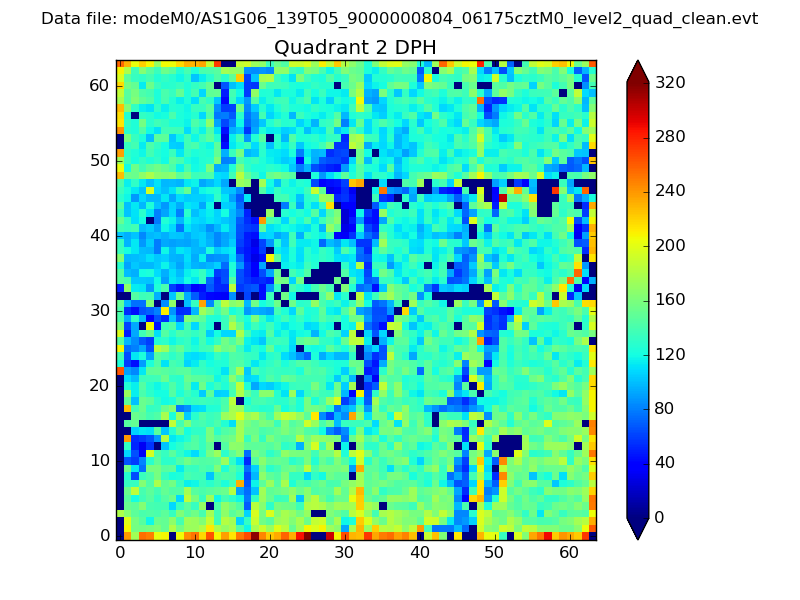 |
Quadrant C |
| Plot type | Count rate plots | Images |
|---|---|---|
| Comparison with Poisson distribution Blue bars denote a histogram of data divided into 1 sec bins. Red curve is a Poisson curve with rate = median count rate of data. |
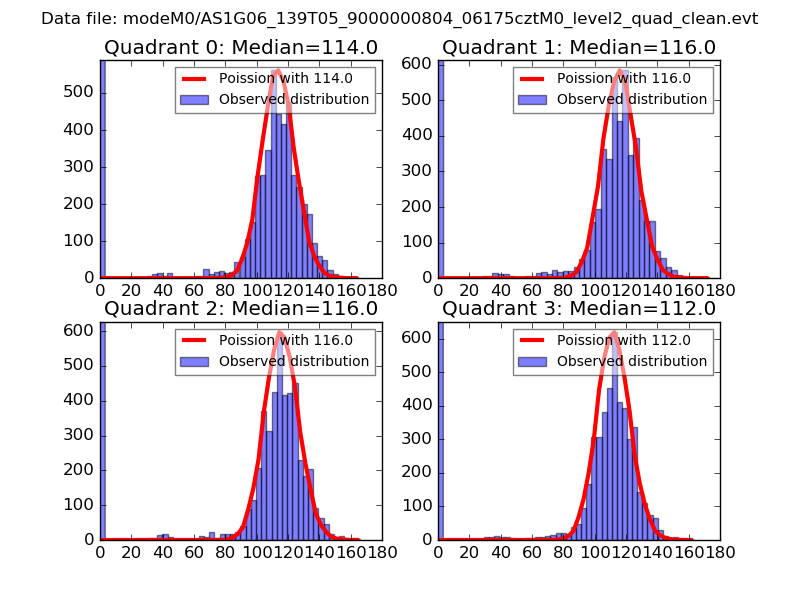 |
 |
| Quadrant-wise count rates Data is divided into 100 sec bins |
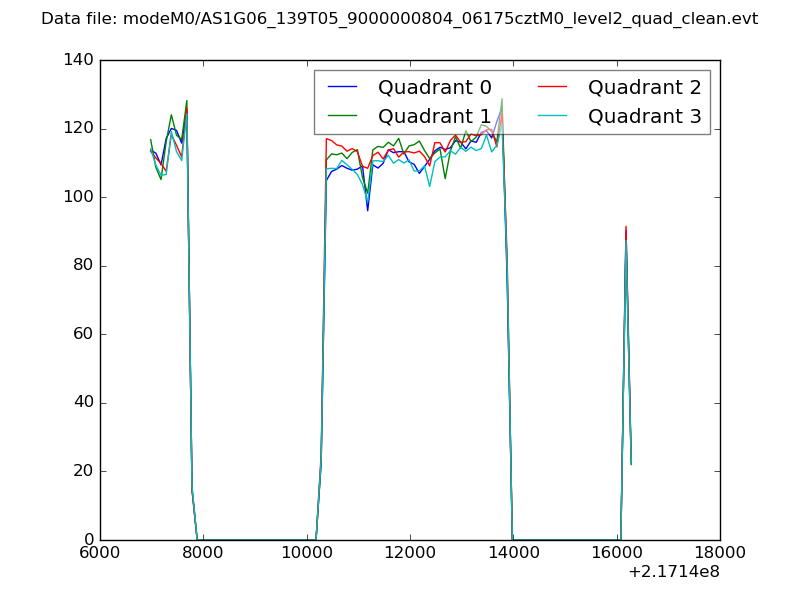 |
|
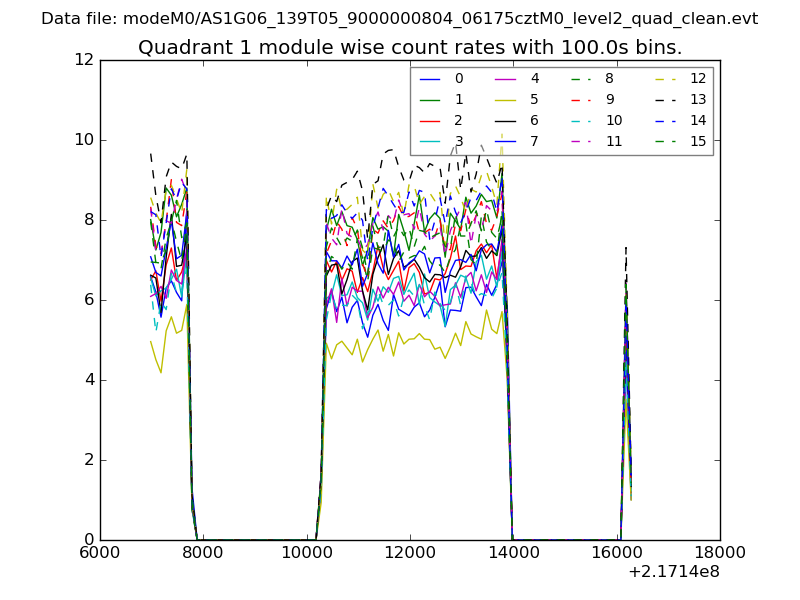
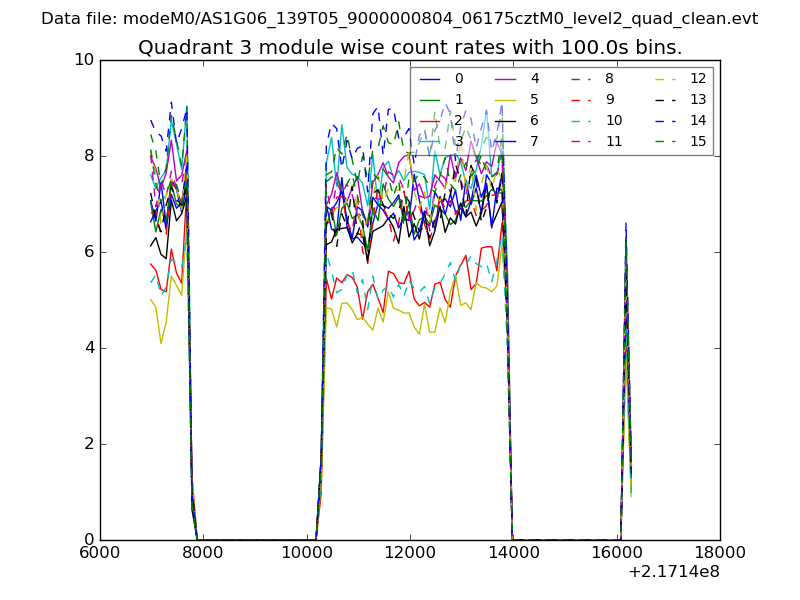
| Module-wise count rates for Quadrant A Data is divided into 100 sec bins |
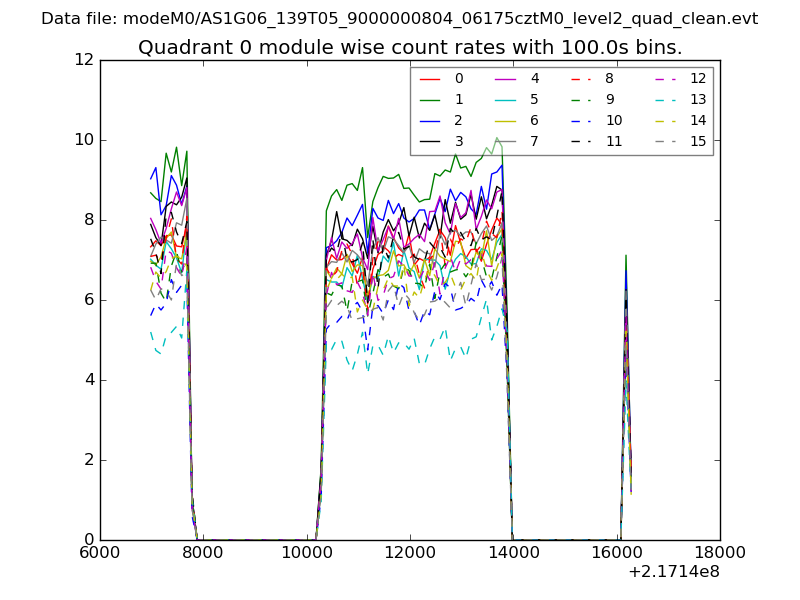 |
 |
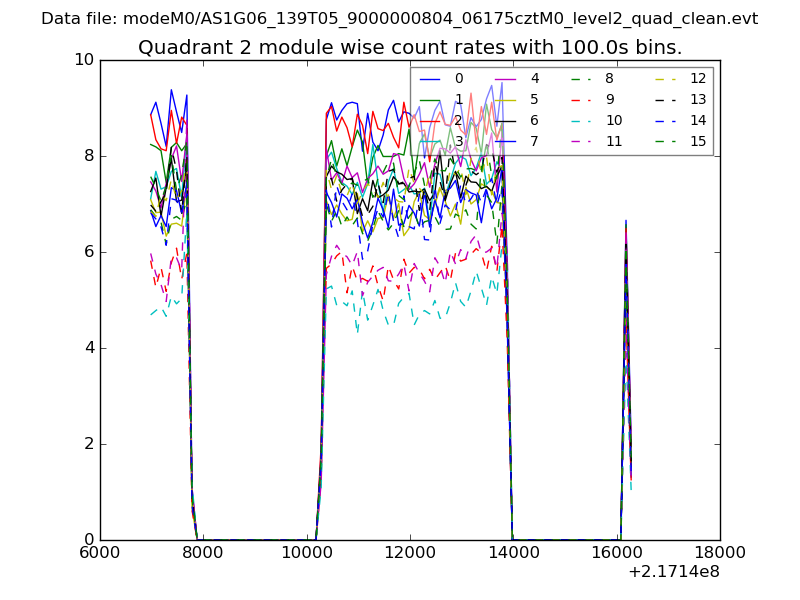
| Module-wise count rates for Quadrant B Data is divided into 100 sec bins |
 |
 |
| Module-wise count rates for Quadrant C Data is divided into 100 sec bins |
 |
 |
| Module-wise count rates for Quadrant D Data is divided into 100 sec bins |
 |
 |
| Parameter | Plot |
|---|---|
| CZT HV Monitor | 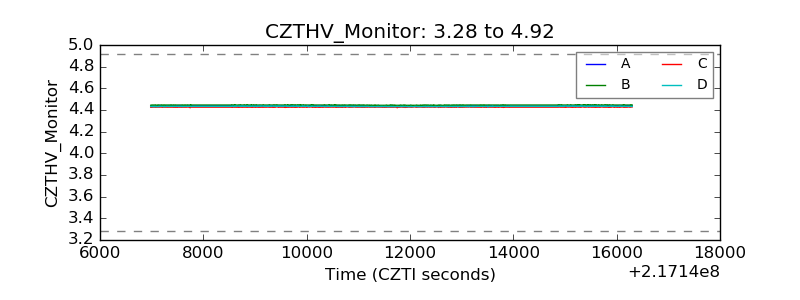 |
| D_VDD | 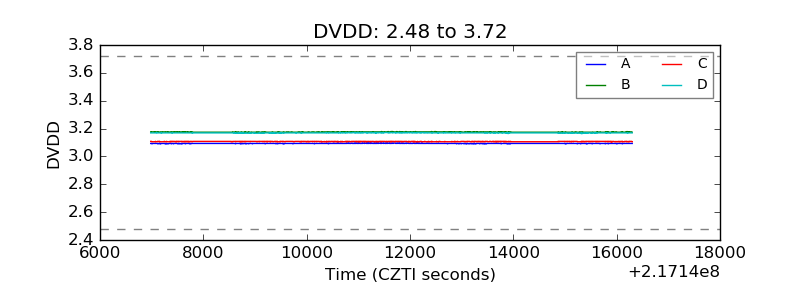 |
| Temperature 1 | 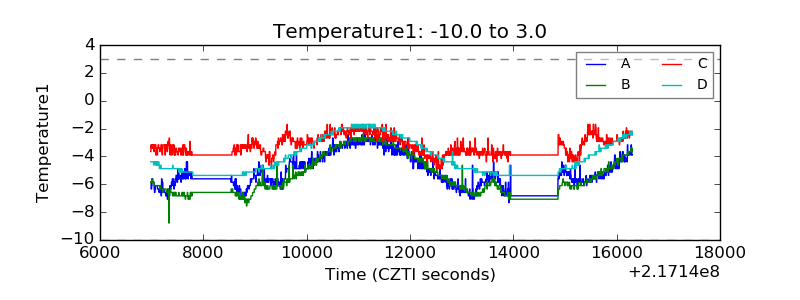 |
| Veto HV Monitor | 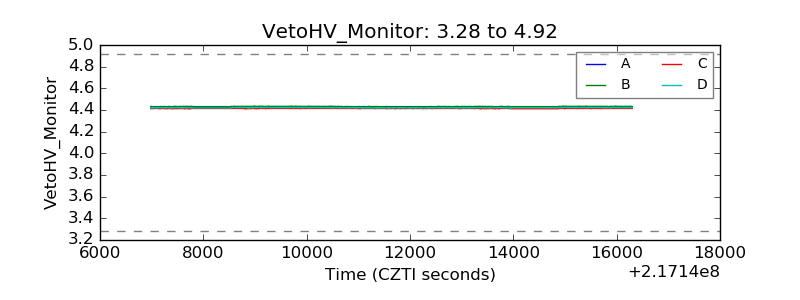 |
| Veto LLD |  |
| Alpha Counter | 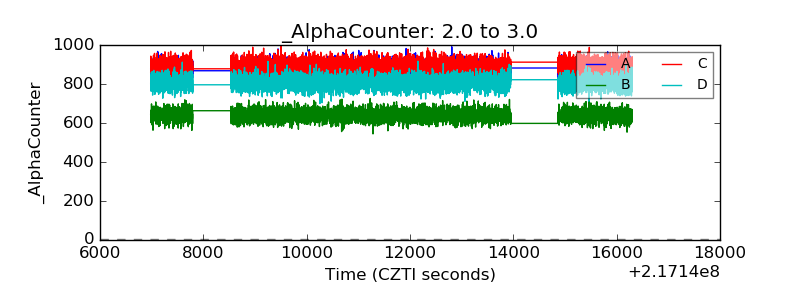 |
| _CPM_Rate | 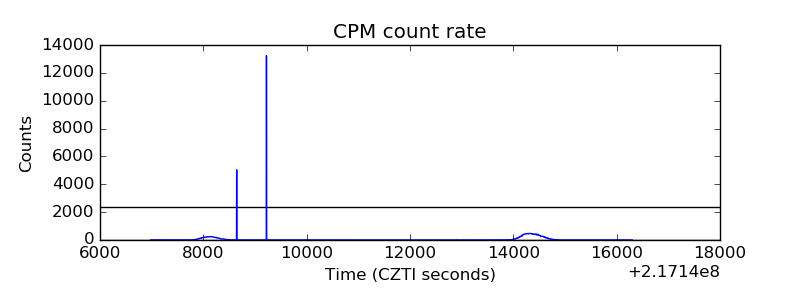 |
| CZT Counter | 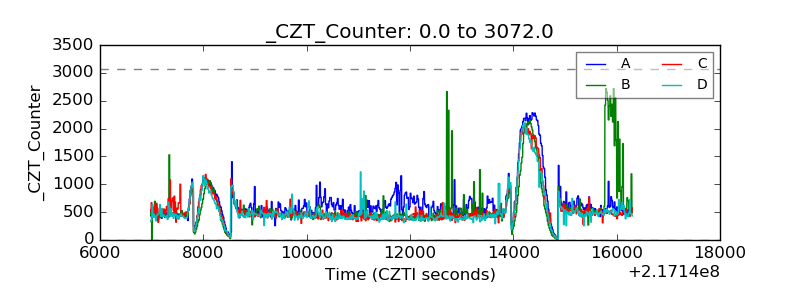 |
| +2.5 Volts monitor |  |
| +5 Volts monitor |  |
| _ROLL_ROT | 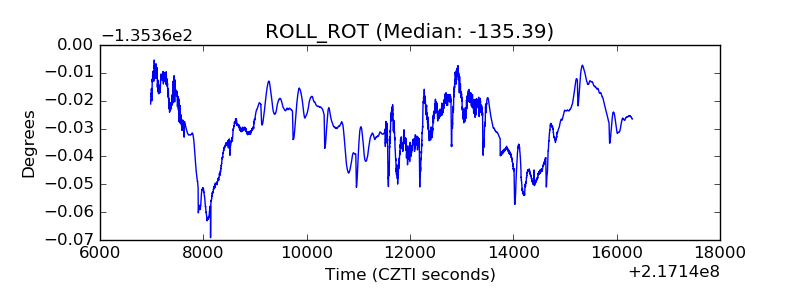 |
| _Roll_DEC | 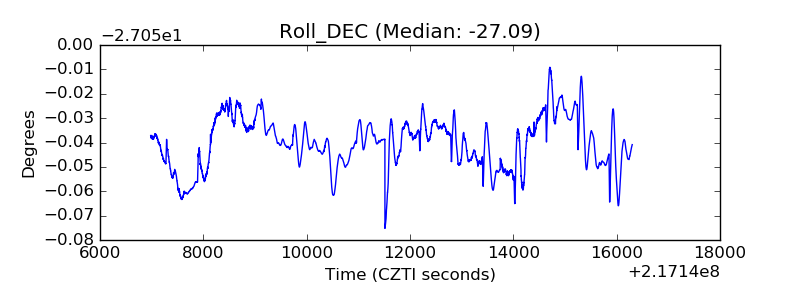 |
| _Roll_RA | 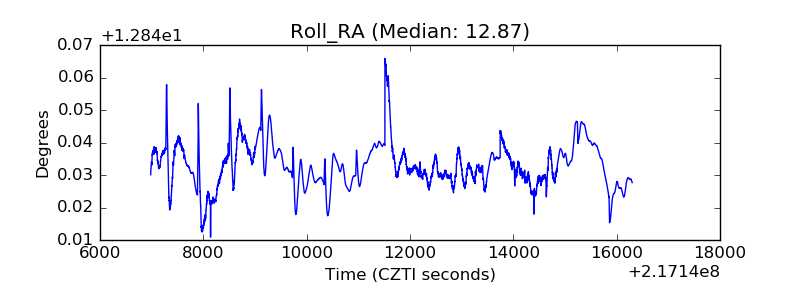 |
| Veto Counter | 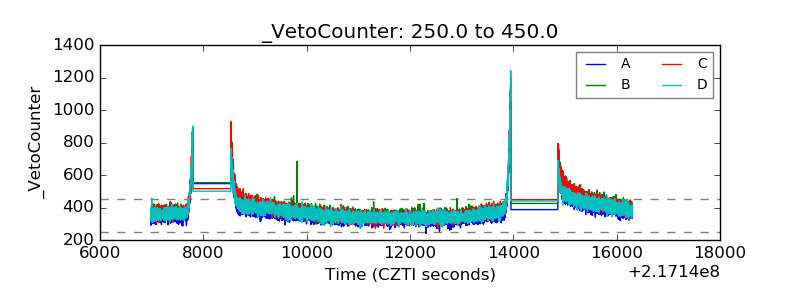 |