| Param | Original file | Final file |
|---|---|---|
| Filename | modeM0/AS1G06_139T05_9000000804_06177cztM0_level2.evt | modeM0/AS1G06_139T05_9000000804_06177cztM0_level2_quad_clean.evt |
| Size (bytes) | 459,002,880 | 80,017,920 |
| Size | 437.7 MB | 76.3 MB |
| Events in quadrant A | 3,294,293 | 494,124 |
| Events in quadrant B | 3,978,901 | 500,130 |
| Events in quadrant C | 2,999,321 | 497,142 |
| Events in quadrant D | 3,186,763 | 478,826 |
| Mode M9 | |||
|---|---|---|---|
| Quadrant | BADHDUFLAG | Total packets | Discarded packets |
| A | 0 | 17 | 1 |
| B | 0 | 17 | 0 |
| C | 0 | 17 | 2 |
| D | 0 | 18 | 1 |
| Mode SS | |||
|---|---|---|---|
| Quadrant | BADHDUFLAG | Total packets | Discarded packets |
| A | 0 | 134 | 2 |
| B | 0 | 134 | 2 |
| C | 0 | 134 | 6 |
| D | 0 | 134 | 2 |
| Mode M0 | |||
|---|---|---|---|
| Quadrant | BADHDUFLAG | Total packets | Discarded packets |
| A | 0 | 14416 | 404 |
| B | 0 | 16449 | 405 |
| C | 0 | 13714 | 305 |
| D | 0 | 14079 | 285 |
| Quadrant | Total seconds | Saturated seconds | Saturation percentage |
|---|---|---|---|
| A | 6484 | 74 | 1.141271% |
| B | 6495 | 356 | 5.481139% |
| C | 6500 | 45 | 0.692308% |
| D | 6505 | 56 | 0.860876% |
Noise dominated data is calculated using 1-second bins in cleaned event files. If a bin has >2000 counts, and if more than 50% of those come from <1% of pixels, then it is considered to be noise-dominated and hence unusable.
| Quadrant | # 1 sec bins | Bins with >0 counts | Bins with >2000 counts | High rate bins dominated by noise | Noise dominated (total time) | Noise dominated (detector-on time) | Marked lightcurve |
|---|---|---|---|---|---|---|---|
| A | 7733 | 6598 | 0 | 0 | 0.00% | 0.00% | 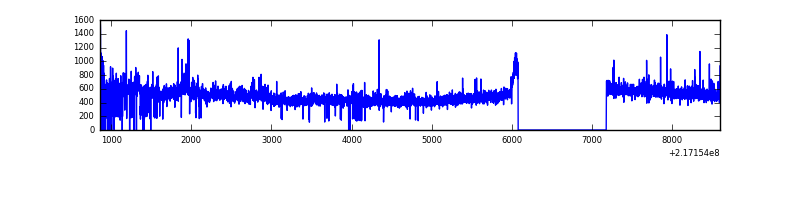 |
| B | 7733 | 6613 | 215 | 215 | 2.78% | 3.25% | 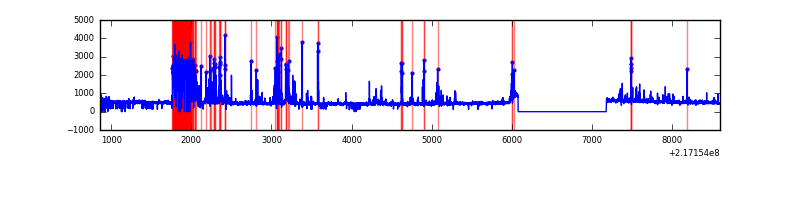 |
| C | 7733 | 6609 | 0 | 0 | 0.00% | 0.00% | 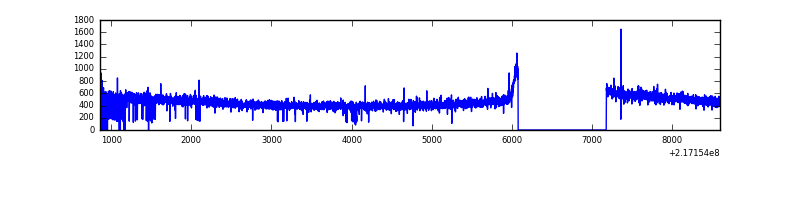 |
| D | 7733 | 6615 | 5 | 5 | 0.06% | 0.08% | 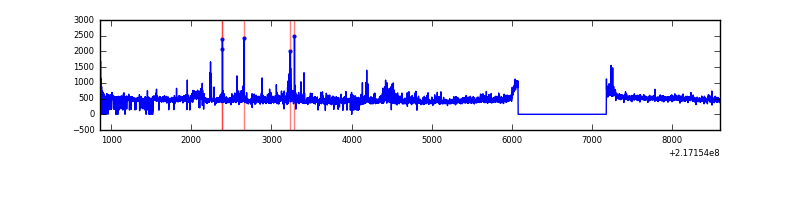 |
Top three noisy pixels from each quadrant. If the there are fewer than three noisy pixels in the level2.evt file, extra rows are filled as -1
| Pixel properties | Quadrant properties | ||||||
|---|---|---|---|---|---|---|---|
| Quadrant | DetID | PixID | Counts | Sigma | Mean | Median | Sigma |
| A | 13 | 34 | 137772 | 858.62 | 781 | 764 | 159.6 |
| A | 8 | 15 | 94112 | 585.01 | 781 | 764 | 159.6 |
| A | 15 | 234 | 46948 | 289.43 | 781 | 764 | 159.6 |
| B | 3 | 64 | 905407 | 6142.87 | 773 | 755 | 147.3 |
| B | 4 | 80 | 56332 | 377.39 | 773 | 755 | 147.3 |
| B | 12 | 111 | 14857 | 95.76 | 773 | 755 | 147.3 |
| C | 12 | 16 | 26512 | 146.88 | 759 | 762 | 175.3 |
| C | 1 | 16 | 6064 | 30.24 | 759 | 762 | 175.3 |
| C | 13 | 61 | 5866 | 29.11 | 759 | 762 | 175.3 |
| D | 2 | 136 | 134720 | 715.7 | 760 | 735 | 187.2 |
| D | 12 | 110 | 111218 | 590.16 | 760 | 735 | 187.2 |
| D | 5 | 97 | 29580 | 154.08 | 760 | 735 | 187.2 |
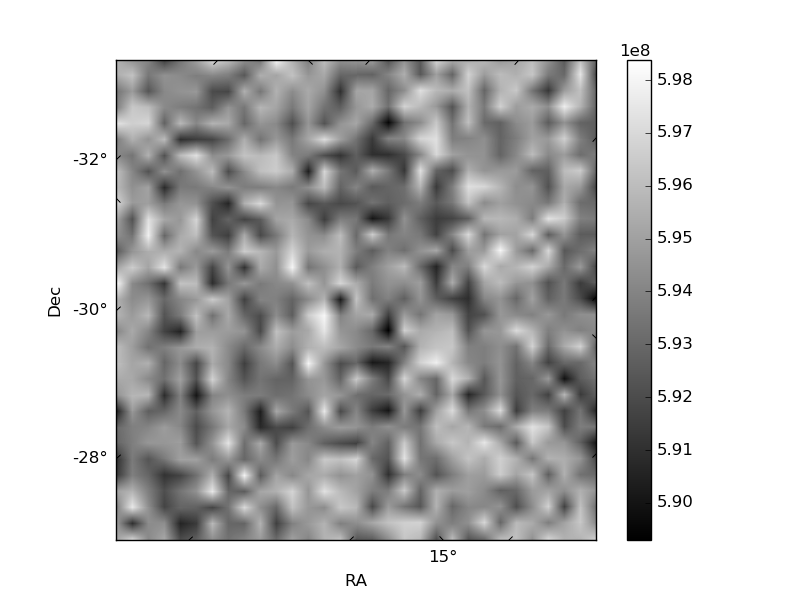
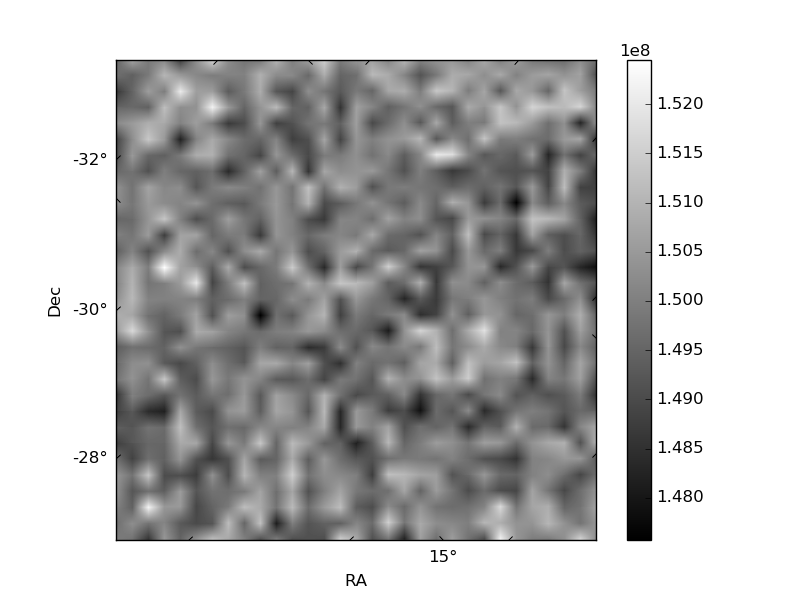
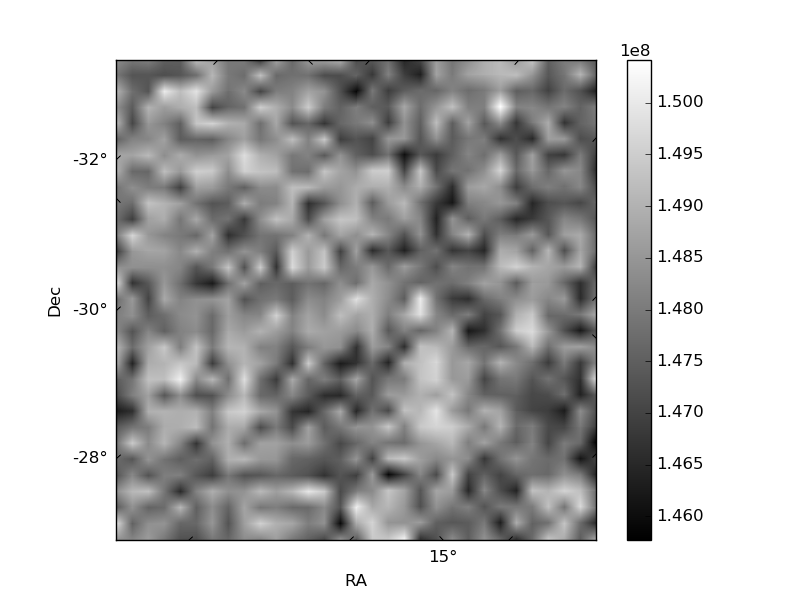
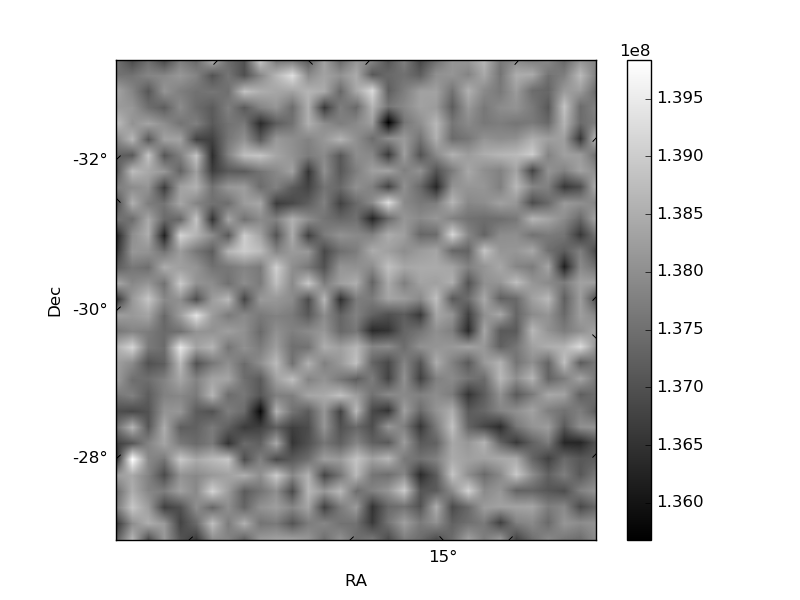
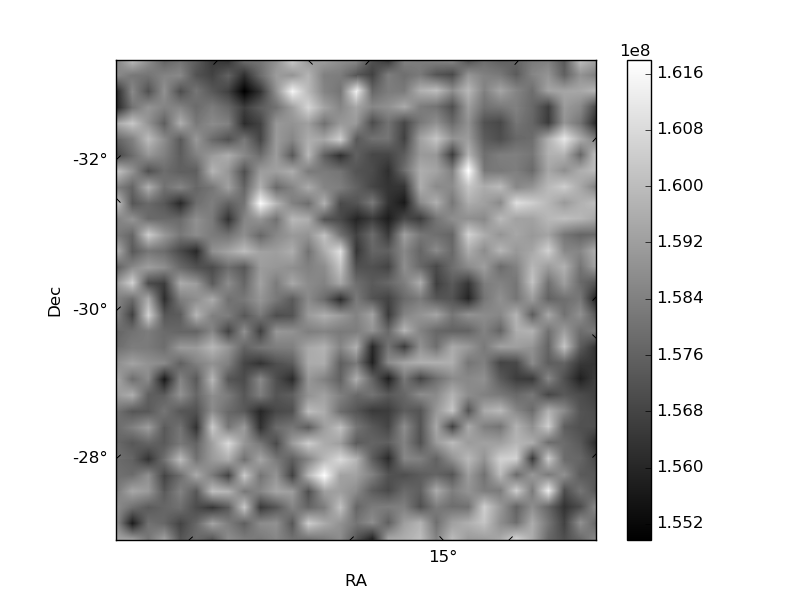
Histogram calculated using DETX and DETY for each event in the final _common_clean file
| Quadrant A | 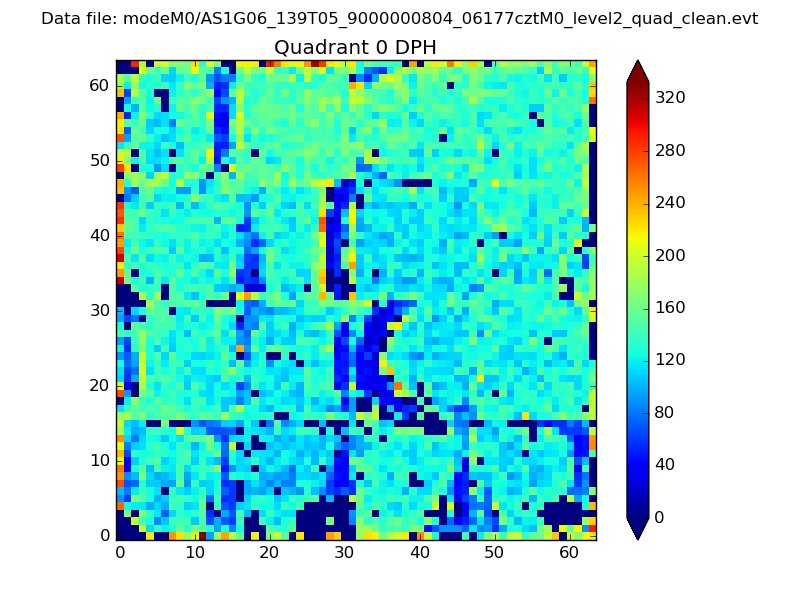 |
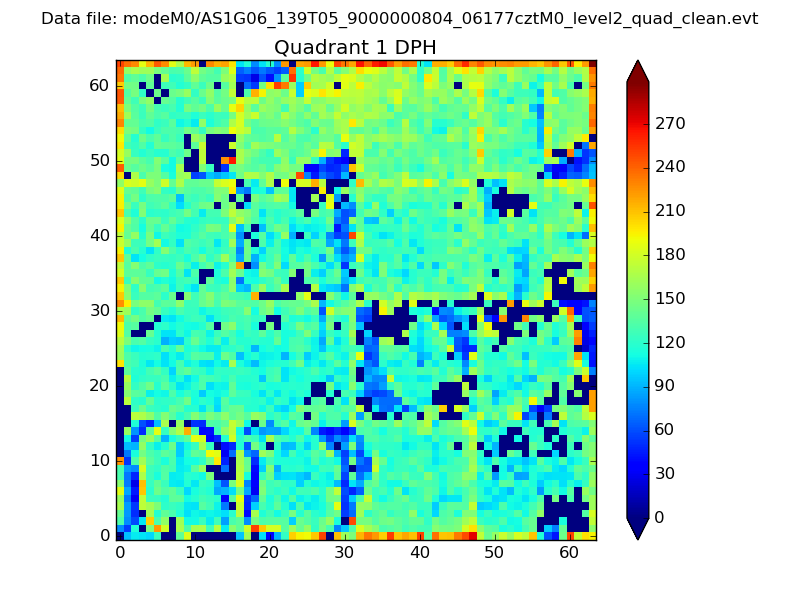 |
Quadrant B |
|---|---|---|---|
| Quadrant D | 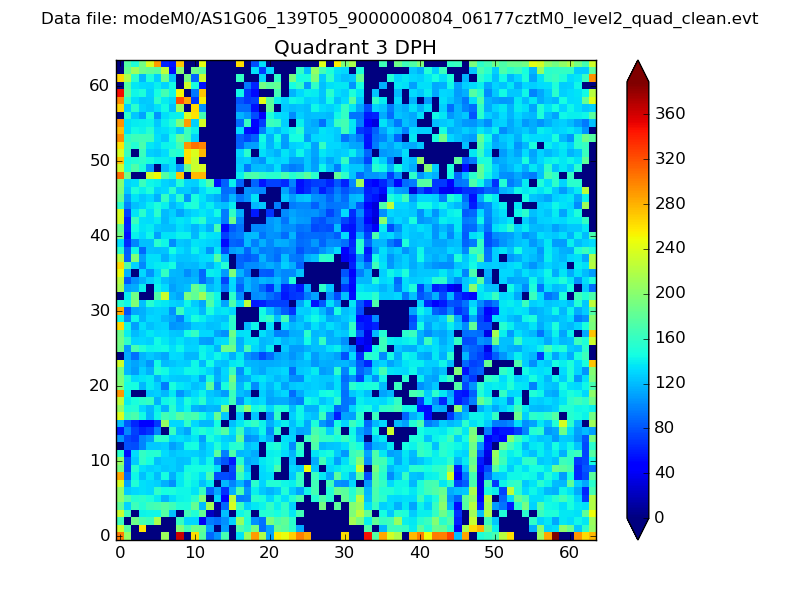 |
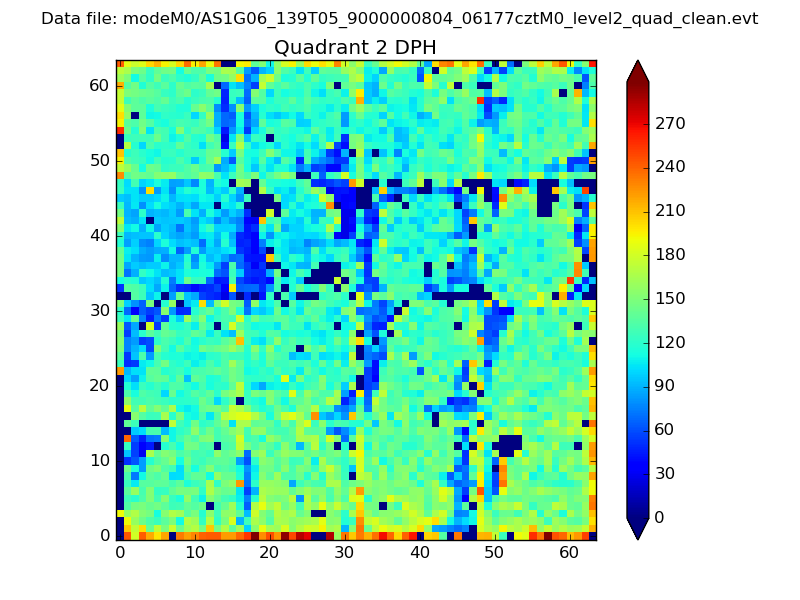 |
Quadrant C |
| Plot type | Count rate plots | Images |
|---|---|---|
| Comparison with Poisson distribution Blue bars denote a histogram of data divided into 1 sec bins. Red curve is a Poisson curve with rate = median count rate of data. |
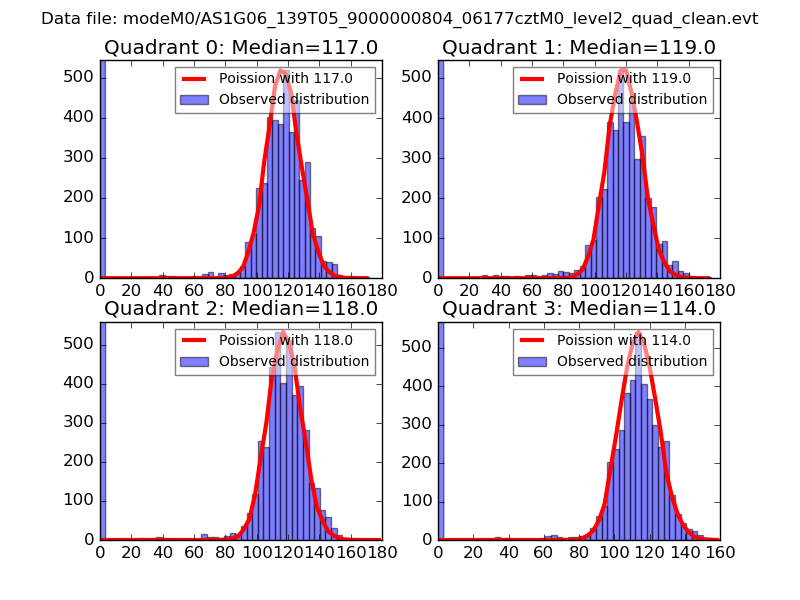 |
 |
| Quadrant-wise count rates Data is divided into 100 sec bins |
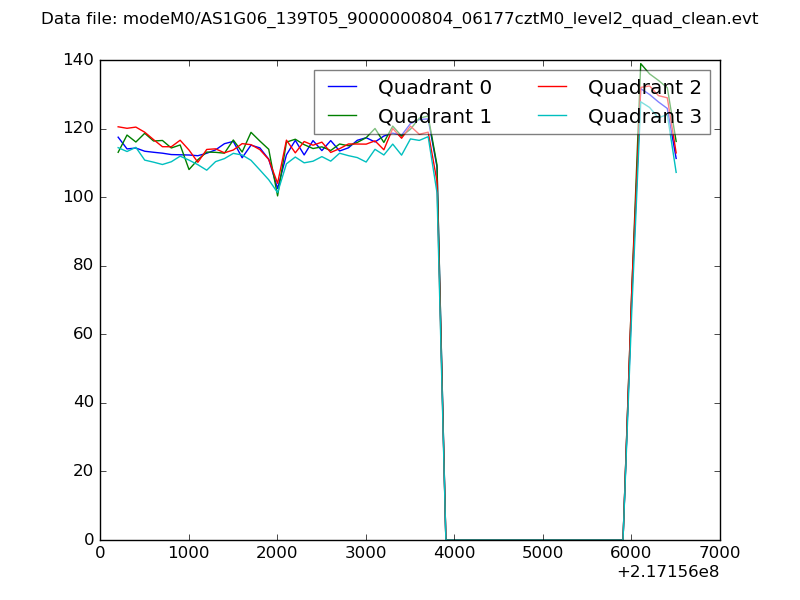 |
|
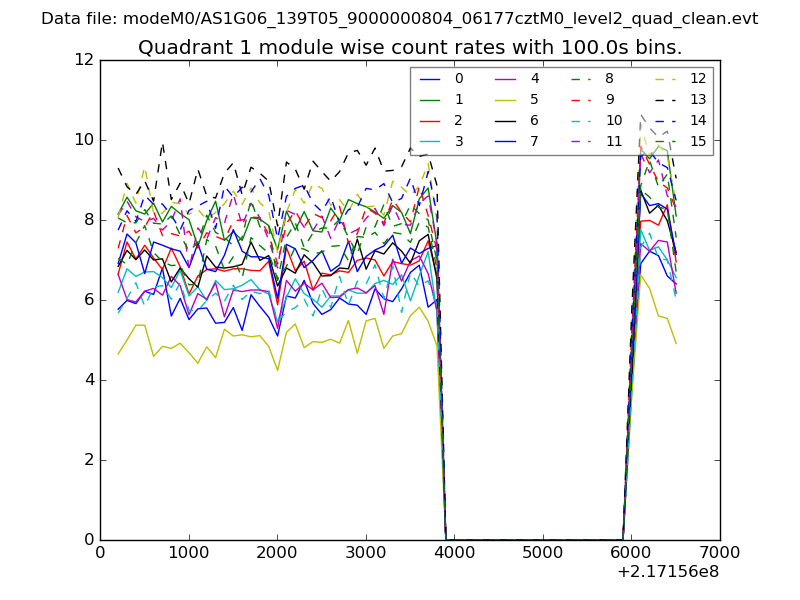
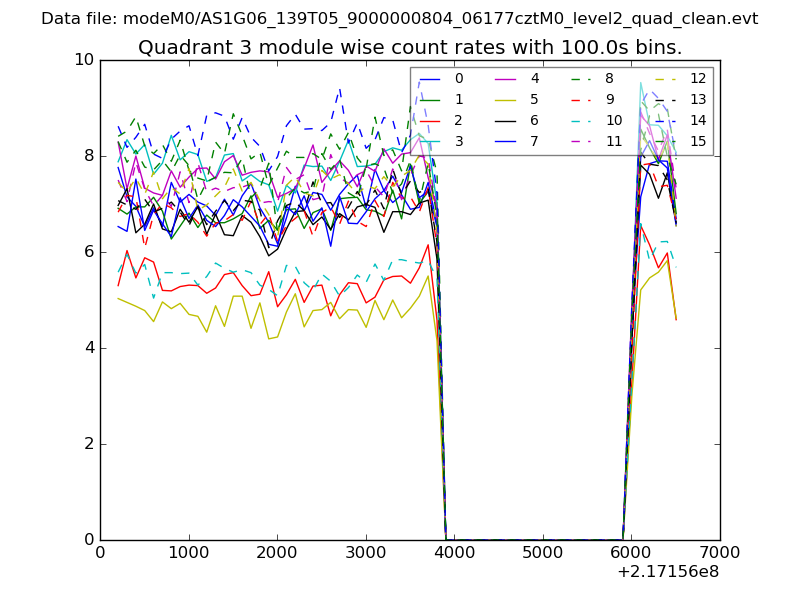
| Module-wise count rates for Quadrant A Data is divided into 100 sec bins |
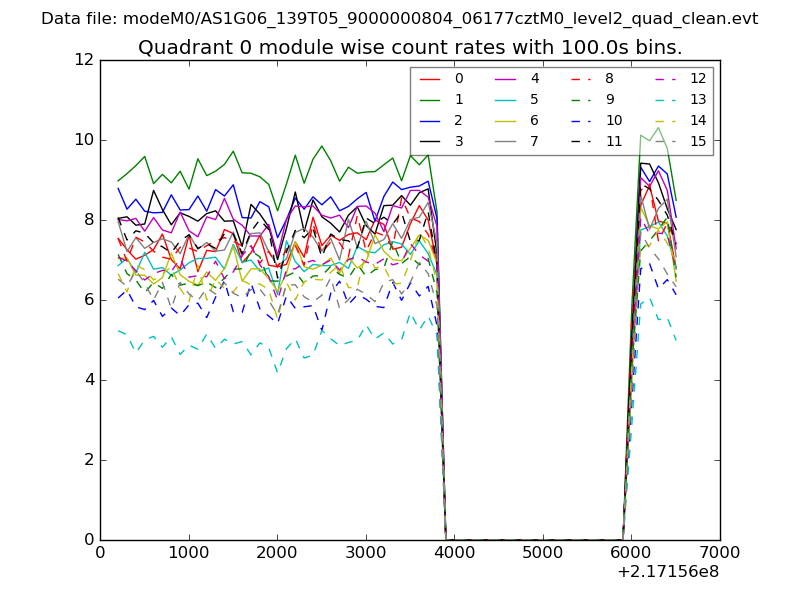 |
 |
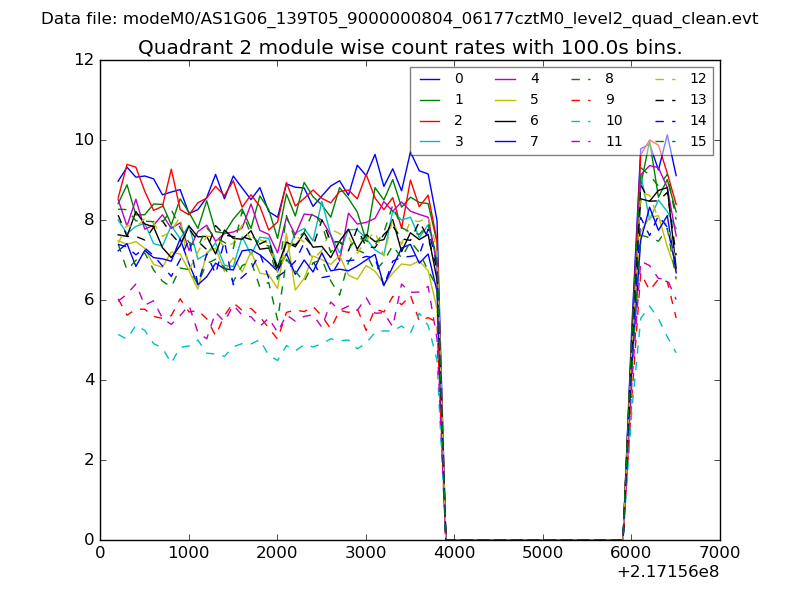
| Module-wise count rates for Quadrant B Data is divided into 100 sec bins |
 |
 |
| Module-wise count rates for Quadrant C Data is divided into 100 sec bins |
 |
 |
| Module-wise count rates for Quadrant D Data is divided into 100 sec bins |
 |
 |
| Parameter | Plot |
|---|---|
| CZT HV Monitor | 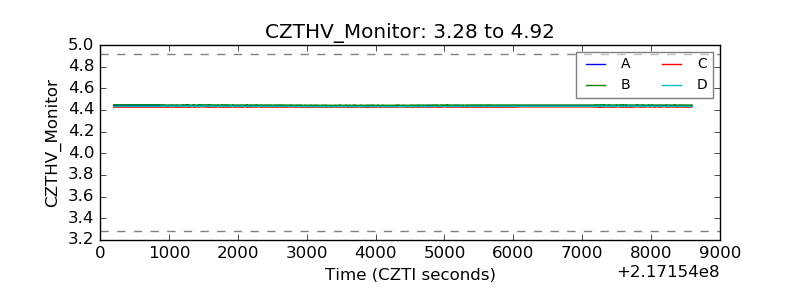 |
| D_VDD |  |
| Temperature 1 | 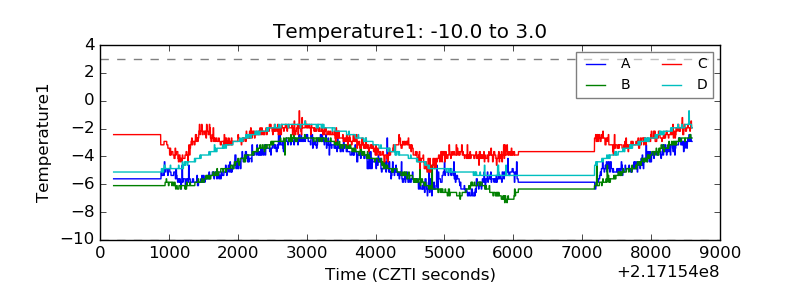 |
| Veto HV Monitor | 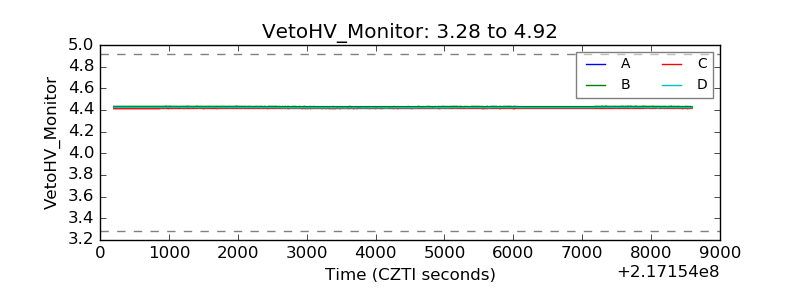 |
| Veto LLD | 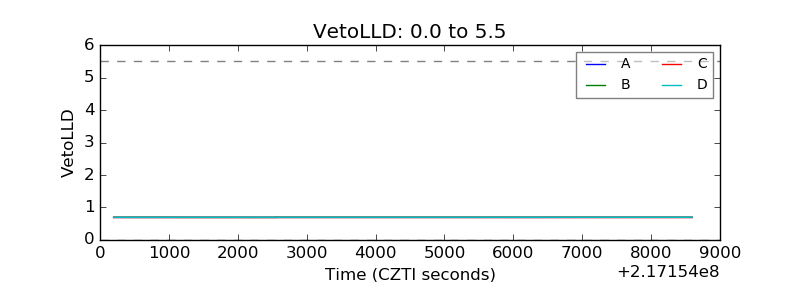 |
| Alpha Counter | 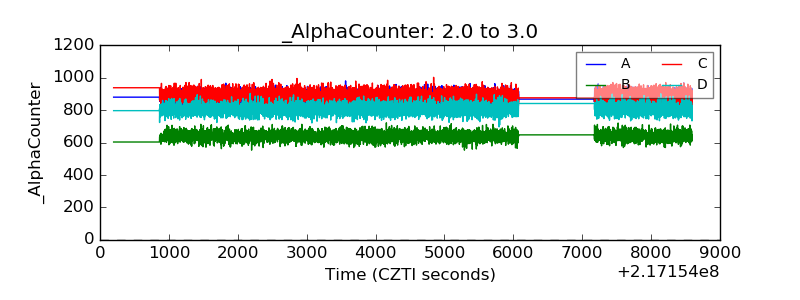 |
| _CPM_Rate | 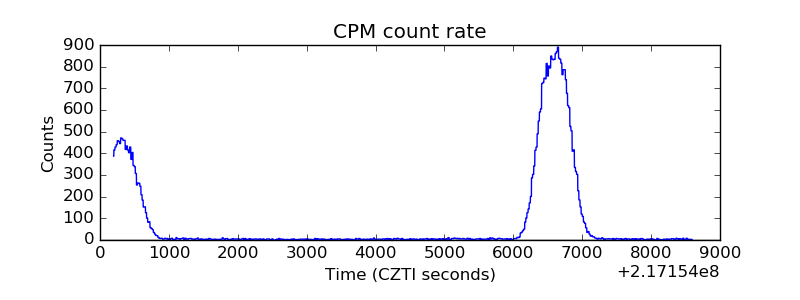 |
| CZT Counter | 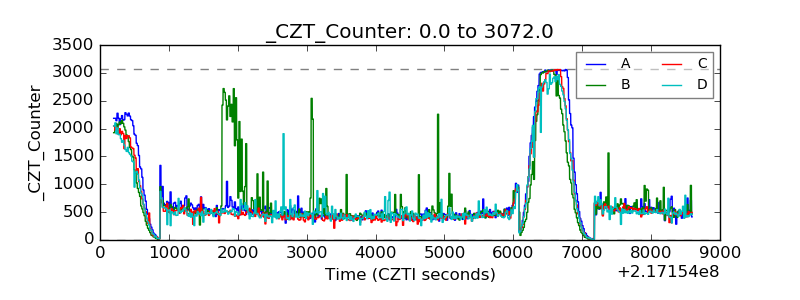 |
| +2.5 Volts monitor |  |
| +5 Volts monitor |  |
| _ROLL_ROT | 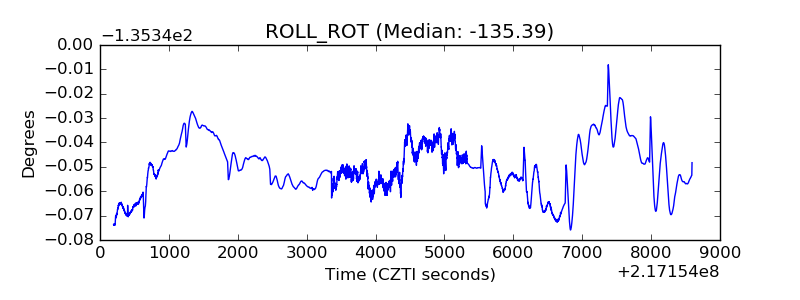 |
| _Roll_DEC | 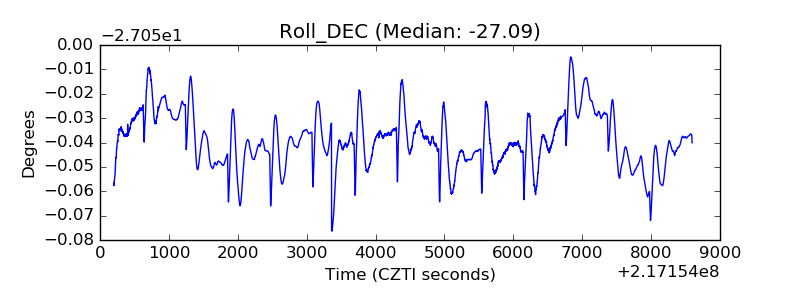 |
| _Roll_RA | 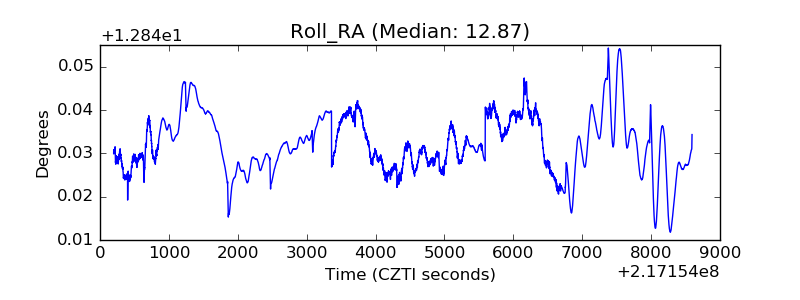 |
| Veto Counter | 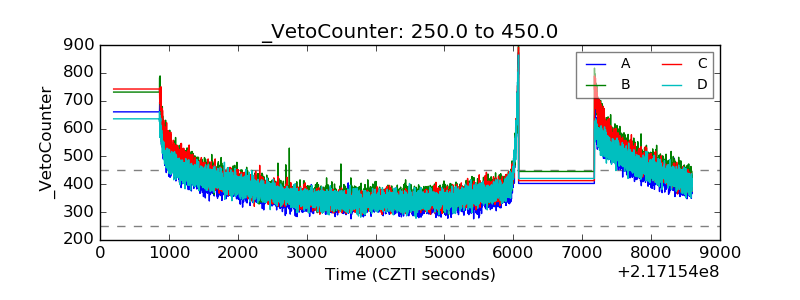 |