| Param | Original file | Final file |
|---|---|---|
| Filename | modeM0/AS1G06_139T05_9000000804_06178cztM0_level2.evt | modeM0/AS1G06_139T05_9000000804_06178cztM0_level2_quad_clean.evt |
| Size (bytes) | 421,090,560 | 88,948,800 |
| Size | 401.6 MB | 84.8 MB |
| Events in quadrant A | 3,147,199 | 573,254 |
| Events in quadrant B | 3,294,711 | 584,228 |
| Events in quadrant C | 2,870,292 | 569,912 |
| Events in quadrant D | 3,034,457 | 549,025 |
| Mode M9 | |||
|---|---|---|---|
| Quadrant | BADHDUFLAG | Total packets | Discarded packets |
| A | 0 | 12 | 0 |
| B | 0 | 12 | 0 |
| C | 0 | 12 | 0 |
| D | 0 | 12 | 0 |
| Mode SS | |||
|---|---|---|---|
| Quadrant | BADHDUFLAG | Total packets | Discarded packets |
| A | 0 | 120 | 0 |
| B | 0 | 120 | 0 |
| C | 0 | 120 | 0 |
| D | 0 | 120 | 2 |
| Mode M0 | |||
|---|---|---|---|
| Quadrant | BADHDUFLAG | Total packets | Discarded packets |
| A | 0 | 13126 | 16 |
| B | 0 | 13732 | 13 |
| C | 0 | 12631 | 8 |
| D | 0 | 13053 | 26 |
| Quadrant | Total seconds | Saturated seconds | Saturation percentage |
|---|---|---|---|
| A | 5980 | 92 | 1.538462% |
| B | 5981 | 169 | 2.825614% |
| C | 5983 | 65 | 1.086411% |
| D | 5979 | 82 | 1.371467% |
Noise dominated data is calculated using 1-second bins in cleaned event files. If a bin has >2000 counts, and if more than 50% of those come from <1% of pixels, then it is considered to be noise-dominated and hence unusable.
| Quadrant | # 1 sec bins | Bins with >0 counts | Bins with >2000 counts | High rate bins dominated by noise | Noise dominated (total time) | Noise dominated (detector-on time) | Marked lightcurve |
|---|---|---|---|---|---|---|---|
| A | 7166 | 5985 | 7 | 7 | 0.10% | 0.12% | 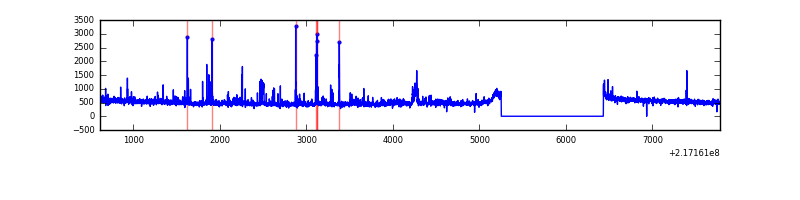 |
| B | 7166 | 5985 | 65 | 65 | 0.91% | 1.09% | 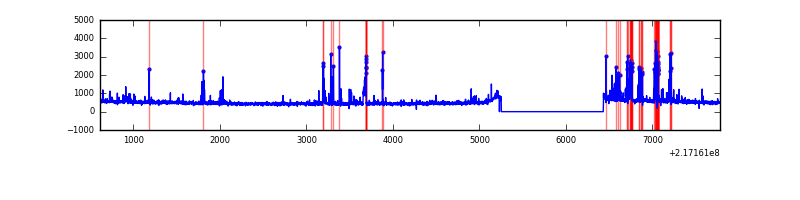 |
| C | 7166 | 5986 | 0 | 0 | 0.00% | 0.00% | 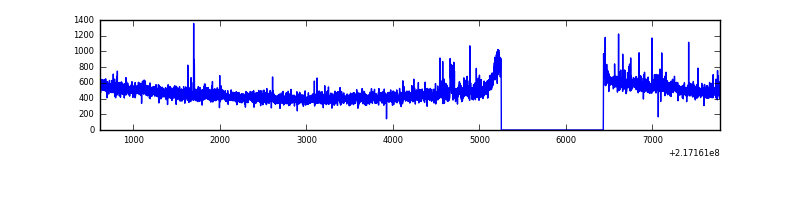 |
| D | 7166 | 5986 | 8 | 8 | 0.11% | 0.13% | 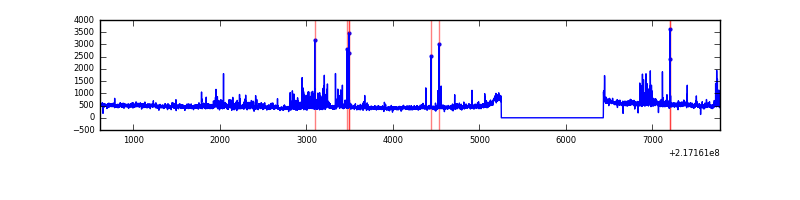 |
Top three noisy pixels from each quadrant. If the there are fewer than three noisy pixels in the level2.evt file, extra rows are filled as -1
| Pixel properties | Quadrant properties | ||||||
|---|---|---|---|---|---|---|---|
| Quadrant | DetID | PixID | Counts | Sigma | Mean | Median | Sigma |
| A | 8 | 15 | 245170 | 1613.38 | 736 | 721 | 151.5 |
| A | 15 | 234 | 61577 | 401.65 | 736 | 721 | 151.5 |
| A | 0 | 226 | 7063 | 41.86 | 736 | 721 | 151.5 |
| B | 3 | 64 | 377391 | 2690.23 | 735 | 717 | 140.0 |
| B | 4 | 80 | 38649 | 270.91 | 735 | 717 | 140.0 |
| B | 0 | 219 | 14219 | 96.43 | 735 | 717 | 140.0 |
| C | 9 | 16 | 62063 | 376.53 | 705 | 709 | 162.9 |
| C | 12 | 16 | 44708 | 270.02 | 705 | 709 | 162.9 |
| C | 1 | 16 | 14659 | 85.61 | 705 | 709 | 162.9 |
| D | 2 | 136 | 171386 | 978.65 | 709 | 687 | 174.4 |
| D | 12 | 110 | 56890 | 322.22 | 709 | 687 | 174.4 |
| D | 8 | 195 | 40688 | 229.33 | 709 | 687 | 174.4 |
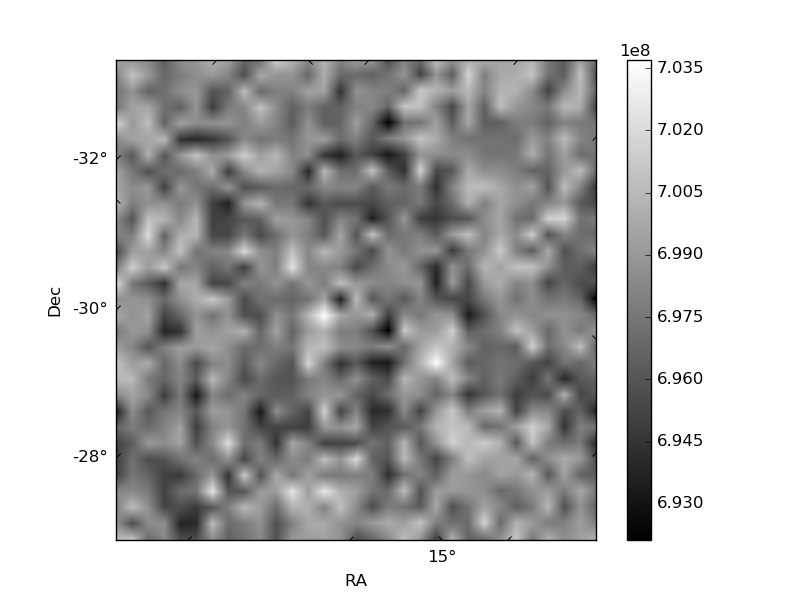
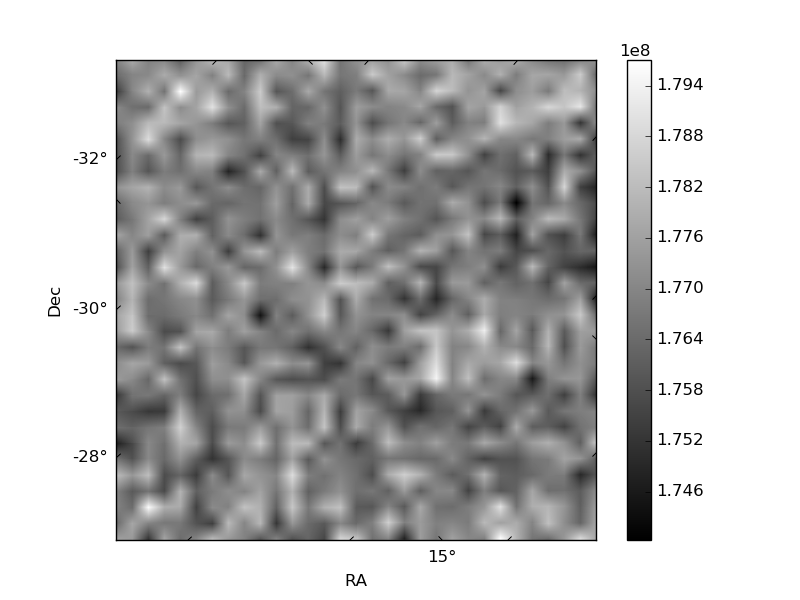
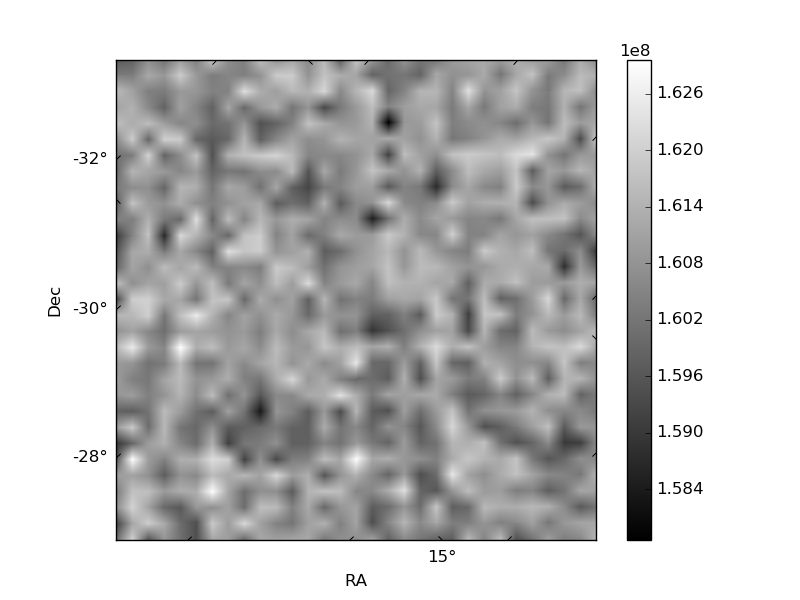
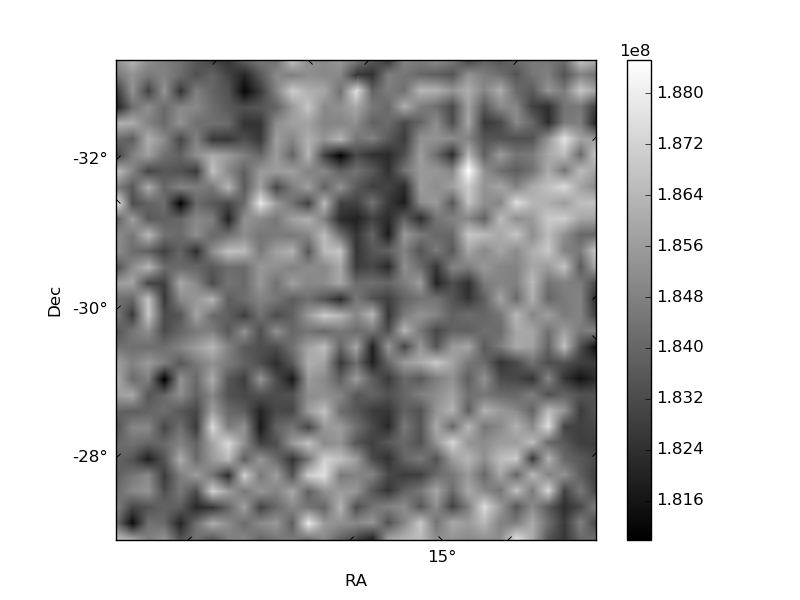
Histogram calculated using DETX and DETY for each event in the final _common_clean file
| Quadrant A | 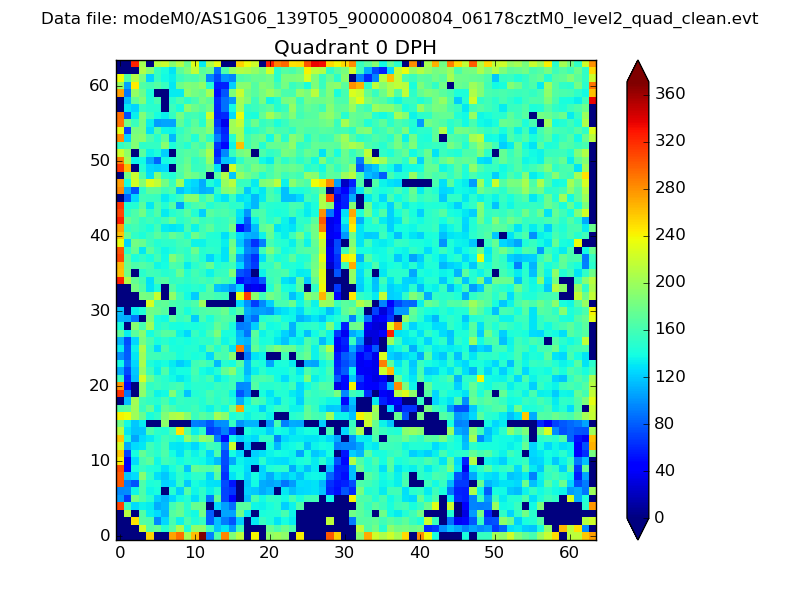 |
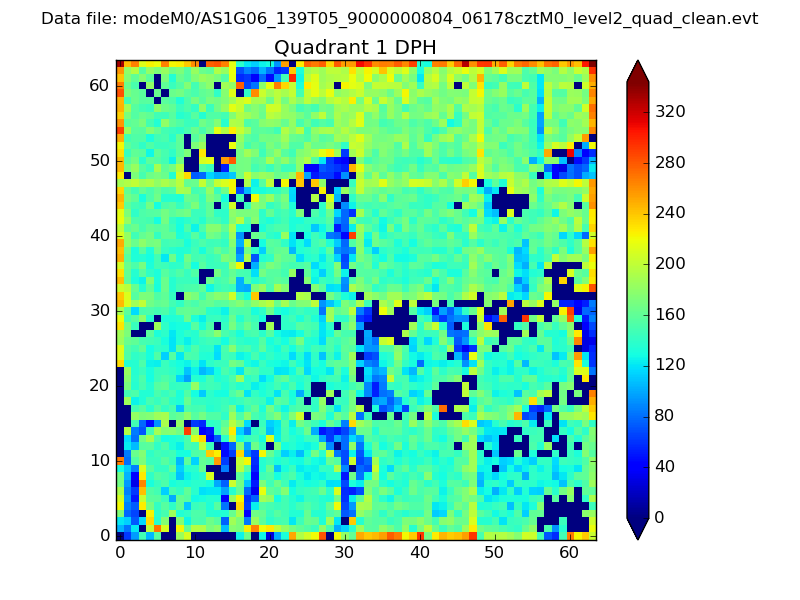 |
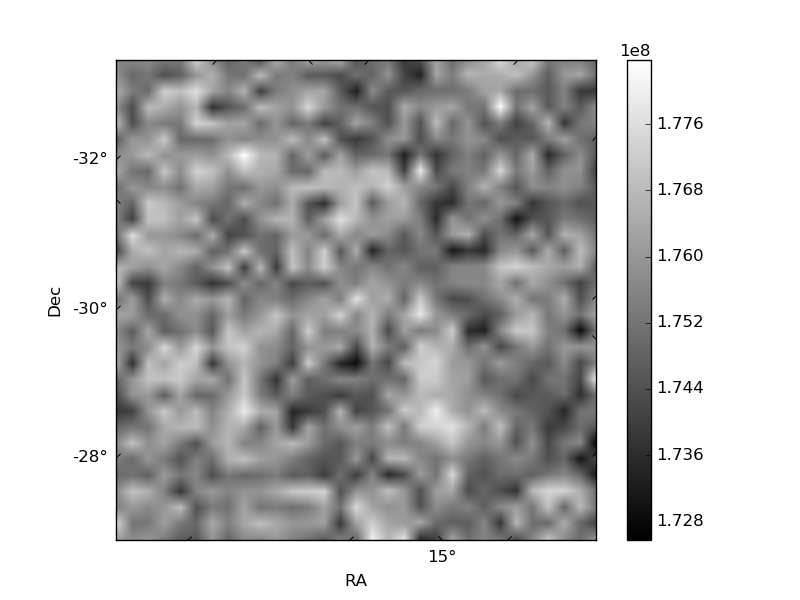
Quadrant B |
|---|---|---|---|
| Quadrant D | 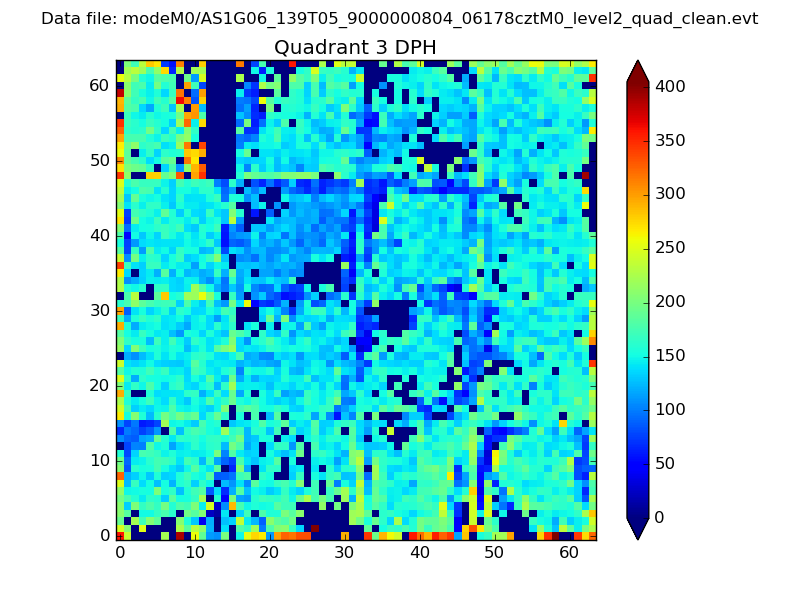 |
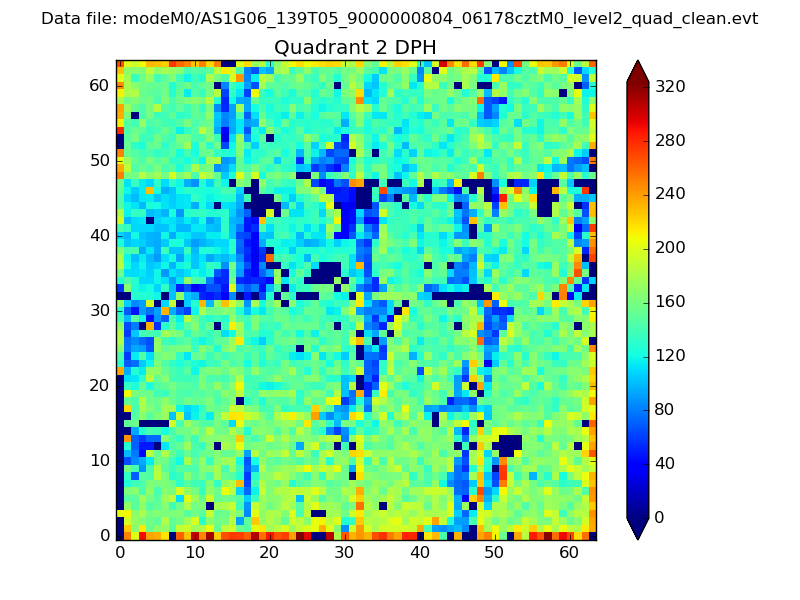 |
Quadrant C |
| Plot type | Count rate plots | Images |
|---|---|---|
| Comparison with Poisson distribution Blue bars denote a histogram of data divided into 1 sec bins. Red curve is a Poisson curve with rate = median count rate of data. |
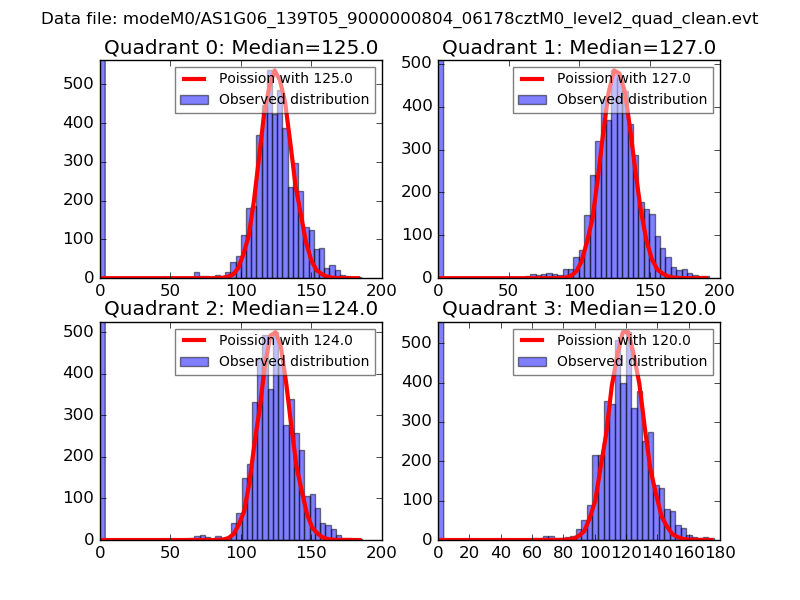 |
 |
| Quadrant-wise count rates Data is divided into 100 sec bins |
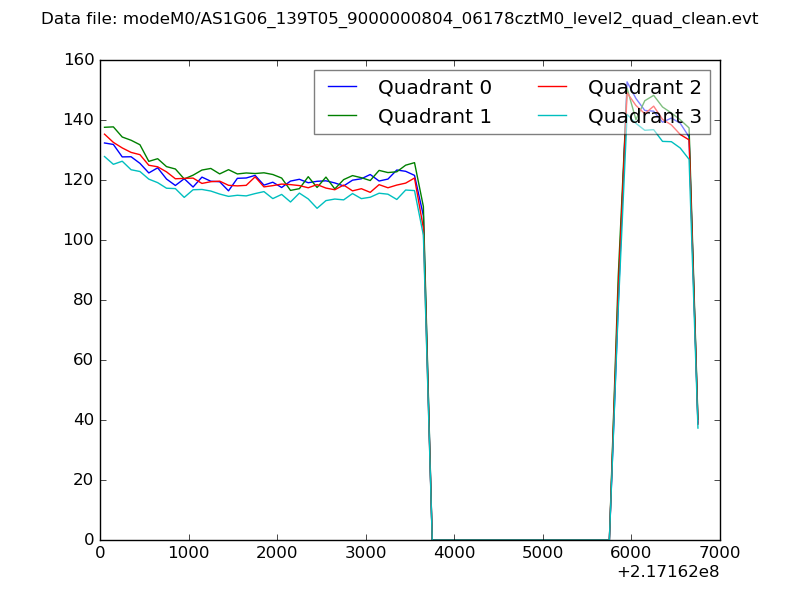 |
|
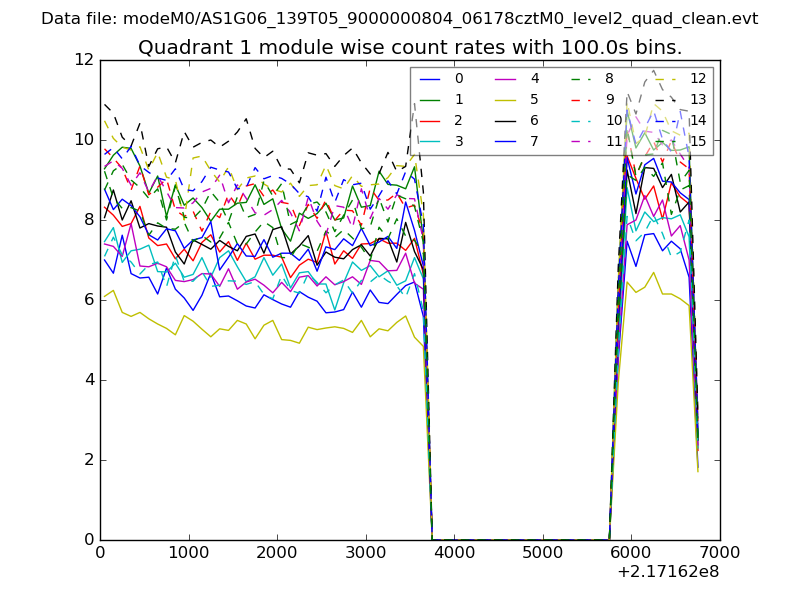
| Module-wise count rates for Quadrant A Data is divided into 100 sec bins |
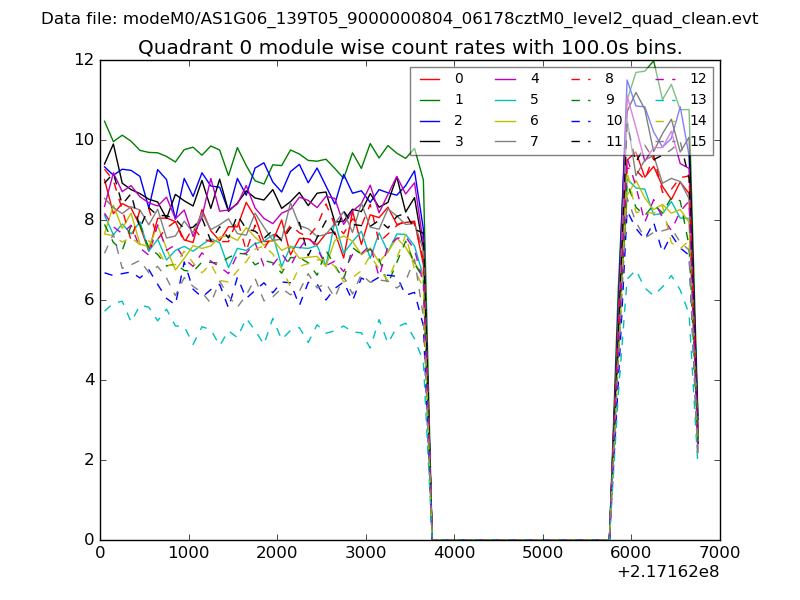 |
 |
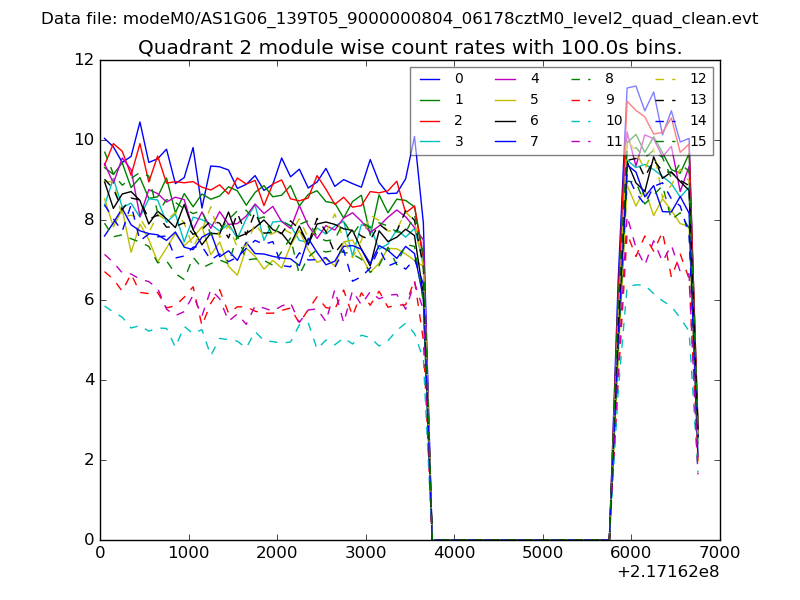
| Module-wise count rates for Quadrant B Data is divided into 100 sec bins |
 |
 |
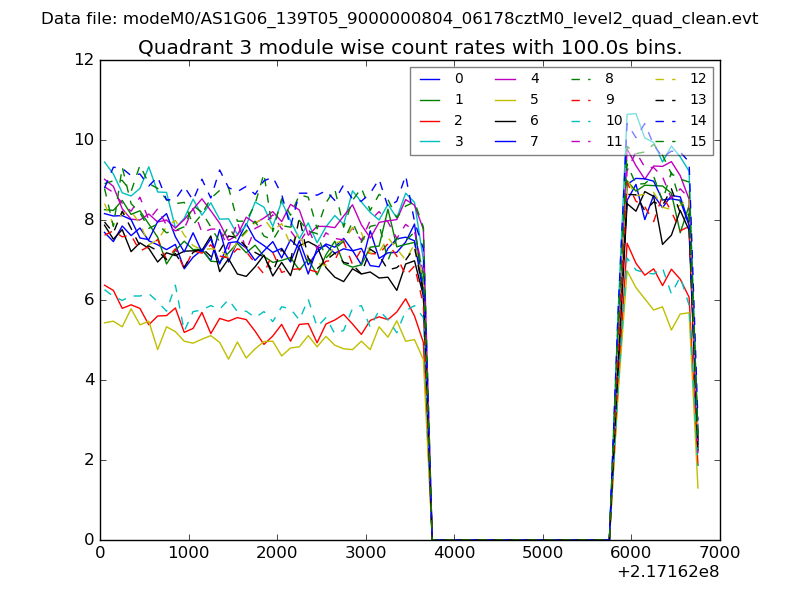
| Module-wise count rates for Quadrant C Data is divided into 100 sec bins |
 |
 |
| Module-wise count rates for Quadrant D Data is divided into 100 sec bins |
 |
 |
| Parameter | Plot |
|---|---|
| CZT HV Monitor | 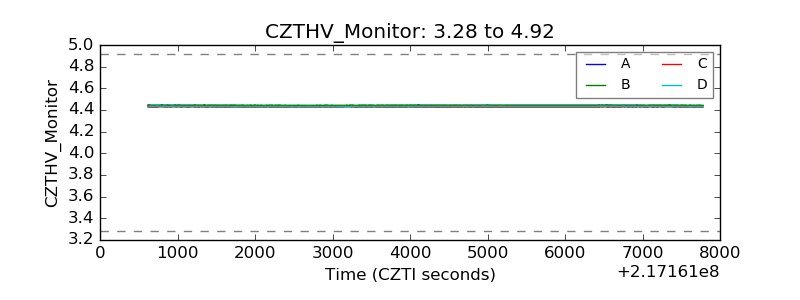 |
| D_VDD | 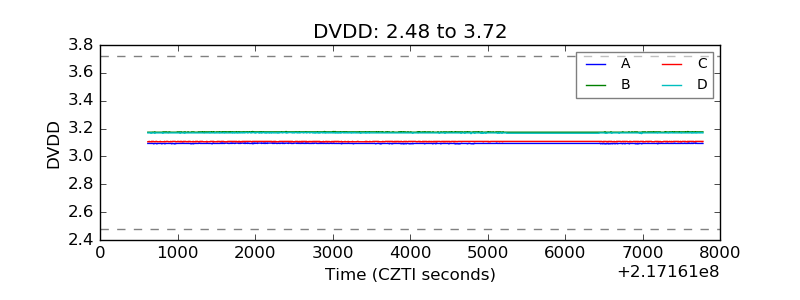 |
| Temperature 1 |  |
| Veto HV Monitor | 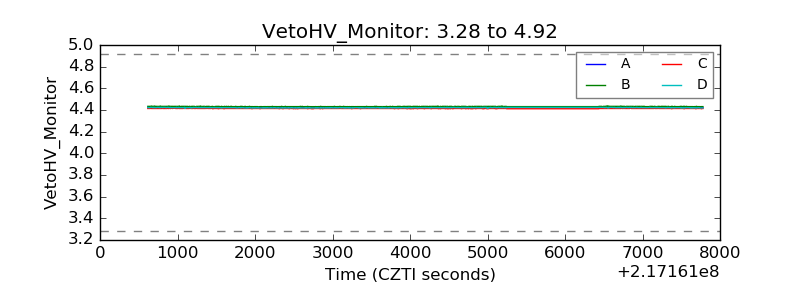 |
| Veto LLD | 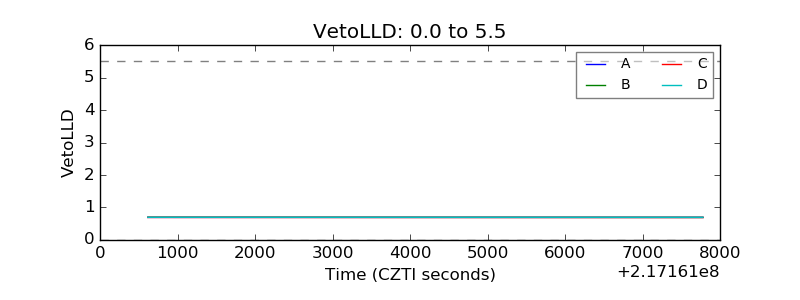 |
| Alpha Counter | 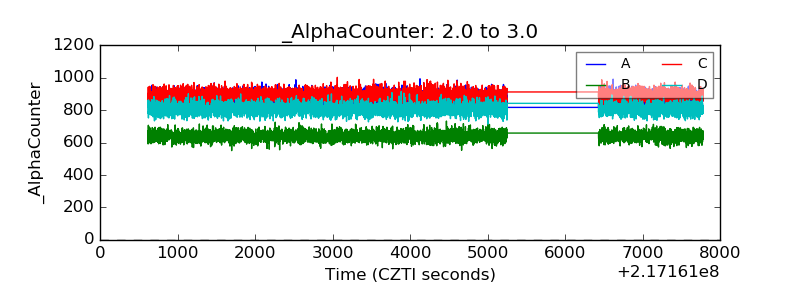 |
| _CPM_Rate | 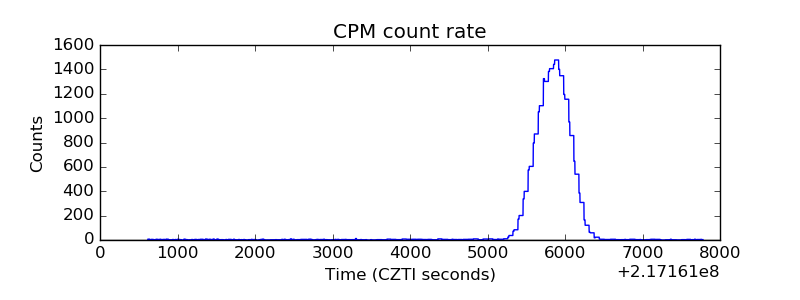 |
| CZT Counter | 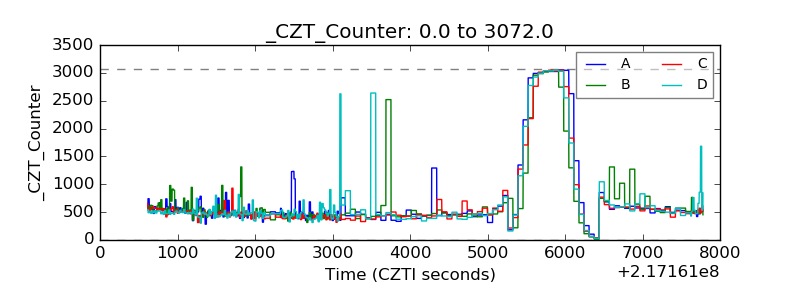 |
| +2.5 Volts monitor |  |
| +5 Volts monitor |  |
| _ROLL_ROT | 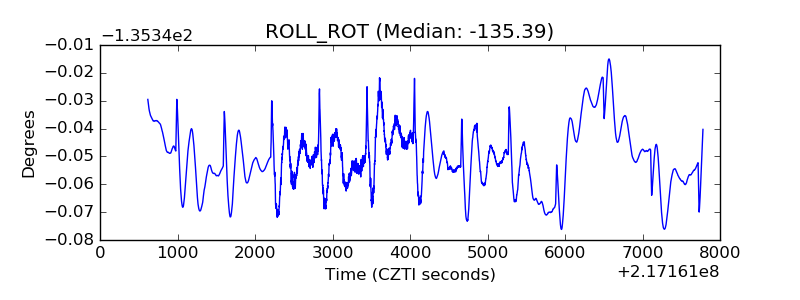 |
| _Roll_DEC | 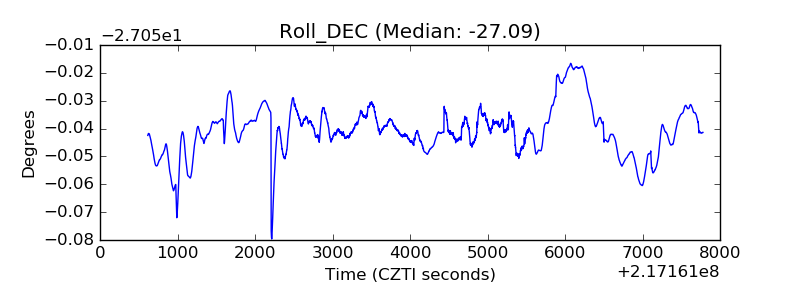 |
| _Roll_RA | 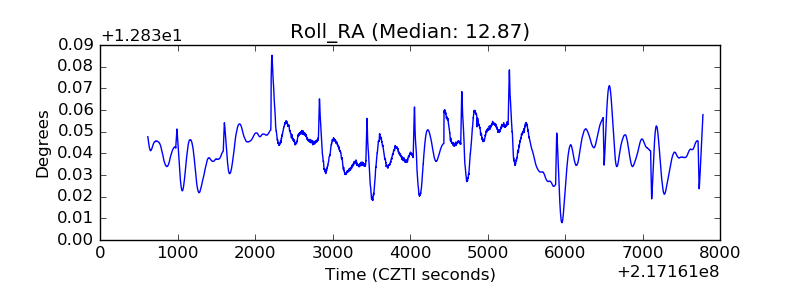 |
| Veto Counter | 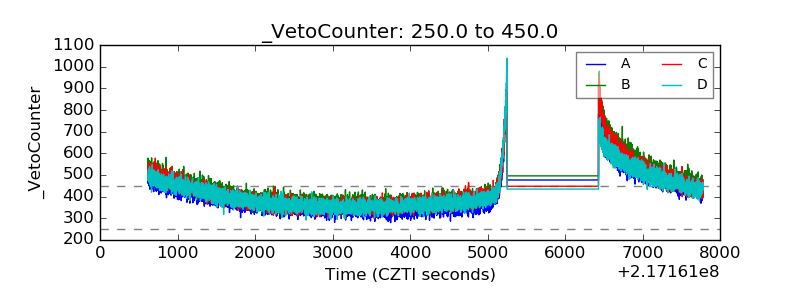 |