| Param | Original file | Final file |
|---|---|---|
| Filename | modeM0/AS1G06_139T05_9000000804_06179cztM0_level2.evt | modeM0/AS1G06_139T05_9000000804_06179cztM0_level2_quad_clean.evt |
| Size (bytes) | 274,944,960 | 69,145,920 |
| Size | 262.2 MB | 65.9 MB |
| Events in quadrant A | 1,934,942 | 460,401 |
| Events in quadrant B | 2,276,509 | 464,162 |
| Events in quadrant C | 1,872,670 | 452,047 |
| Events in quadrant D | 1,969,261 | 435,022 |
| Mode SS | |||
|---|---|---|---|
| Quadrant | BADHDUFLAG | Total packets | Discarded packets |
| A | 0 | 80 | 0 |
| B | 0 | 80 | 0 |
| C | 0 | 80 | 0 |
| D | 0 | 80 | 0 |
| Mode M0 | |||
|---|---|---|---|
| Quadrant | BADHDUFLAG | Total packets | Discarded packets |
| A | 0 | 8435 | 1 |
| B | 0 | 9426 | 1 |
| C | 0 | 8458 | 1 |
| D | 0 | 8662 | 1 |
| Quadrant | Total seconds | Saturated seconds | Saturation percentage |
|---|---|---|---|
| A | 4000 | 9 | 0.225000% |
| B | 4000 | 89 | 2.225000% |
| C | 4000 | 5 | 0.125000% |
| D | 4001 | 15 | 0.374906% |
Noise dominated data is calculated using 1-second bins in cleaned event files. If a bin has >2000 counts, and if more than 50% of those come from <1% of pixels, then it is considered to be noise-dominated and hence unusable.
| Quadrant | # 1 sec bins | Bins with >0 counts | Bins with >2000 counts | High rate bins dominated by noise | Noise dominated (total time) | Noise dominated (detector-on time) | Marked lightcurve |
|---|---|---|---|---|---|---|---|
| A | 4000 | 4000 | 0 | 0 | 0.00% | 0.00% |  |
| B | 4000 | 4000 | 56 | 56 | 1.40% | 1.40% |  |
| C | 4000 | 4000 | 2 | 2 | 0.05% | 0.05% |  |
| D | 4001 | 4001 | 2 | 2 | 0.05% | 0.05% |  |
Top three noisy pixels from each quadrant. If the there are fewer than three noisy pixels in the level2.evt file, extra rows are filled as -1
| Pixel properties | Quadrant properties | ||||||
|---|---|---|---|---|---|---|---|
| Quadrant | DetID | PixID | Counts | Sigma | Mean | Median | Sigma |
| A | 8 | 15 | 46803 | 471.94 | 487 | 478 | 98.2 |
| A | 4 | 2 | 5510 | 51.26 | 487 | 478 | 98.2 |
| A | 13 | 251 | 5485 | 51.01 | 487 | 478 | 98.2 |
| B | 3 | 64 | 302906 | 3266.57 | 485 | 475 | 92.6 |
| B | 15 | 35 | 38074 | 406.11 | 485 | 475 | 92.6 |
| B | 0 | 219 | 26572 | 281.87 | 485 | 475 | 92.6 |
| C | 12 | 16 | 49498 | 462.26 | 461 | 465 | 106.1 |
| C | 9 | 16 | 19073 | 175.43 | 461 | 465 | 106.1 |
| C | 1 | 16 | 5328 | 45.85 | 461 | 465 | 106.1 |
| D | 2 | 136 | 74310 | 647.67 | 464 | 451 | 114.0 |
| D | 12 | 110 | 45767 | 397.38 | 464 | 451 | 114.0 |
| D | 8 | 195 | 45192 | 392.33 | 464 | 451 | 114.0 |
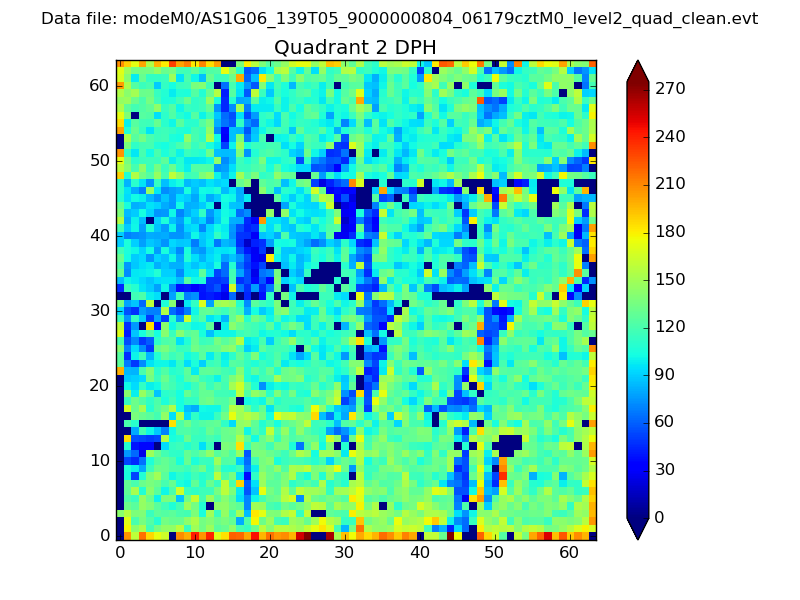
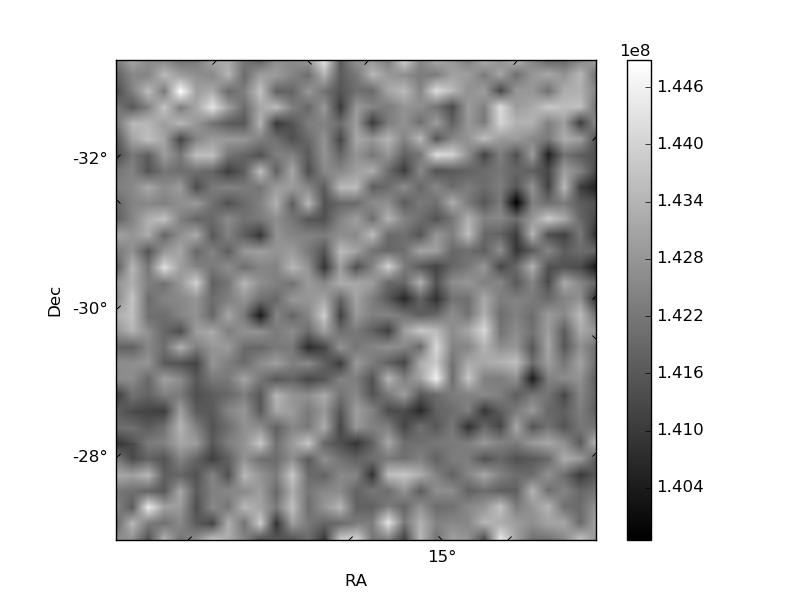
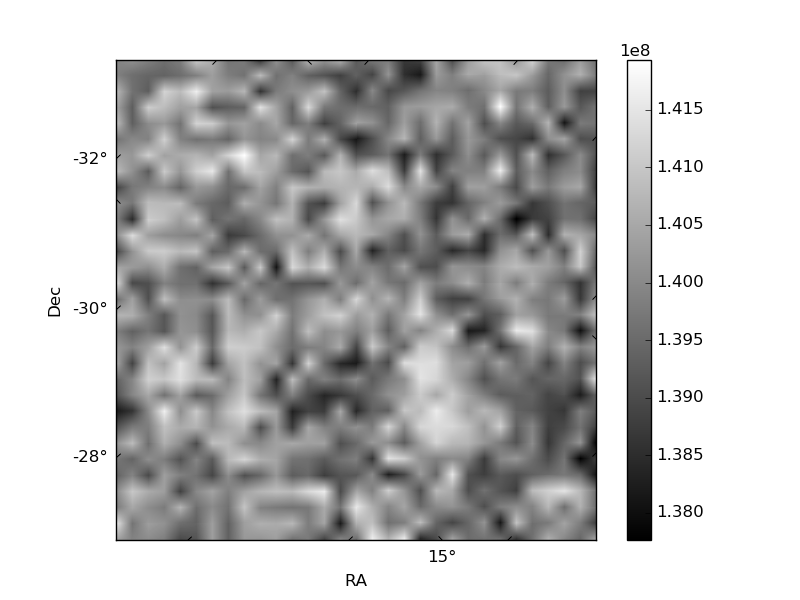
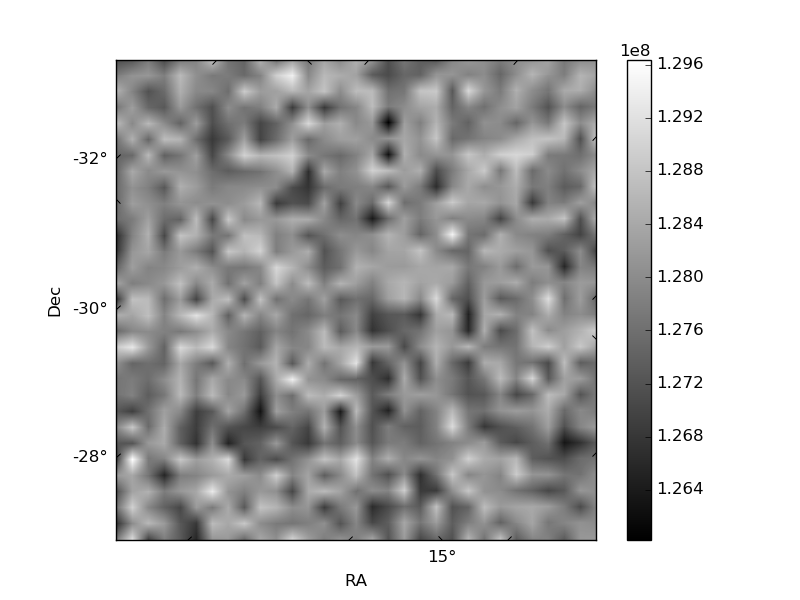
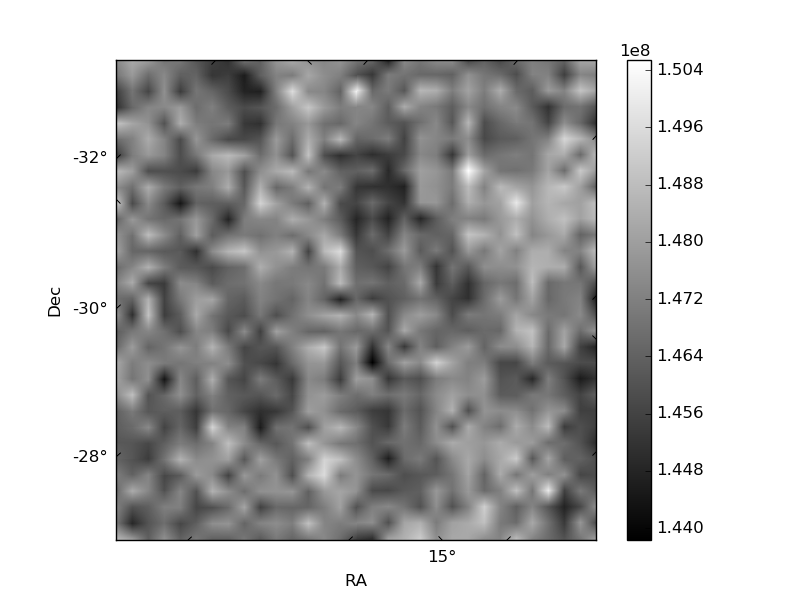
Histogram calculated using DETX and DETY for each event in the final _common_clean file
| Quadrant A | 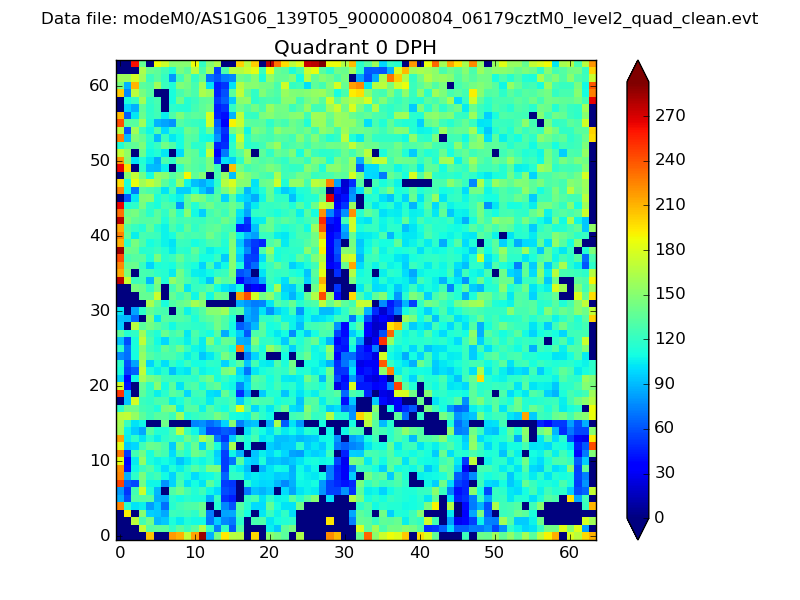 |
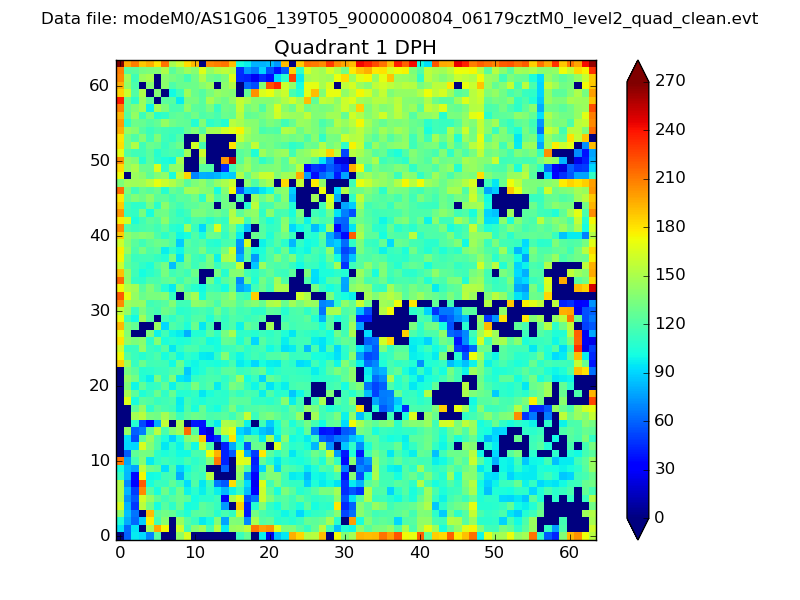 |
Quadrant B |
|---|---|---|---|
| Quadrant D | 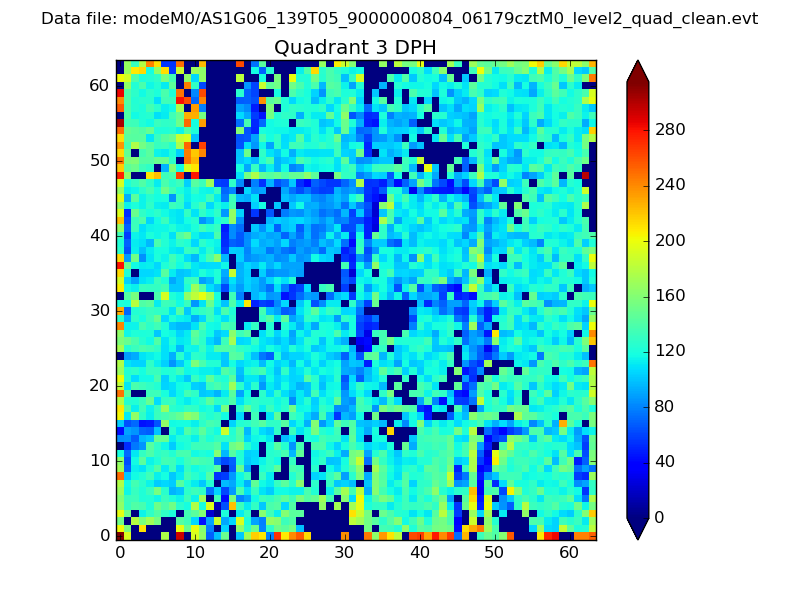 |
 |
Quadrant C |
| Plot type | Count rate plots | Images |
|---|---|---|
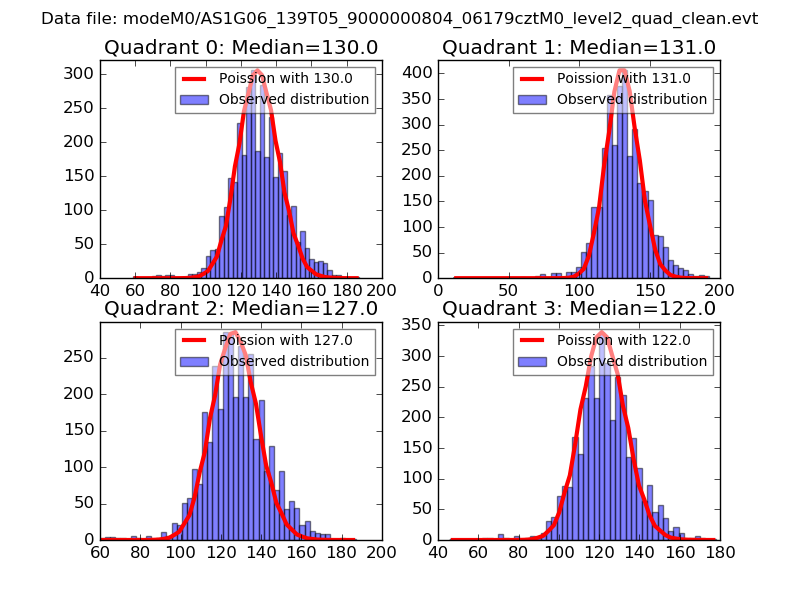
| Comparison with Poisson distribution Blue bars denote a histogram of data divided into 1 sec bins. Red curve is a Poisson curve with rate = median count rate of data. |
 |
 |
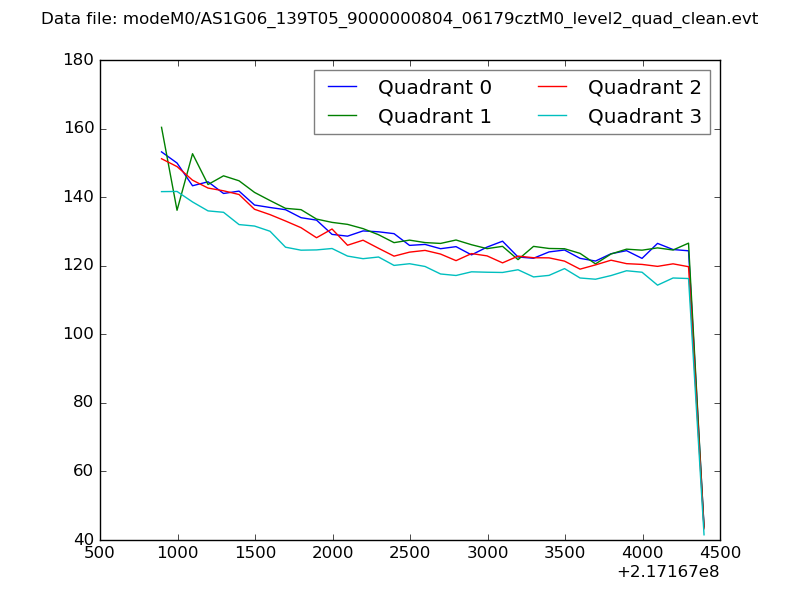
| Quadrant-wise count rates Data is divided into 100 sec bins |
 |
|
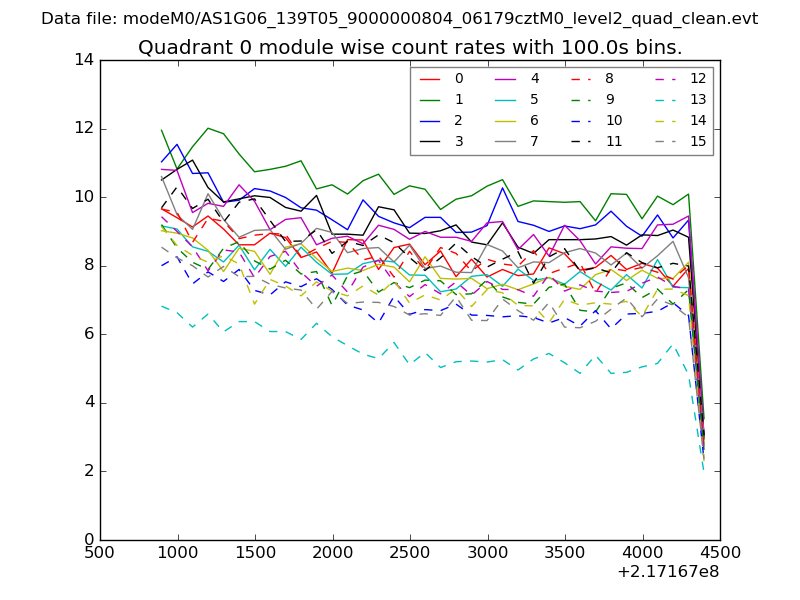
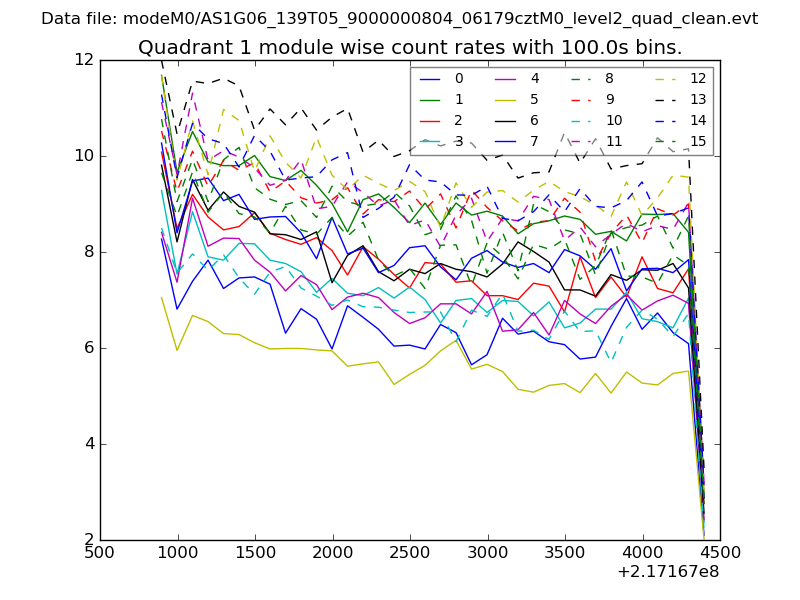
| Module-wise count rates for Quadrant A Data is divided into 100 sec bins |
 |
 |
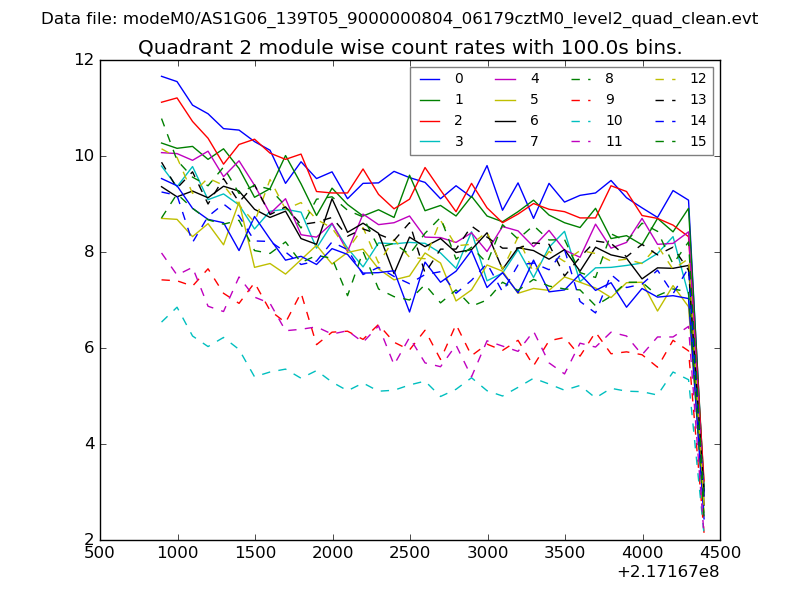
| Module-wise count rates for Quadrant B Data is divided into 100 sec bins |
 |
 |
| Module-wise count rates for Quadrant C Data is divided into 100 sec bins |
 |
 |
| Module-wise count rates for Quadrant D Data is divided into 100 sec bins |
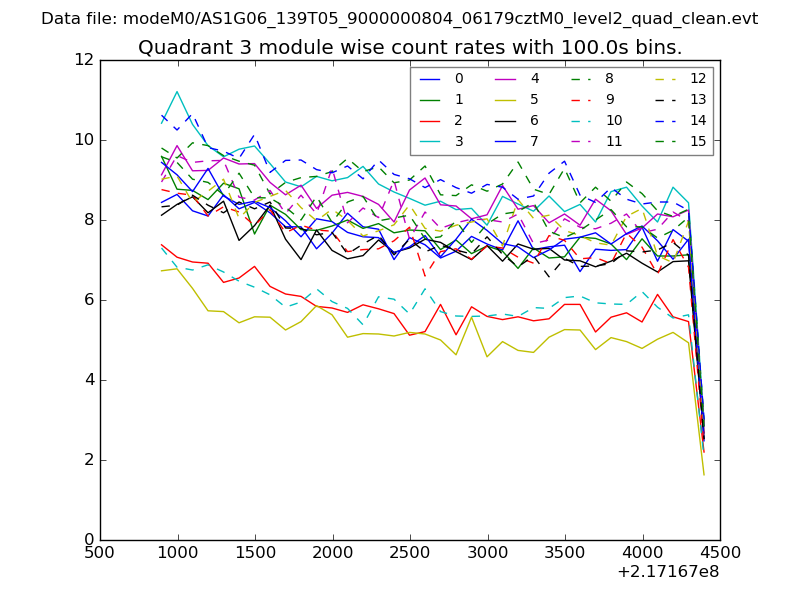 |
 |
| Parameter | Plot |
|---|---|
| CZT HV Monitor | 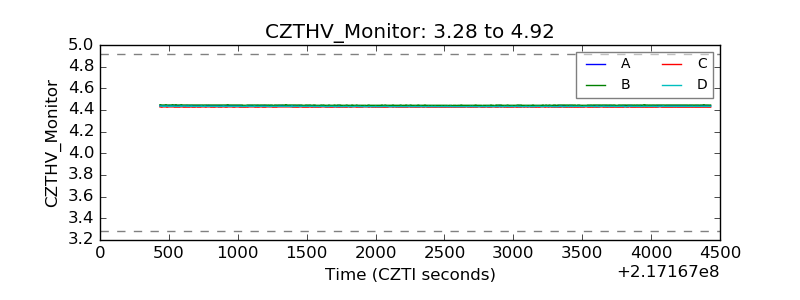 |
| D_VDD | 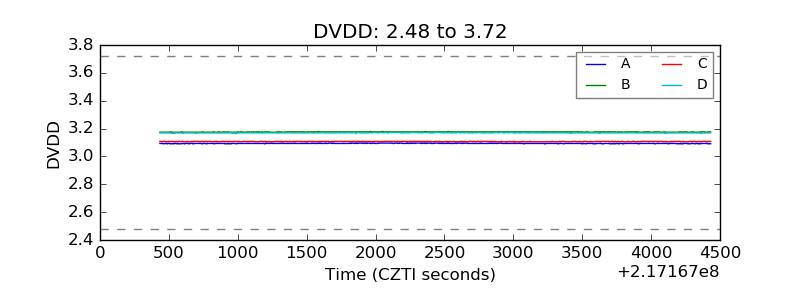 |
| Temperature 1 | 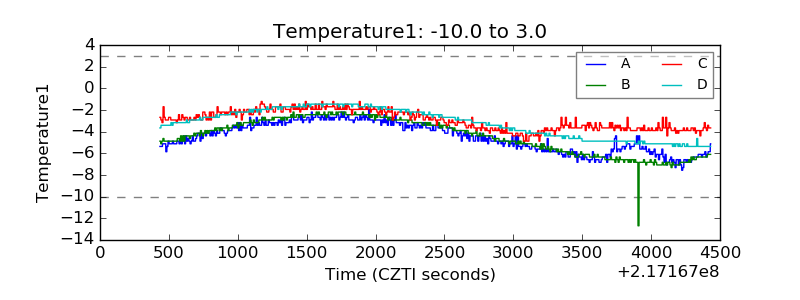 |
| Veto HV Monitor | 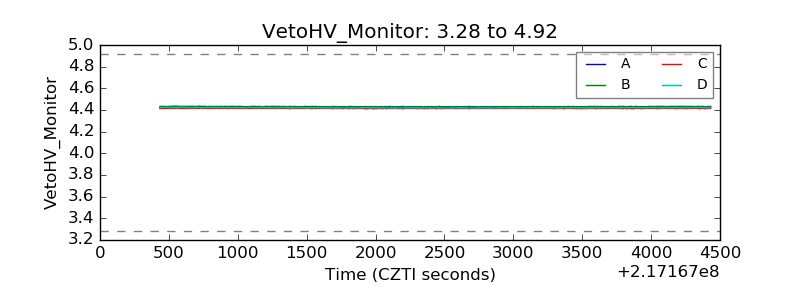 |
| Veto LLD | 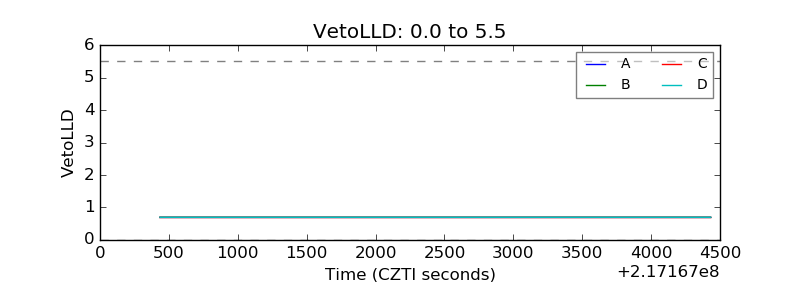 |
| Alpha Counter | 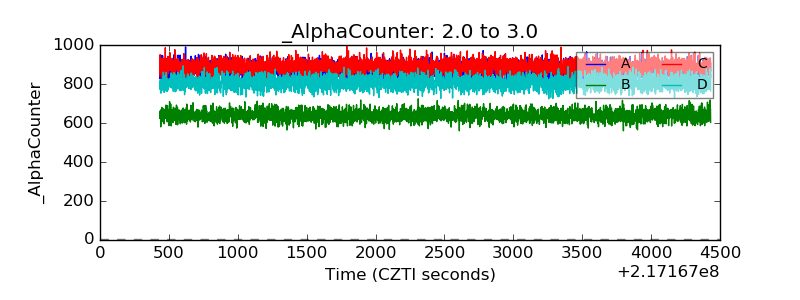 |
| _CPM_Rate | 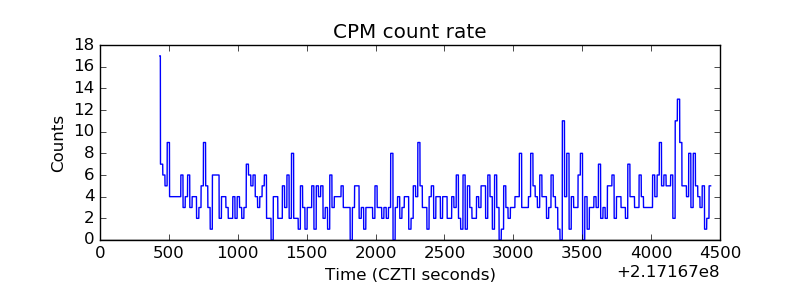 |
| CZT Counter | 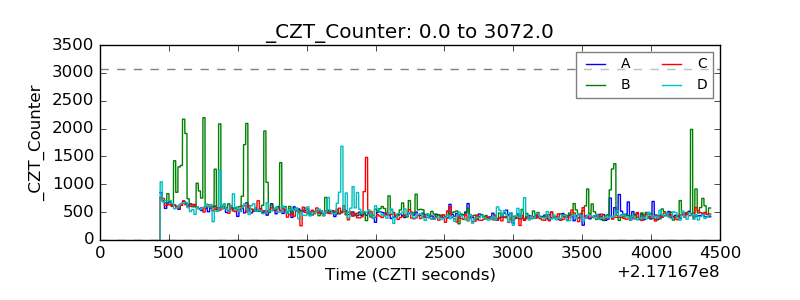 |
| +2.5 Volts monitor |  |
| +5 Volts monitor |  |
| _ROLL_ROT | 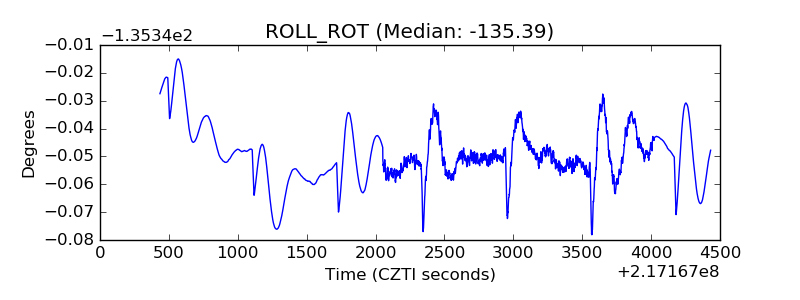 |
| _Roll_DEC | 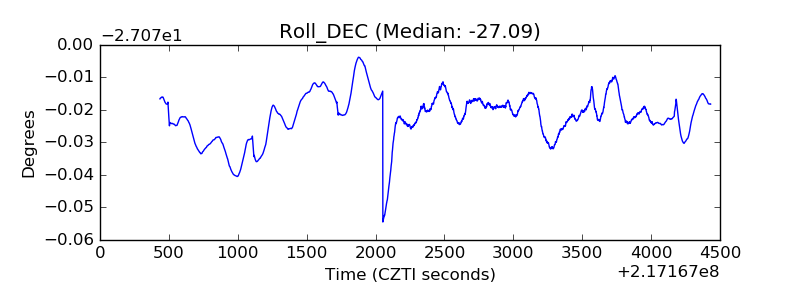 |
| _Roll_RA | 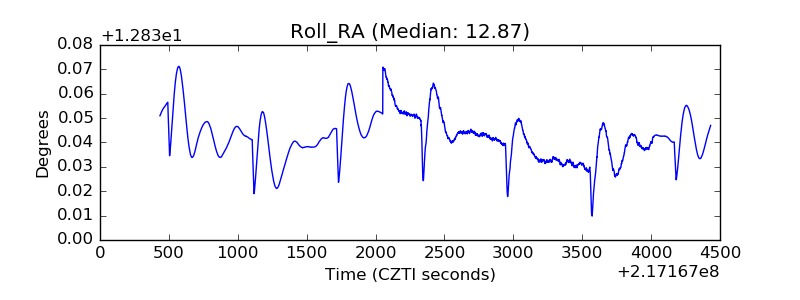 |
| Veto Counter | 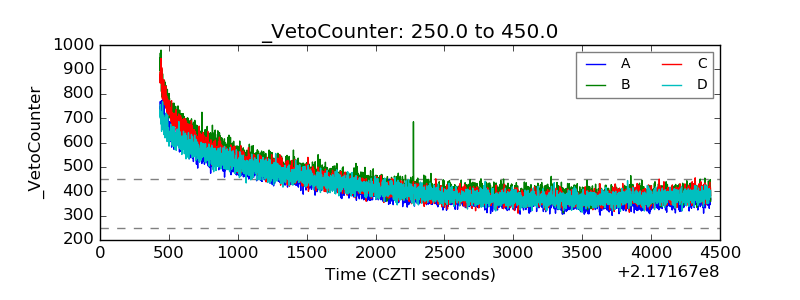 |