| Param | Original file | Final file |
|---|---|---|
| Filename | modeM0/AS1A02_152T01_9000000806cztM0_level2.fits | modeM0/AS1A02_152T01_9000000806cztM0_level2_quad_clean.evt |
| Size (bytes) | 270,659,520 | 278,832,960 |
| Size | 258.1 MB | 265.9 MB |
| Events in quadrant A | 1,647,968 | 1,713,161 |
| Events in quadrant B | 1,603,144 | 1,730,289 |
| Events in quadrant C | 1,605,416 | 1,573,905 |
| Events in quadrant D | 1,390,288 | 1,478,420 |
| Mode SS | |||
|---|---|---|---|
| Quadrant | BADHDUFLAG | Total packets | Discarded packets |
| A | 0 | 586 | 0 |
| B | 0 | 584 | 0 |
| C | 0 | 586 | 0 |
| D | 0 | 586 | 0 |
| Mode M0 | |||
|---|---|---|---|
| Quadrant | BADHDUFLAG | Total packets | Discarded packets |
| A | 0 | 60266 | 0 |
| B | 0 | 62236 | 0 |
| C | 0 | 59158 | 0 |
| D | 0 | 61145 | 0 |
| Mode M9 | |||
|---|---|---|---|
| Quadrant | BADHDUFLAG | Total packets | Discarded packets |
| A | 0 | 64 | 0 |
| B | 0 | 65 | 0 |
| C | 0 | 64 | 0 |
| D | 0 | 64 | 0 |
| Quadrant | Total seconds | Saturated seconds | Saturation percentage |
|---|---|---|---|
| A | 28329 | 352 | 1.242543% |
| B | 28354 | 484 | 1.706990% |
| C | 28250 | 211 | 0.746903% |
| D | 28276 | 250 | 0.884142% |
Noise dominated data is calculated using 1-second bins in cleaned event files. If a bin has >2000 counts, and if more than 50% of those come from <1% of pixels, then it is considered to be noise-dominated and hence unusable.
| Quadrant | # 1 sec bins | Bins with >0 counts | Bins with >2000 counts | High rate bins dominated by noise | Noise dominated (total time) | Noise dominated (detector-on time) | Marked lightcurve |
|---|---|---|---|---|---|---|---|
| A | 39721 | 30003 | 0 | 0 | 0.00% | 0.00% | 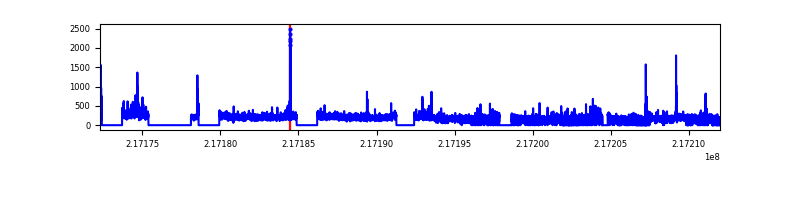 |
| B | 39721 | 30060 | 0 | 0 | 0.00% | 0.00% | 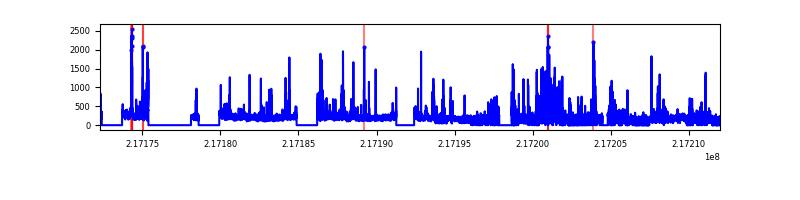 |
| C | 39721 | 29937 | 0 | 0 | 0.00% | 0.00% | 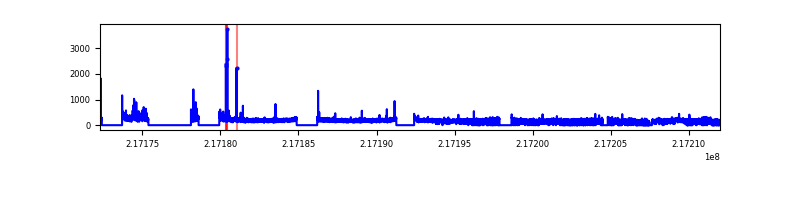 |
| D | 39721 | 30025 | 0 | 0 | 0.00% | 0.00% | 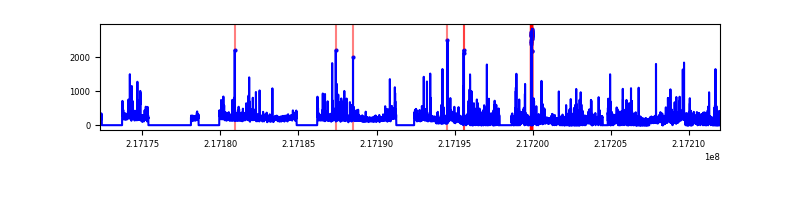 |
Top three noisy pixels from each quadrant. If the there are fewer than three noisy pixels in the level2.evt file, extra rows are filled as -1
| Pixel properties | Quadrant properties | ||||||
|---|---|---|---|---|---|---|---|
| Quadrant | DetID | PixID | Counts | Sigma | Mean | Median | Sigma |
| A | 0 | 29 | 1543 | 10.51 | 428 | 400 | 108.8 |
| A | 7 | 110 | 1394 | 9.14 | 428 | 400 | 108.8 |
| A | 0 | 28 | 1195 | 7.31 | 428 | 400 | 108.8 |
| B | 2 | 9 | 1364 | 11.23 | 422 | 401 | 85.8 |
| B | 12 | 226 | 1107 | 8.23 | 422 | 401 | 85.8 |
| B | 3 | 17 | 1070 | 7.8 | 422 | 401 | 85.8 |
| C | 1 | 65 | 1179 | 6.85 | 424 | 393 | 114.8 |
| C | 1 | 80 | 1154 | 6.63 | 424 | 393 | 114.8 |
| C | 1 | 81 | 1131 | 6.43 | 424 | 393 | 114.8 |
| D | 6 | 231 | 1061 | 6.51 | 396 | 359 | 107.8 |
| D | 7 | 3 | 1049 | 6.4 | 396 | 359 | 107.8 |
| D | 1 | 3 | 1022 | 6.15 | 396 | 359 | 107.8 |
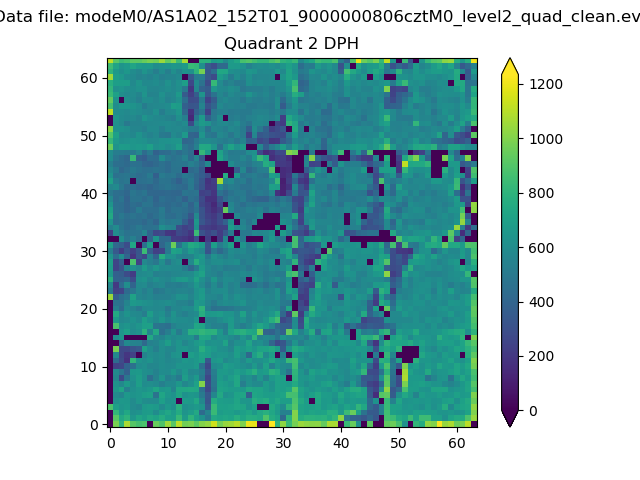
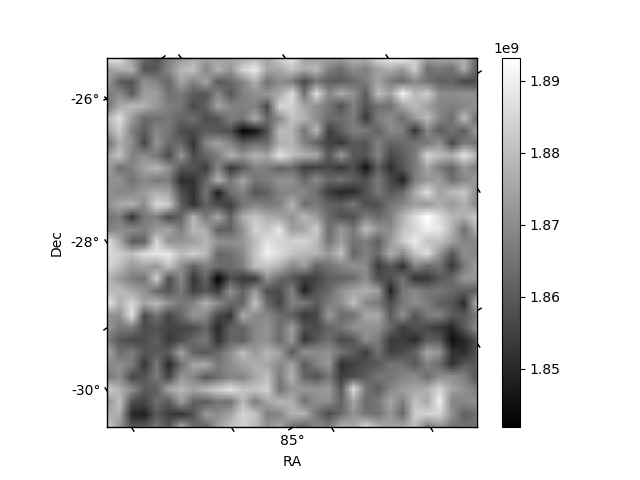
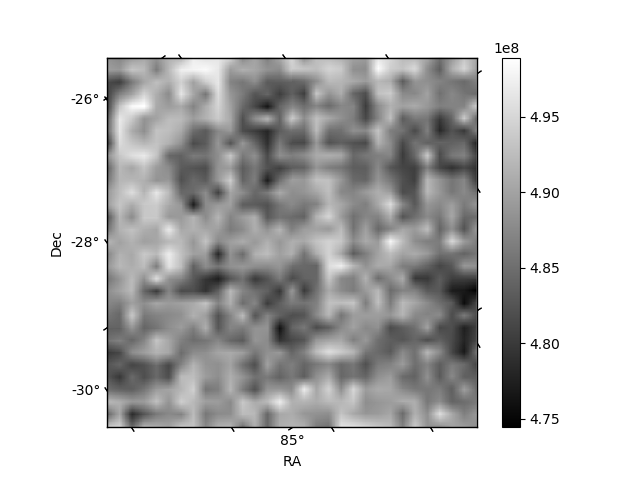
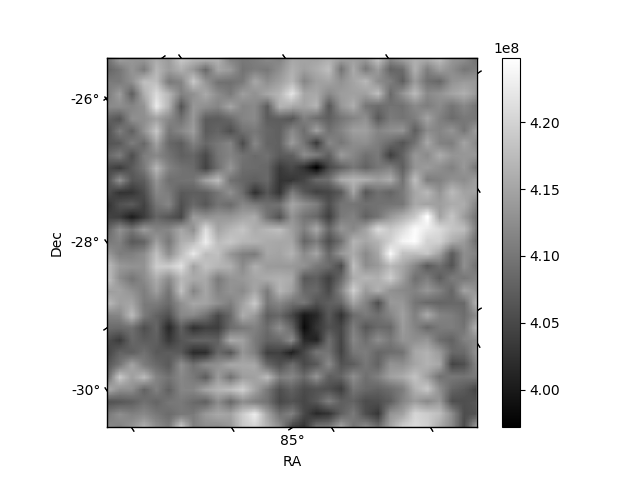
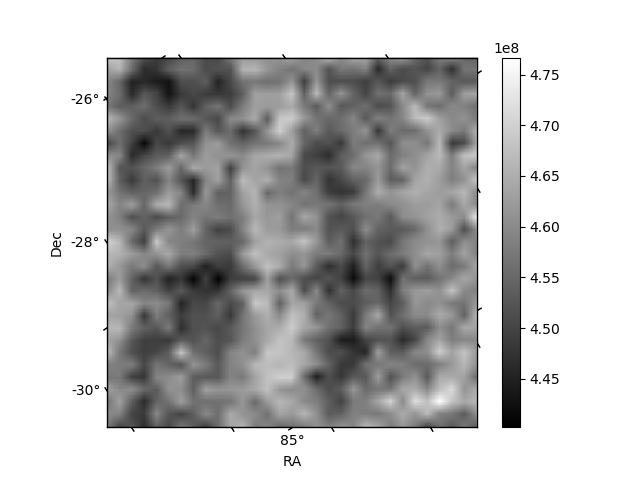
Histogram calculated using DETX and DETY for each event in the final _common_clean file
| Quadrant A | 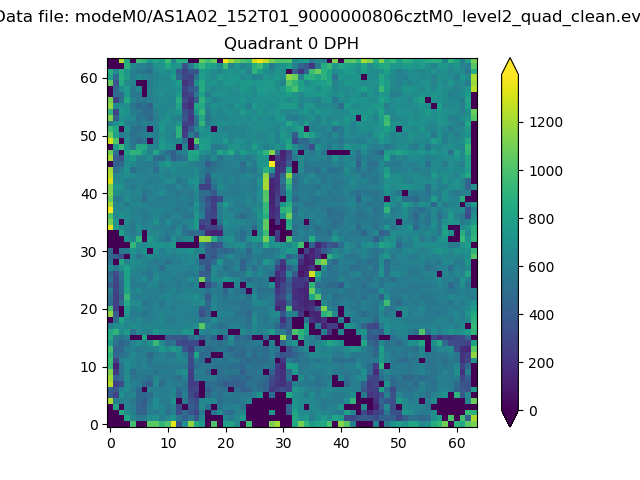 |
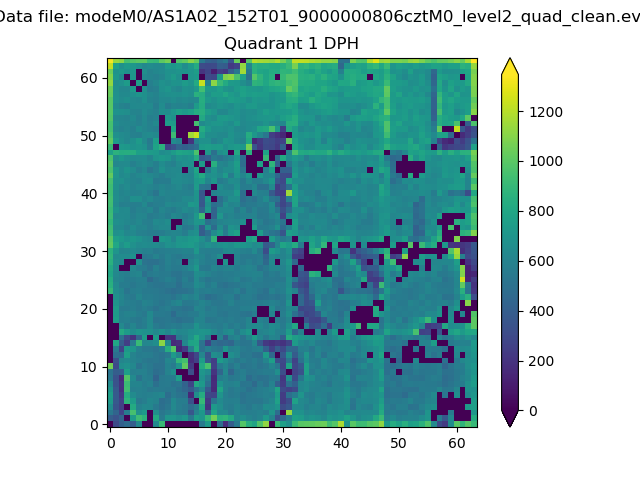 |
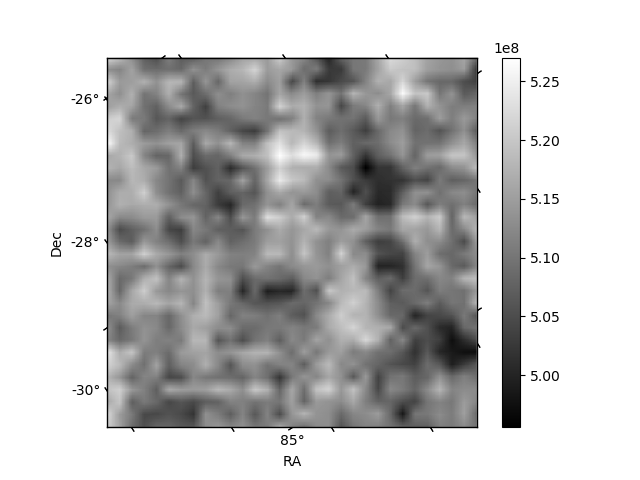
Quadrant B |
|---|---|---|---|
| Quadrant D | 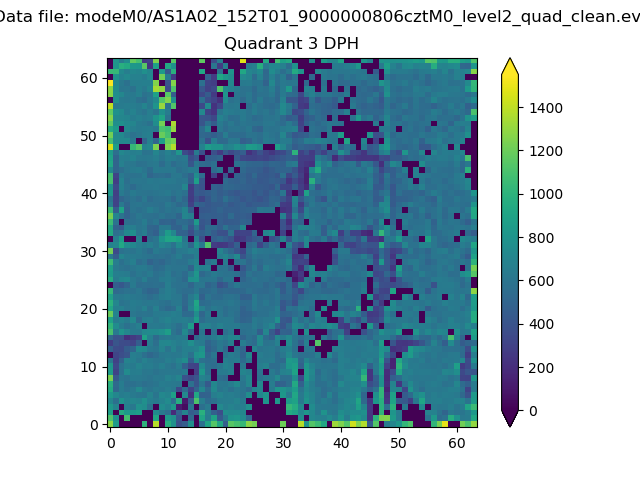 |
 |
Quadrant C |
| Plot type | Count rate plots | Images |
|---|---|---|
| Comparison with Poisson distribution Blue bars denote a histogram of data divided into 1 sec bins. Red curve is a Poisson curve with rate = median count rate of data. |
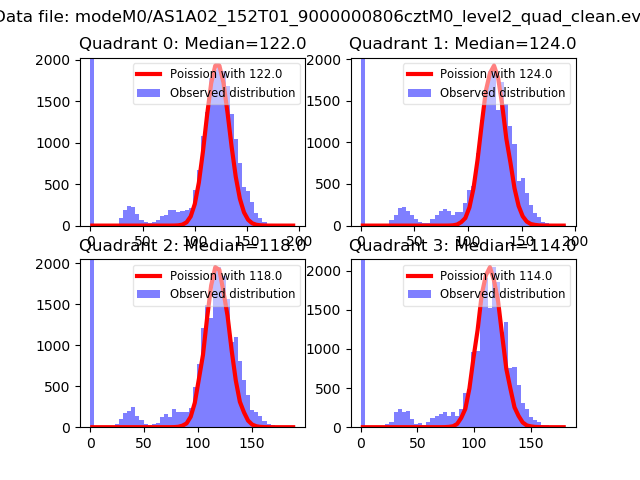 |
 |
| Quadrant-wise count rates Data is divided into 100 sec bins |
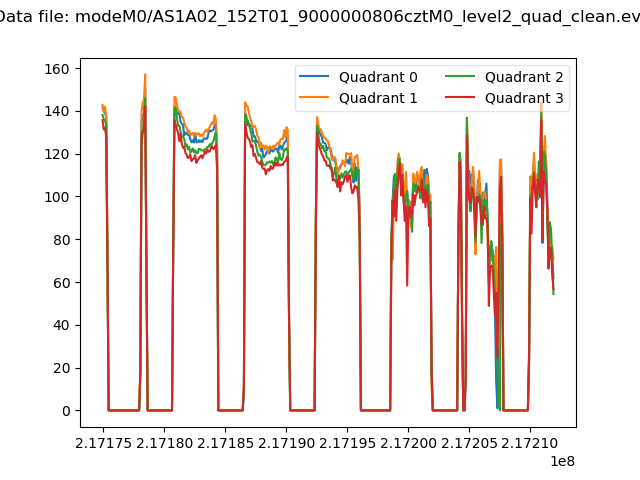 |
|
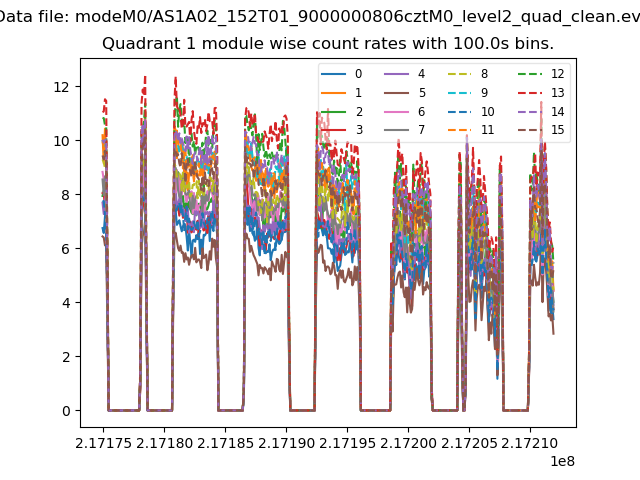
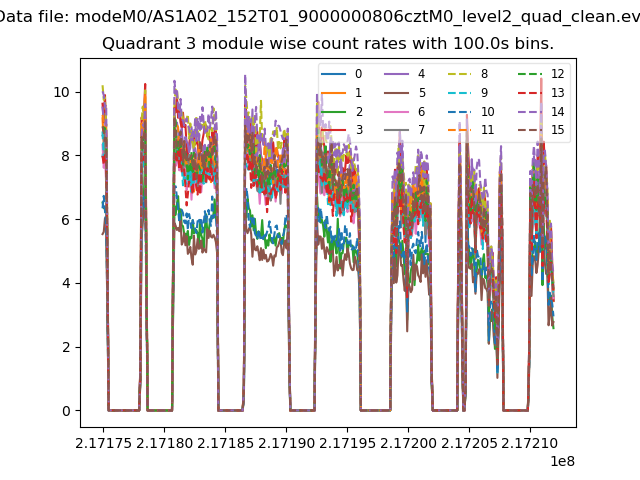
| Module-wise count rates for Quadrant A Data is divided into 100 sec bins |
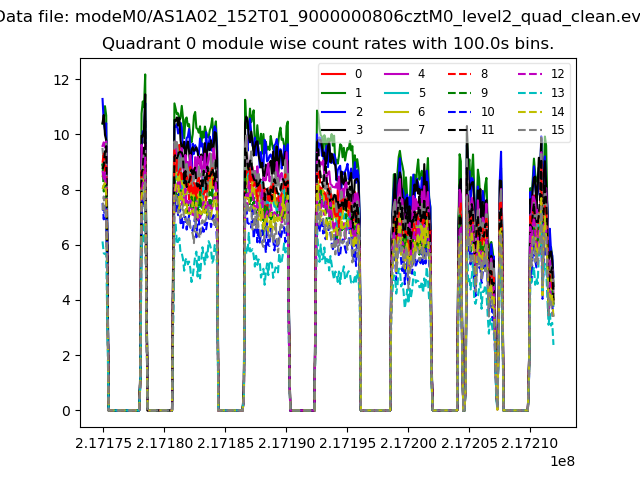 |
 |
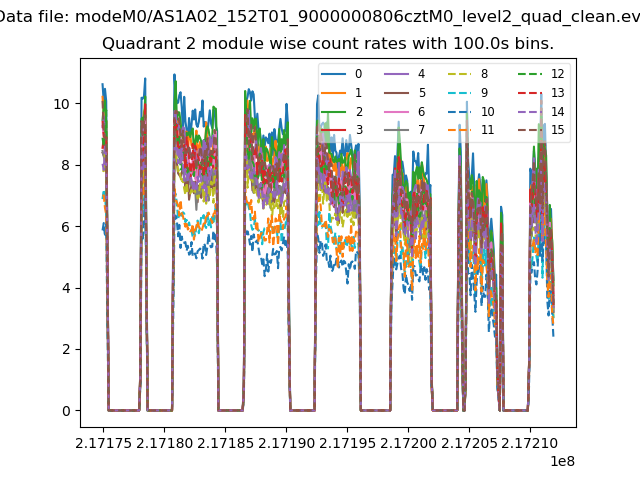
| Module-wise count rates for Quadrant B Data is divided into 100 sec bins |
 |
 |
| Module-wise count rates for Quadrant C Data is divided into 100 sec bins |
 |
 |
| Module-wise count rates for Quadrant D Data is divided into 100 sec bins |
 |
 |
| Parameter | Plot |
|---|---|
| CZT HV Monitor | 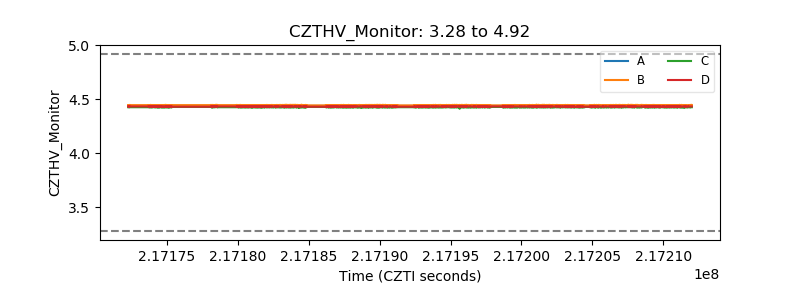 |
| D_VDD | 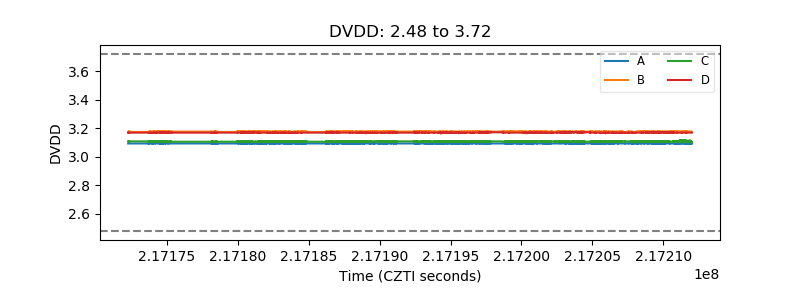 |
| Temperature 1 | 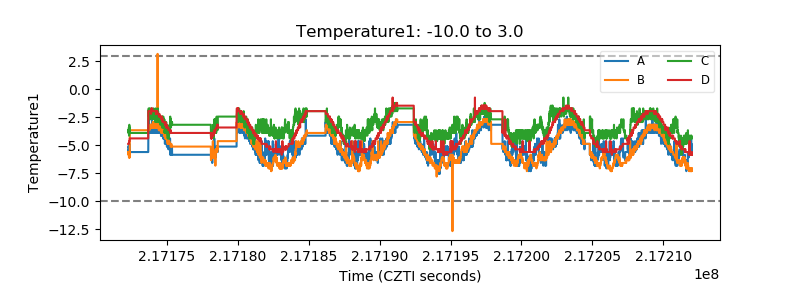 |
| Veto HV Monitor | 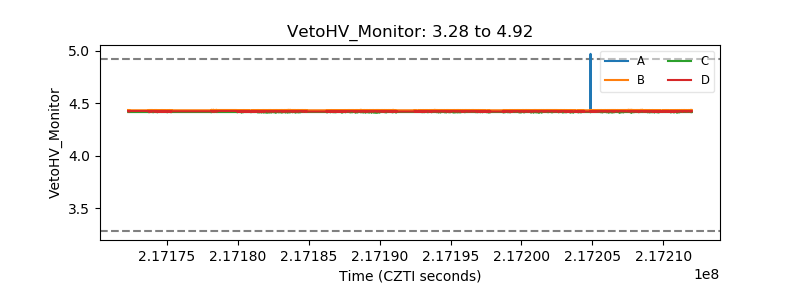 |
| Veto LLD | 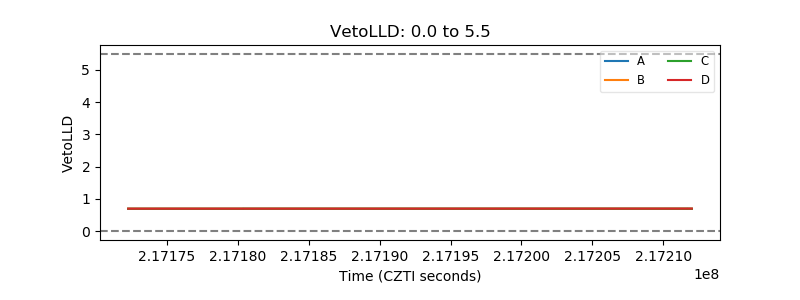 |
| Alpha Counter | 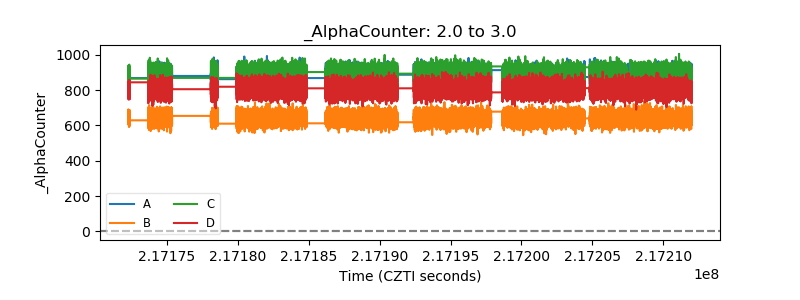 |
| _CPM_Rate | 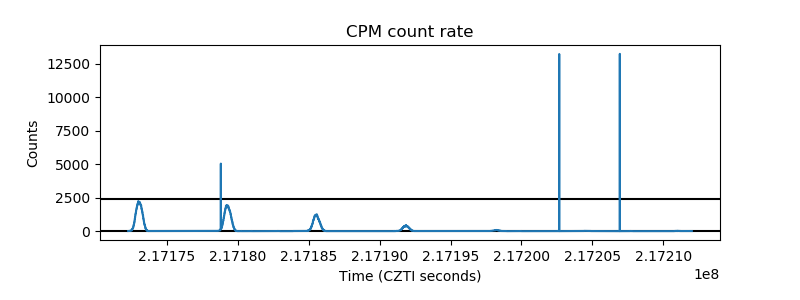 |
| CZT Counter | 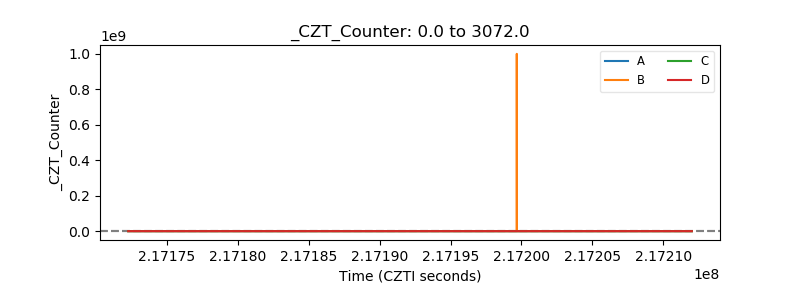 |
| +2.5 Volts monitor | 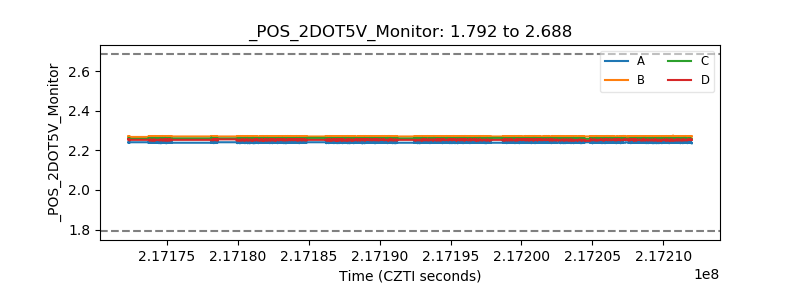 |
| +5 Volts monitor | 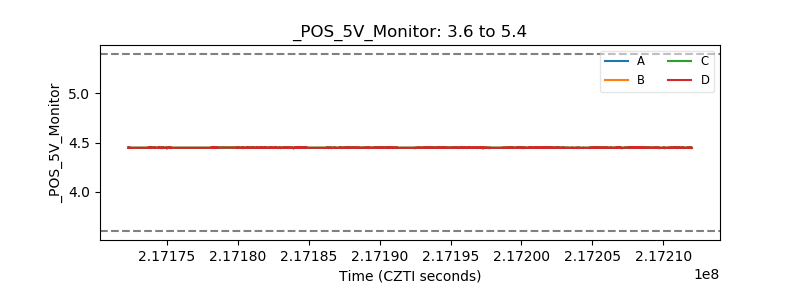 |
| _ROLL_ROT | 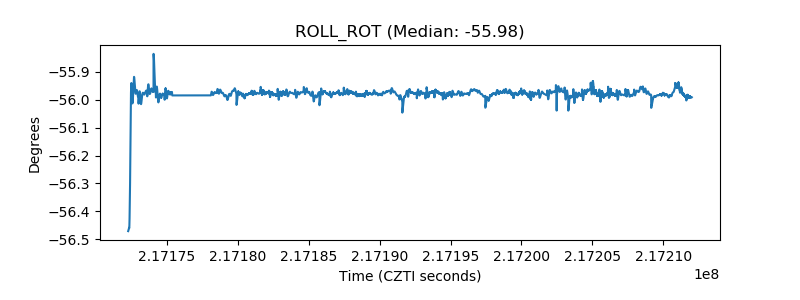 |
| _Roll_DEC | 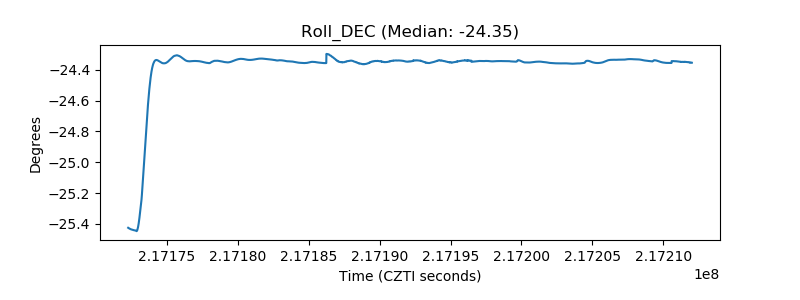 |
| _Roll_RA | 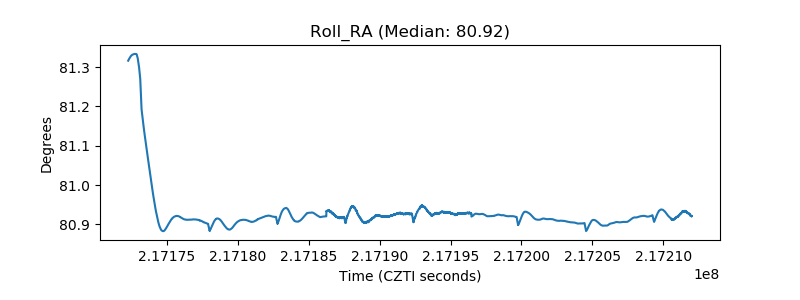 |
| Veto Counter | 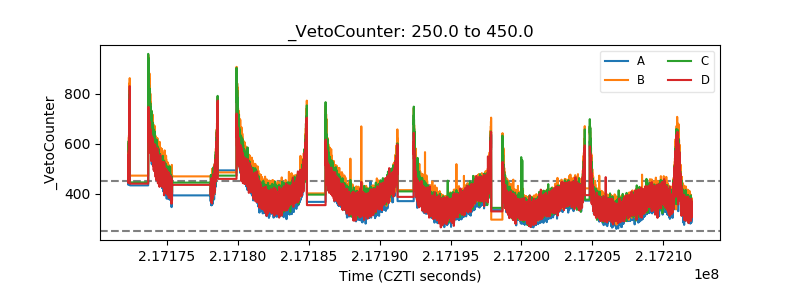 |