| Param | Original file | Final file |
|---|---|---|
| Filename | modeM0/AS1A02_152T01_9000000806_06179cztM0_level2.evt | modeM0/AS1A02_152T01_9000000806_06179cztM0_level2_quad_clean.evt |
| Size (bytes) | 150,413,760 | 12,585,600 |
| Size | 143.4 MB | 12.0 MB |
| Events in quadrant A | 1,117,848 | 63,326 |
| Events in quadrant B | 1,199,317 | 63,721 |
| Events in quadrant C | 1,078,213 | 61,660 |
| Events in quadrant D | 1,035,467 | 60,058 |
| Mode SS | |||
|---|---|---|---|
| Quadrant | BADHDUFLAG | Total packets | Discarded packets |
| A | 0 | 38 | 0 |
| B | 0 | 38 | 0 |
| C | 0 | 38 | 0 |
| D | 0 | 38 | 0 |
| Mode M0 | |||
|---|---|---|---|
| Quadrant | BADHDUFLAG | Total packets | Discarded packets |
| A | 0 | 4560 | 2 |
| B | 0 | 4703 | 1 |
| C | 0 | 4341 | 1 |
| D | 0 | 4187 | 1 |
| Mode M9 | |||
|---|---|---|---|
| Quadrant | BADHDUFLAG | Total packets | Discarded packets |
| A | 0 | 13 | 0 |
| B | 0 | 13 | 0 |
| C | 0 | 13 | 0 |
| D | 0 | 13 | 0 |
| Quadrant | Total seconds | Saturated seconds | Saturation percentage |
|---|---|---|---|
| A | 1796 | 71 | 3.953229% |
| B | 1796 | 108 | 6.013363% |
| C | 1796 | 45 | 2.505568% |
| D | 1796 | 51 | 2.839644% |
Noise dominated data is calculated using 1-second bins in cleaned event files. If a bin has >2000 counts, and if more than 50% of those come from <1% of pixels, then it is considered to be noise-dominated and hence unusable.
| Quadrant | # 1 sec bins | Bins with >0 counts | Bins with >2000 counts | High rate bins dominated by noise | Noise dominated (total time) | Noise dominated (detector-on time) | Marked lightcurve |
|---|---|---|---|---|---|---|---|
| A | 3096 | 1796 | 3 | 3 | 0.10% | 0.17% | 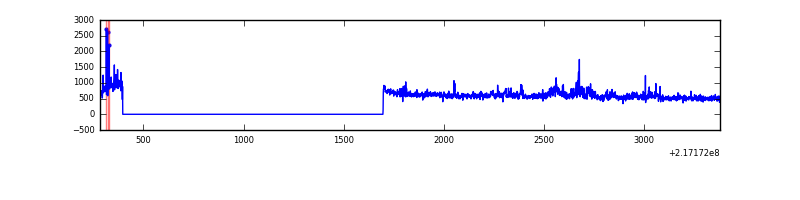 |
| B | 3096 | 1796 | 34 | 34 | 1.10% | 1.89% | 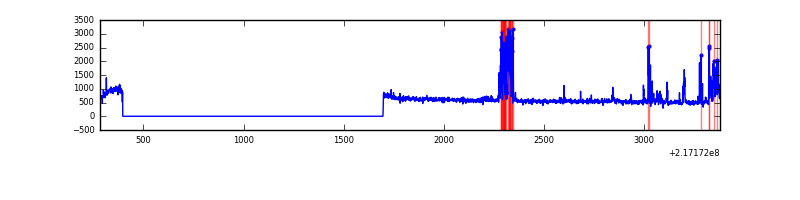 |
| C | 3096 | 1797 | 1 | 1 | 0.03% | 0.06% | 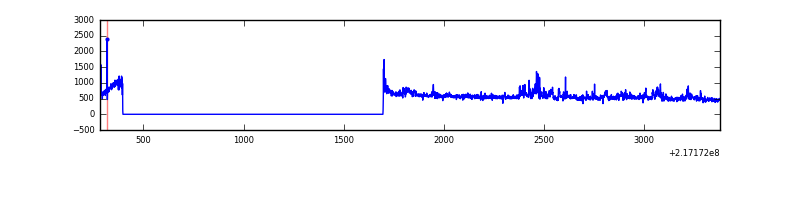 |
| D | 3096 | 1796 | 5 | 5 | 0.16% | 0.28% | 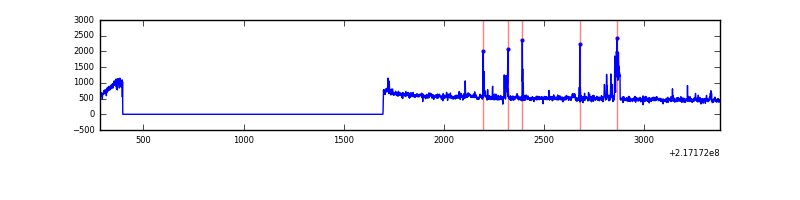 |
Top three noisy pixels from each quadrant. If the there are fewer than three noisy pixels in the level2.evt file, extra rows are filled as -1
| Pixel properties | Quadrant properties | ||||||
|---|---|---|---|---|---|---|---|
| Quadrant | DetID | PixID | Counts | Sigma | Mean | Median | Sigma |
| A | 8 | 15 | 102121 | 1860.47 | 260 | 255 | 54.8 |
| A | 15 | 234 | 14585 | 261.72 | 260 | 255 | 54.8 |
| A | 0 | 226 | 2484 | 40.71 | 260 | 255 | 54.8 |
| B | 3 | 64 | 178337 | 3451.58 | 259 | 254 | 51.6 |
| B | 0 | 219 | 7299 | 136.55 | 259 | 254 | 51.6 |
| B | 12 | 111 | 4681 | 85.8 | 259 | 254 | 51.6 |
| C | 12 | 16 | 97678 | 1637.0 | 249 | 250 | 59.5 |
| C | 1 | 16 | 7924 | 128.94 | 249 | 250 | 59.5 |
| C | 13 | 61 | 1950 | 28.56 | 249 | 250 | 59.5 |
| D | 2 | 63 | 39567 | 632.37 | 249 | 242 | 62.2 |
| D | 5 | 97 | 18963 | 301.04 | 249 | 242 | 62.2 |
| D | 8 | 195 | 15457 | 244.67 | 249 | 242 | 62.2 |
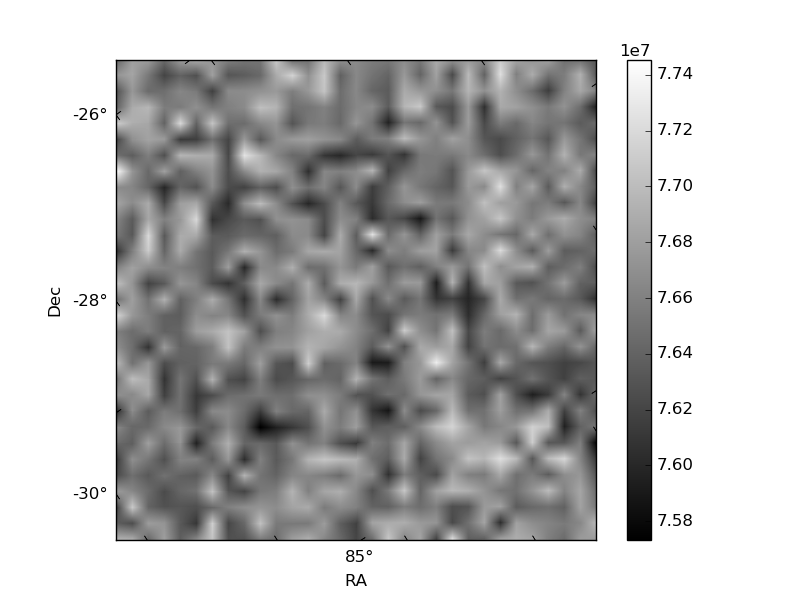
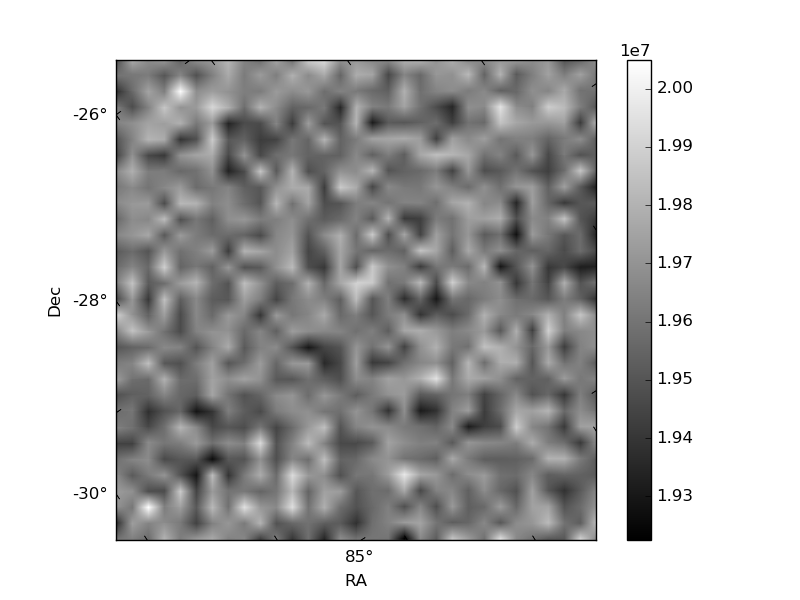
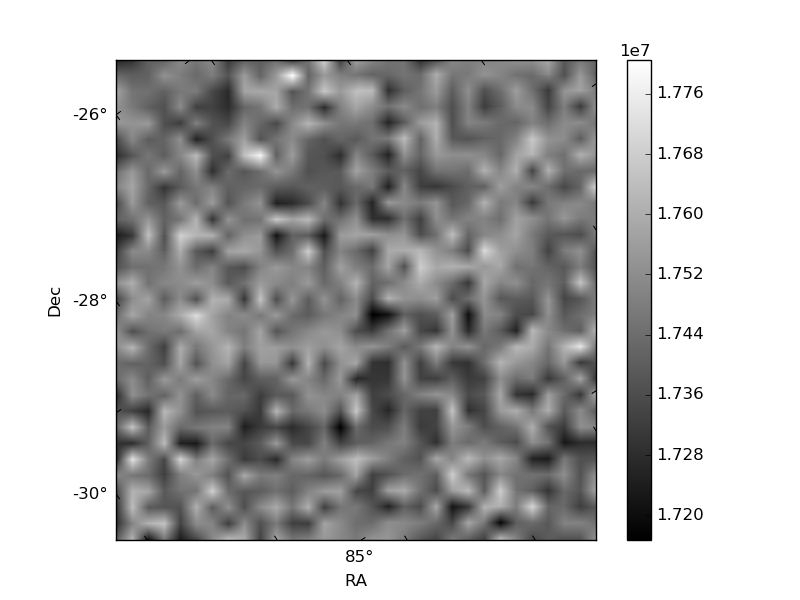
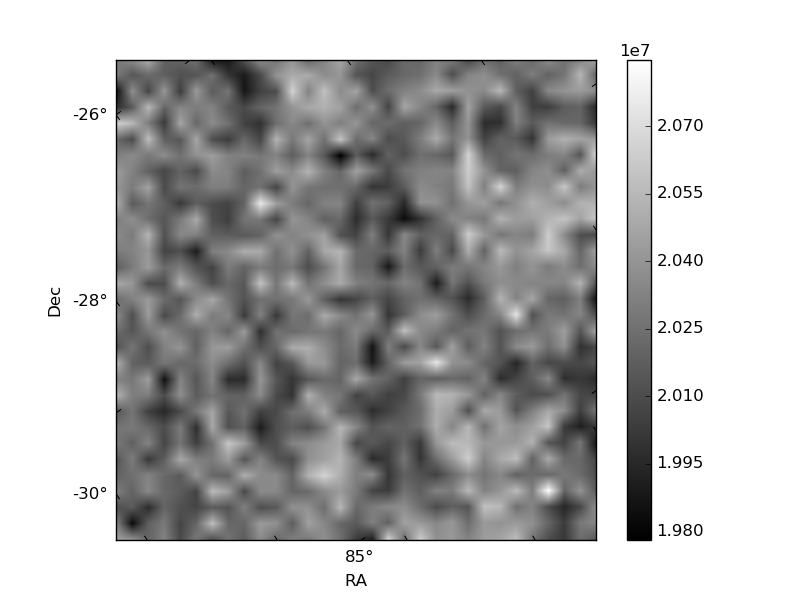
Histogram calculated using DETX and DETY for each event in the final _common_clean file
| Quadrant A | 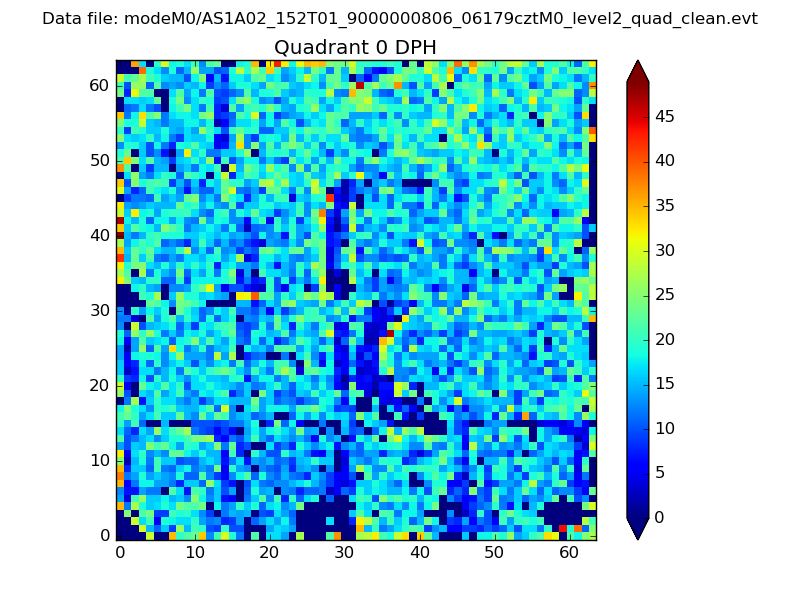 |
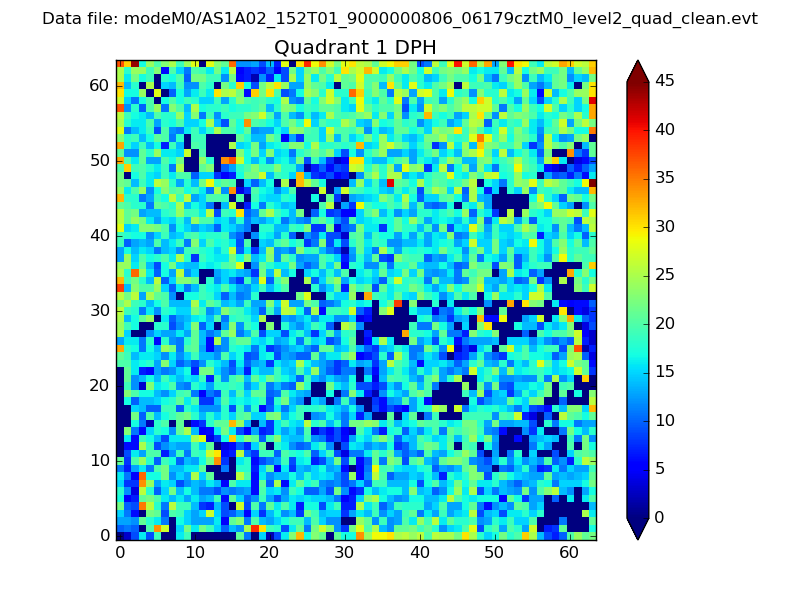 |
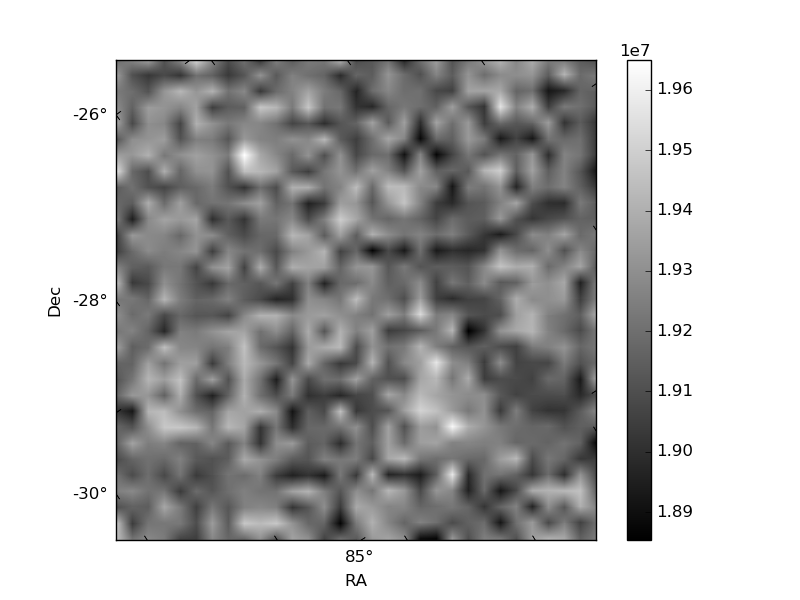
Quadrant B |
|---|---|---|---|
| Quadrant D | 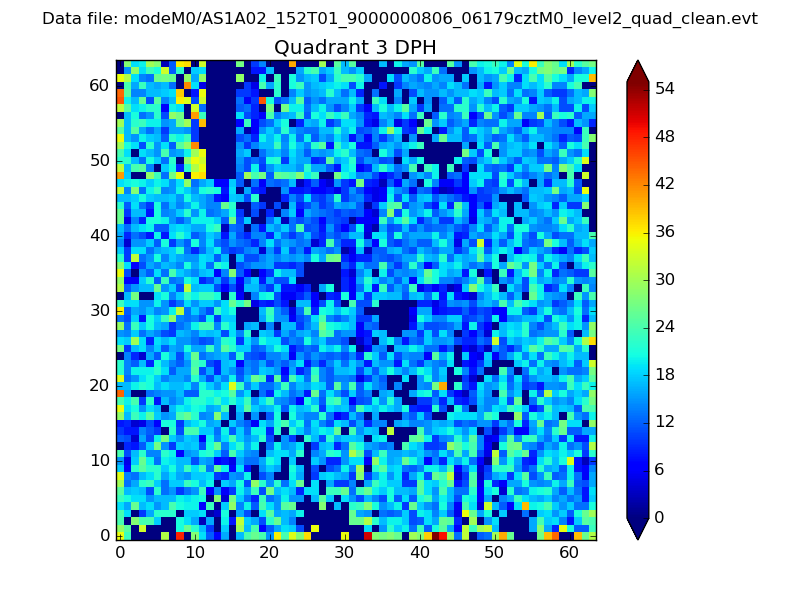 |
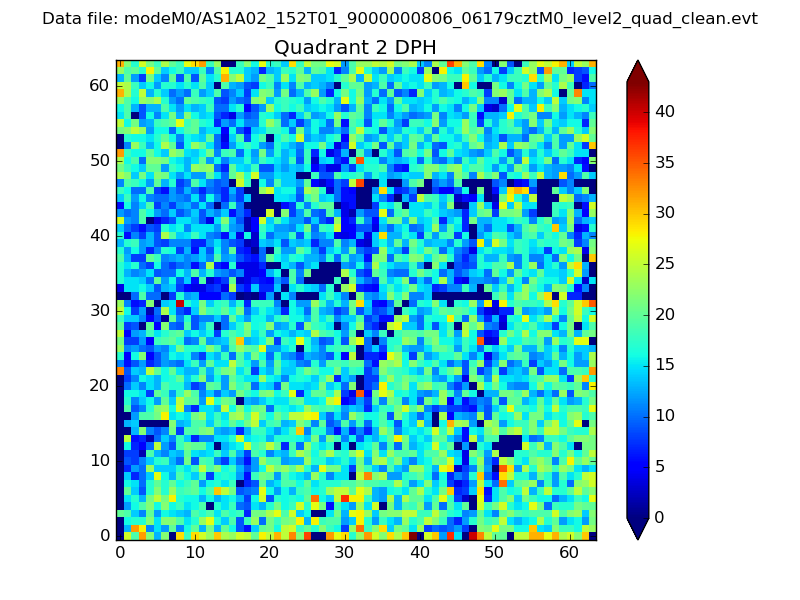 |
Quadrant C |
| Plot type | Count rate plots | Images |
|---|---|---|
| Comparison with Poisson distribution Blue bars denote a histogram of data divided into 1 sec bins. Red curve is a Poisson curve with rate = median count rate of data. |
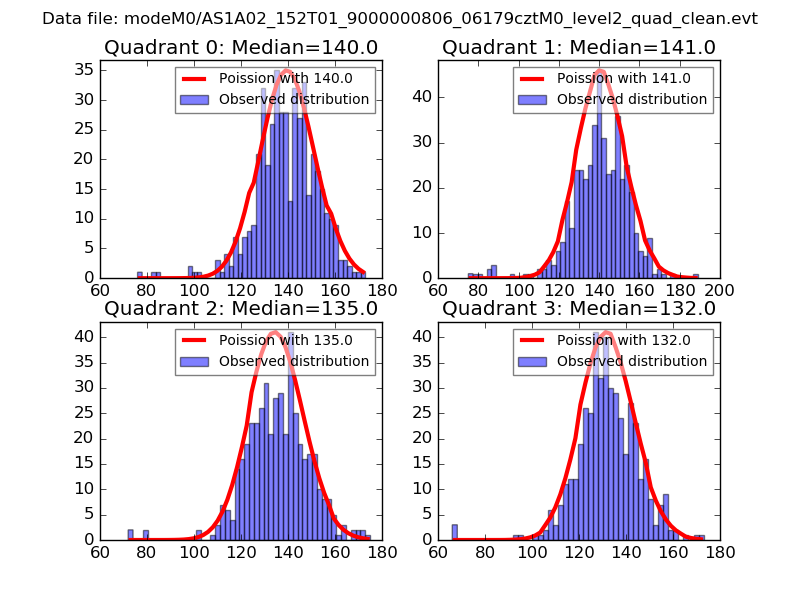 |
 |
| Quadrant-wise count rates Data is divided into 100 sec bins |
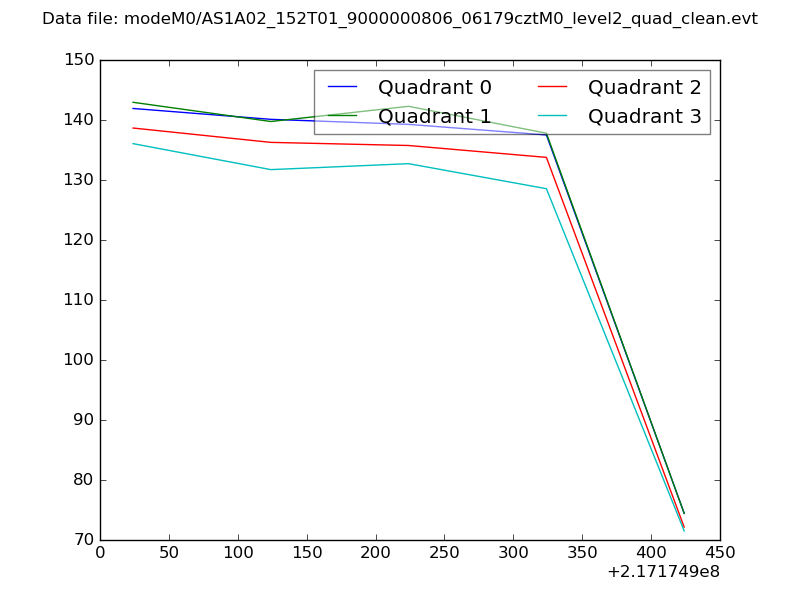 |
|
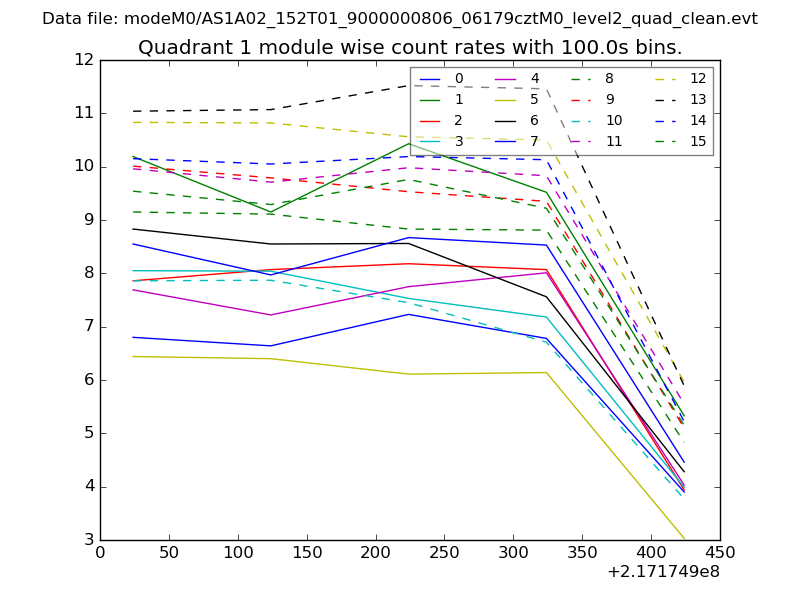
| Module-wise count rates for Quadrant A Data is divided into 100 sec bins |
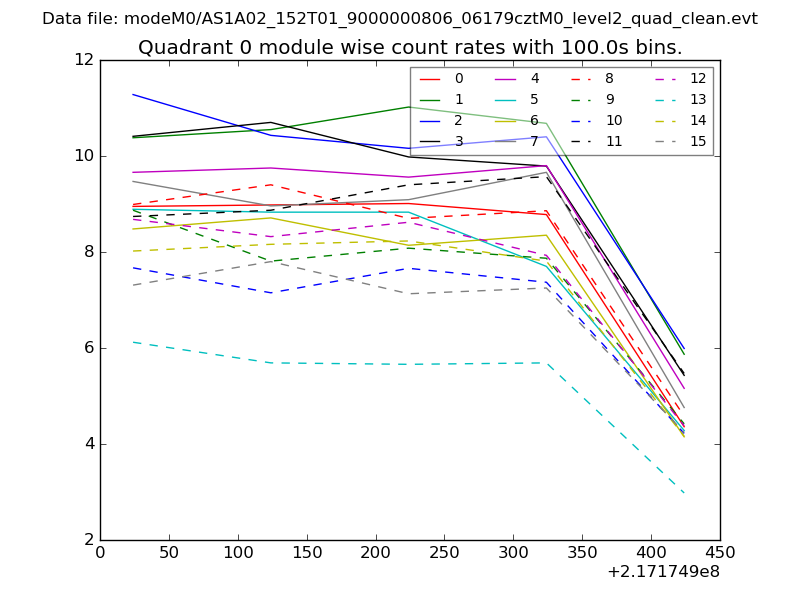 |
 |
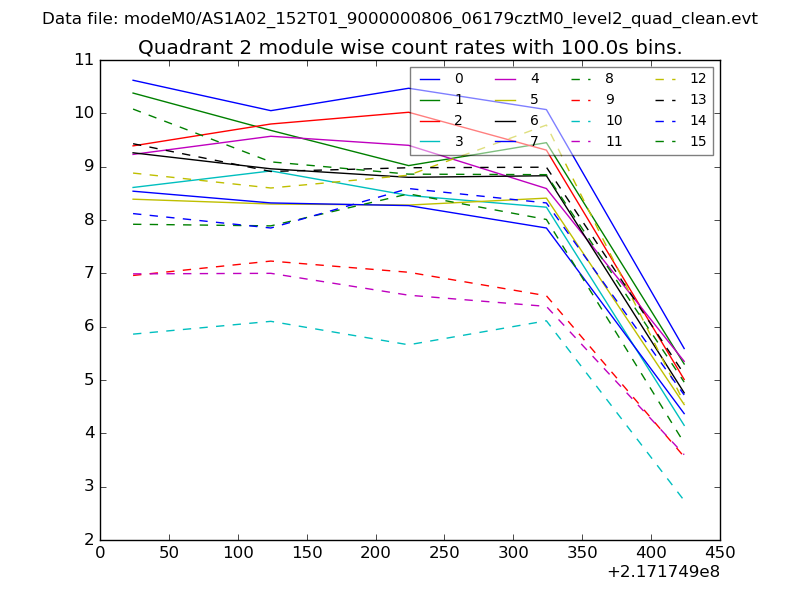
| Module-wise count rates for Quadrant B Data is divided into 100 sec bins |
 |
 |
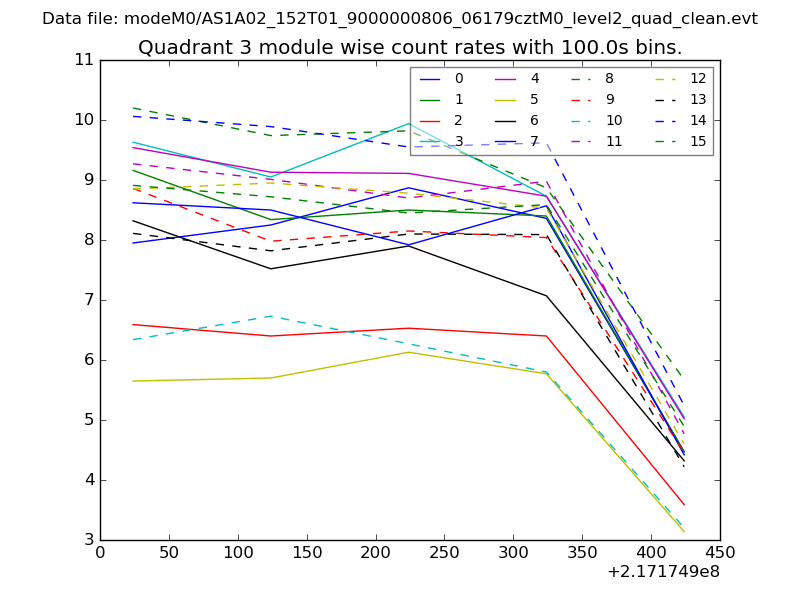
| Module-wise count rates for Quadrant C Data is divided into 100 sec bins |
 |
 |
| Module-wise count rates for Quadrant D Data is divided into 100 sec bins |
 |
 |
| Parameter | Plot |
|---|---|
| CZT HV Monitor | 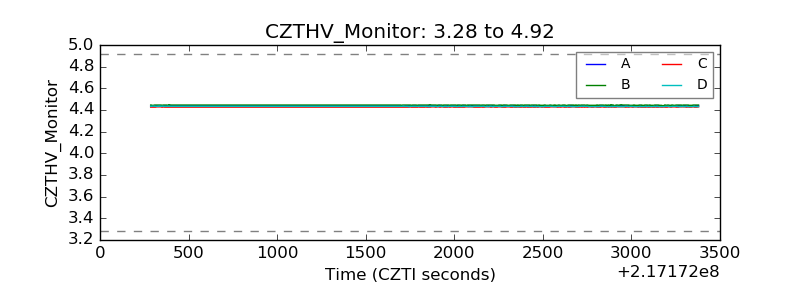 |
| D_VDD | 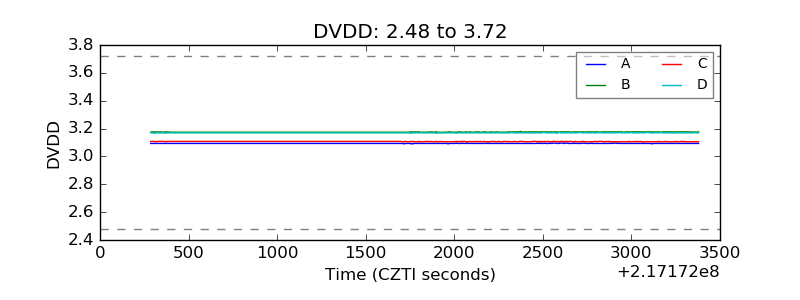 |
| Temperature 1 | 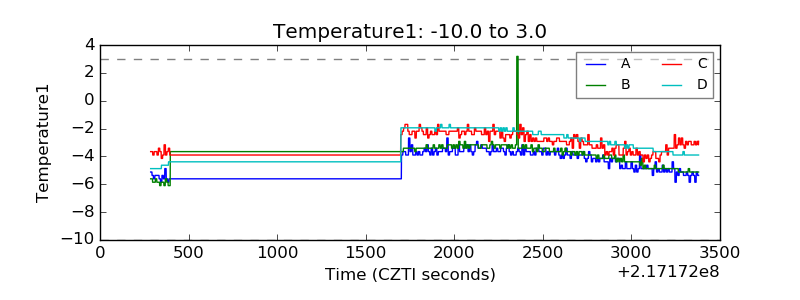 |
| Veto HV Monitor | 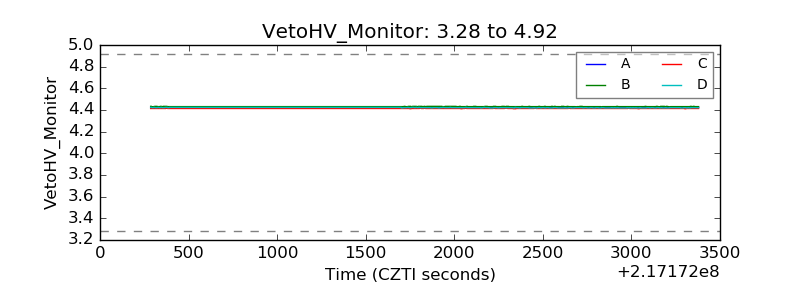 |
| Veto LLD | 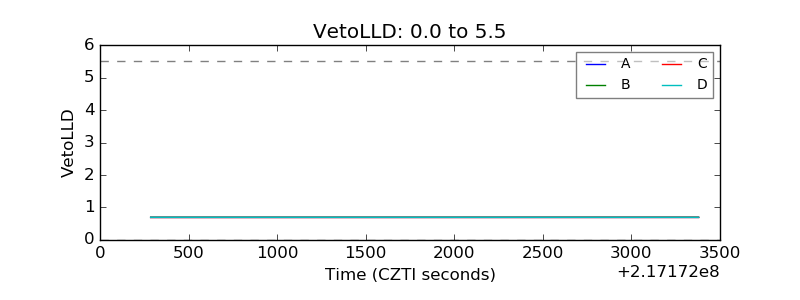 |
| Alpha Counter | 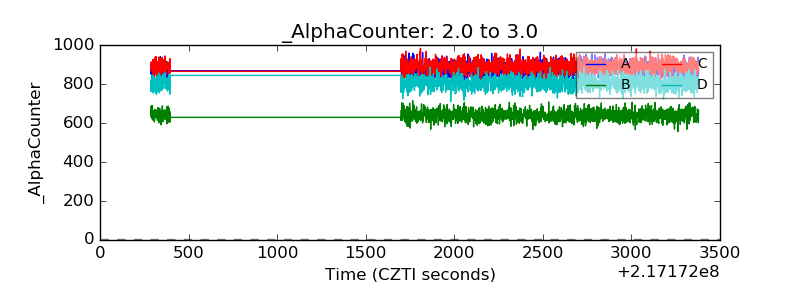 |
| _CPM_Rate | 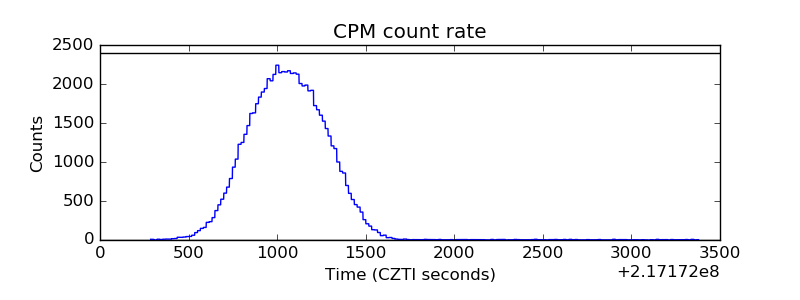 |
| CZT Counter | 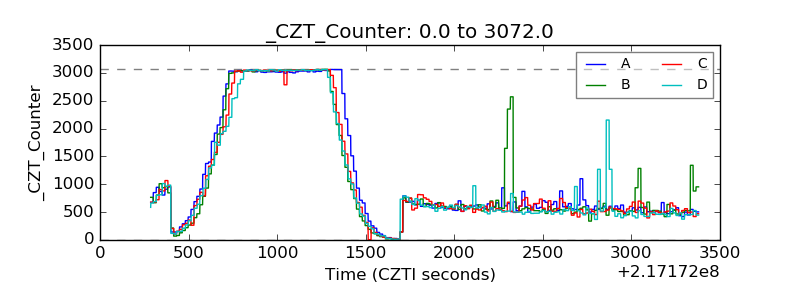 |
| +2.5 Volts monitor |  |
| +5 Volts monitor |  |
| _ROLL_ROT | 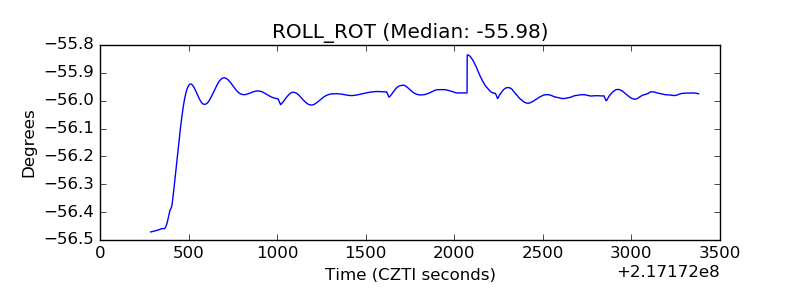 |
| _Roll_DEC | 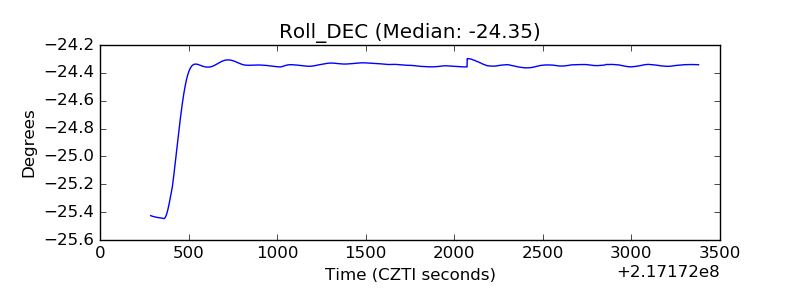 |
| _Roll_RA | 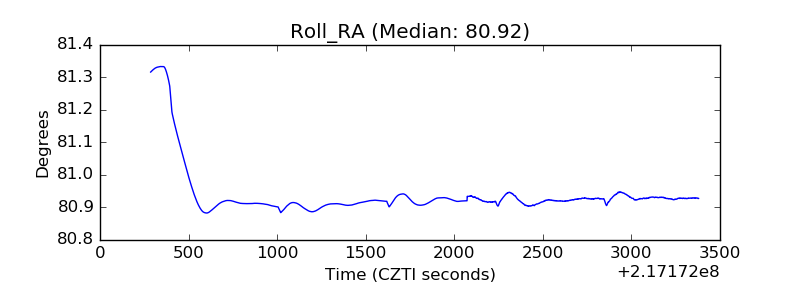 |
| Veto Counter | 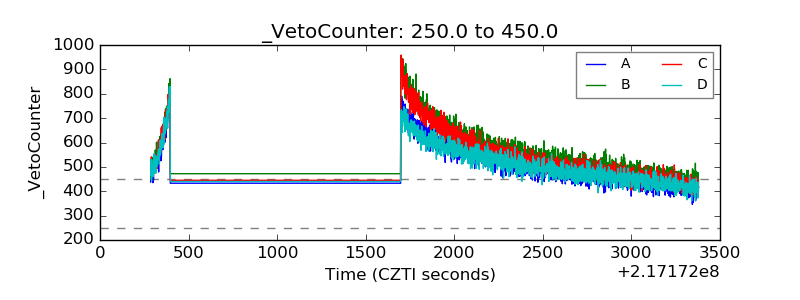 |