| Param | Original file | Final file |
|---|---|---|
| Filename | modeM0/AS1A02_152T01_9000000806_06181cztM0_level2.evt | modeM0/AS1A02_152T01_9000000806_06181cztM0_level2_quad_clean.evt |
| Size (bytes) | 472,665,600 | 102,447,360 |
| Size | 450.8 MB | 97.7 MB |
| Events in quadrant A | 3,540,898 | 667,829 |
| Events in quadrant B | 3,577,036 | 686,484 |
| Events in quadrant C | 3,347,508 | 646,925 |
| Events in quadrant D | 3,386,795 | 627,121 |
| Mode SS | |||
|---|---|---|---|
| Quadrant | BADHDUFLAG | Total packets | Discarded packets |
| A | 0 | 138 | 0 |
| B | 0 | 138 | 0 |
| C | 0 | 138 | 0 |
| D | 0 | 138 | 0 |
| Mode M0 | |||
|---|---|---|---|
| Quadrant | BADHDUFLAG | Total packets | Discarded packets |
| A | 0 | 14837 | 5 |
| B | 0 | 15061 | 2 |
| C | 0 | 14542 | 2 |
| D | 0 | 14717 | 2 |
| Mode M9 | |||
|---|---|---|---|
| Quadrant | BADHDUFLAG | Total packets | Discarded packets |
| A | 0 | 27 | 0 |
| B | 0 | 27 | 0 |
| C | 0 | 27 | 0 |
| D | 0 | 27 | 0 |
| Quadrant | Total seconds | Saturated seconds | Saturation percentage |
|---|---|---|---|
| A | 6814 | 162 | 2.377458% |
| B | 6815 | 168 | 2.465150% |
| C | 6815 | 108 | 1.584740% |
| D | 6815 | 93 | 1.364637% |
Noise dominated data is calculated using 1-second bins in cleaned event files. If a bin has >2000 counts, and if more than 50% of those come from <1% of pixels, then it is considered to be noise-dominated and hence unusable.
| Quadrant | # 1 sec bins | Bins with >0 counts | Bins with >2000 counts | High rate bins dominated by noise | Noise dominated (total time) | Noise dominated (detector-on time) | Marked lightcurve |
|---|---|---|---|---|---|---|---|
| A | 9460 | 6816 | 19 | 19 | 0.20% | 0.28% | 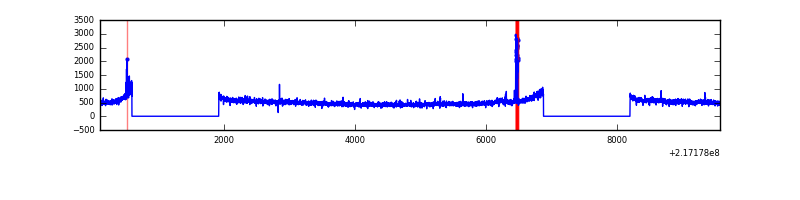 |
| B | 9460 | 6816 | 6 | 6 | 0.06% | 0.09% |  |
| C | 9460 | 6817 | 5 | 5 | 0.05% | 0.07% | 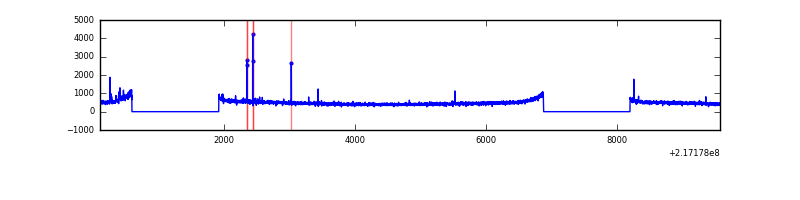 |
| D | 9460 | 6817 | 11 | 11 | 0.12% | 0.16% | 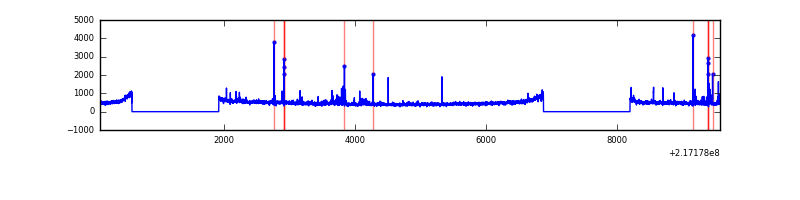 |
Top three noisy pixels from each quadrant. If the there are fewer than three noisy pixels in the level2.evt file, extra rows are filled as -1
| Pixel properties | Quadrant properties | ||||||
|---|---|---|---|---|---|---|---|
| Quadrant | DetID | PixID | Counts | Sigma | Mean | Median | Sigma |
| A | 8 | 15 | 87477 | 493.58 | 871 | 855 | 175.5 |
| A | 15 | 234 | 61855 | 347.58 | 871 | 855 | 175.5 |
| A | 13 | 251 | 37064 | 206.32 | 871 | 855 | 175.5 |
| B | 3 | 64 | 88699 | 521.49 | 883 | 864 | 168.4 |
| B | 4 | 80 | 26161 | 150.19 | 883 | 864 | 168.4 |
| B | 12 | 111 | 16586 | 93.34 | 883 | 864 | 168.4 |
| C | 12 | 16 | 58000 | 295.86 | 839 | 842 | 193.2 |
| C | 9 | 16 | 6973 | 31.73 | 839 | 842 | 193.2 |
| C | 13 | 61 | 6489 | 29.23 | 839 | 842 | 193.2 |
| D | 2 | 136 | 128890 | 621.25 | 839 | 815 | 206.2 |
| D | 8 | 195 | 32862 | 155.45 | 839 | 815 | 206.2 |
| D | 2 | 14 | 22854 | 106.9 | 839 | 815 | 206.2 |
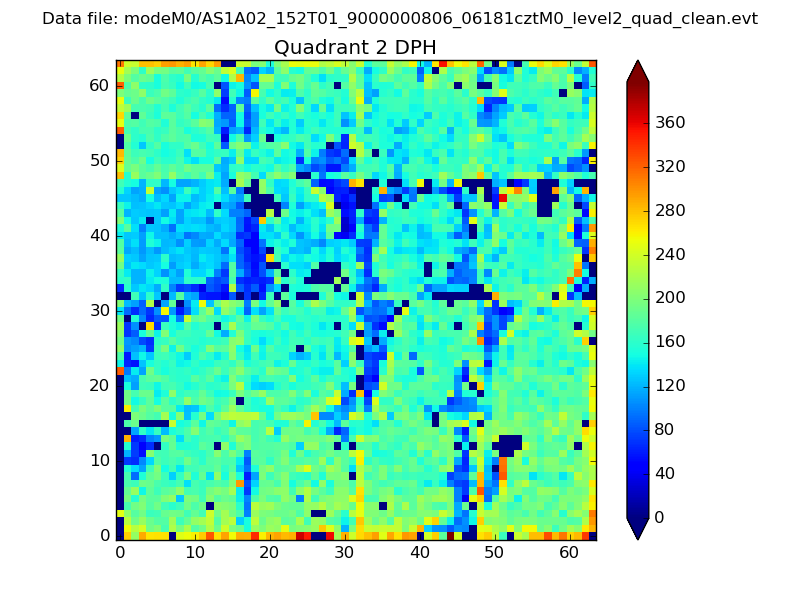
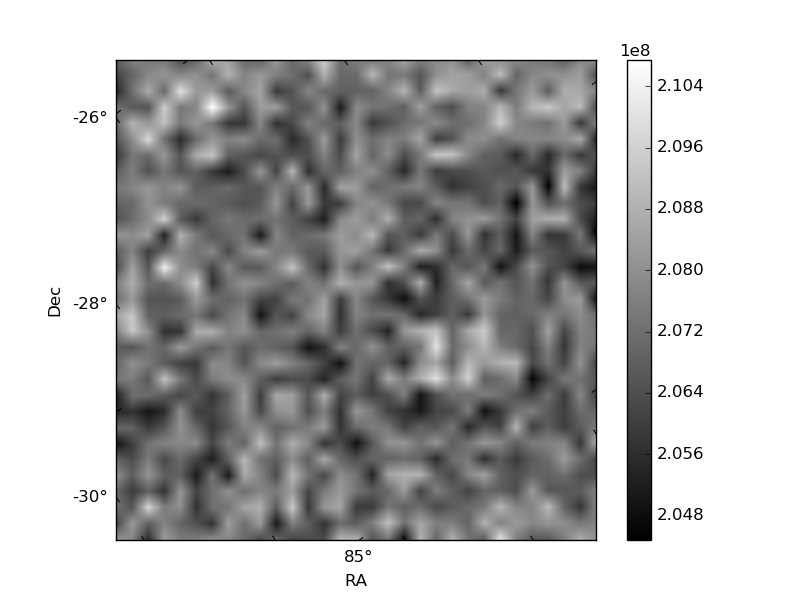
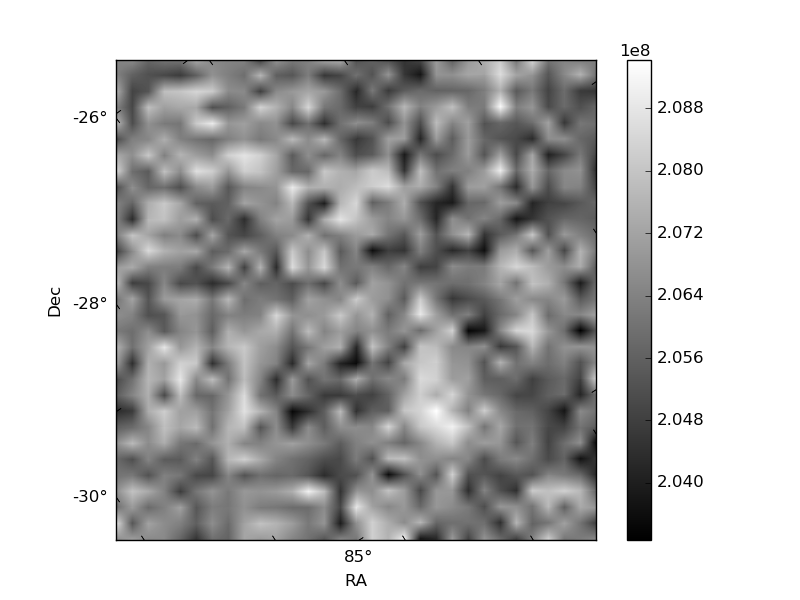
Histogram calculated using DETX and DETY for each event in the final _common_clean file
| Quadrant A | 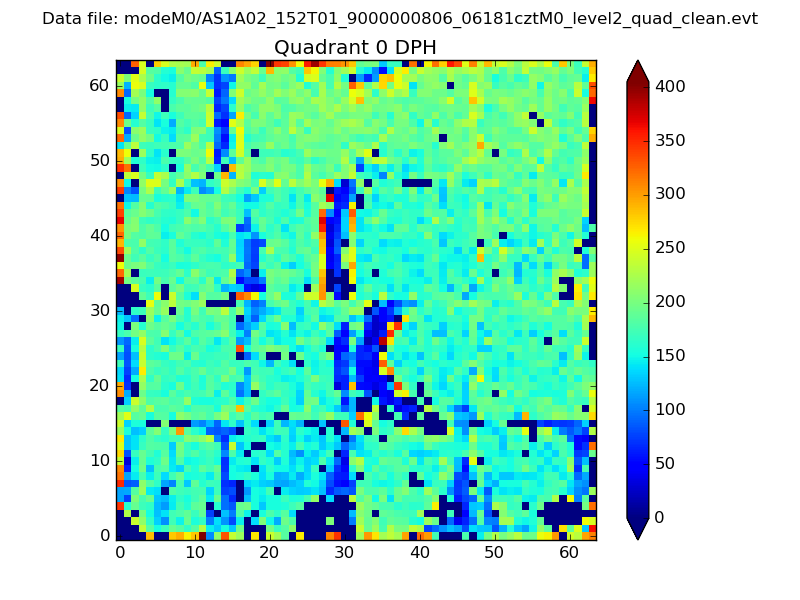 |
 |
Quadrant B |
|---|---|---|---|
| Quadrant D | 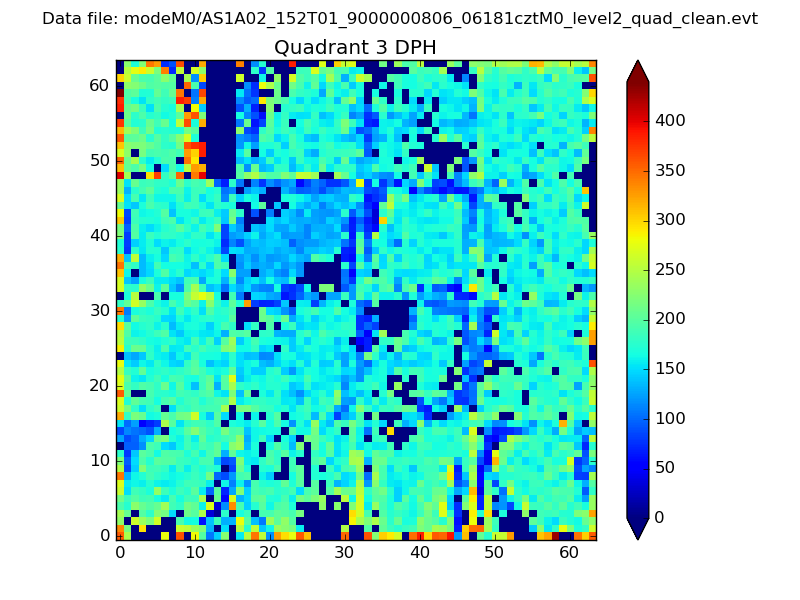 |
 |
Quadrant C |
| Plot type | Count rate plots | Images |
|---|---|---|
| Comparison with Poisson distribution Blue bars denote a histogram of data divided into 1 sec bins. Red curve is a Poisson curve with rate = median count rate of data. |
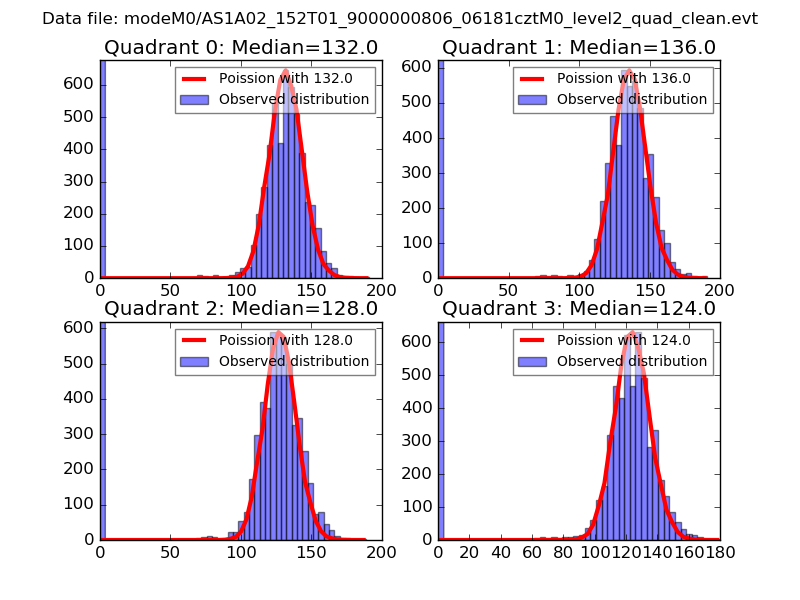 |
 |
| Quadrant-wise count rates Data is divided into 100 sec bins |
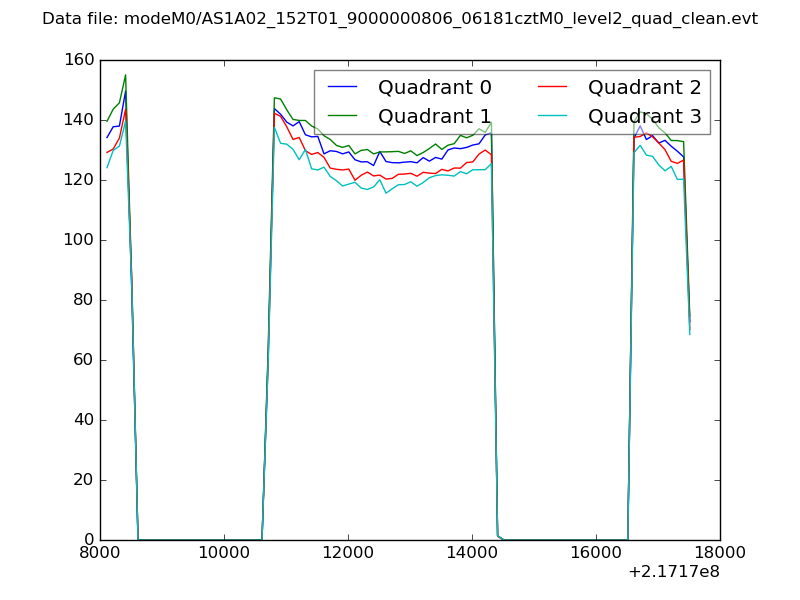 |
|
| Module-wise count rates for Quadrant A Data is divided into 100 sec bins |
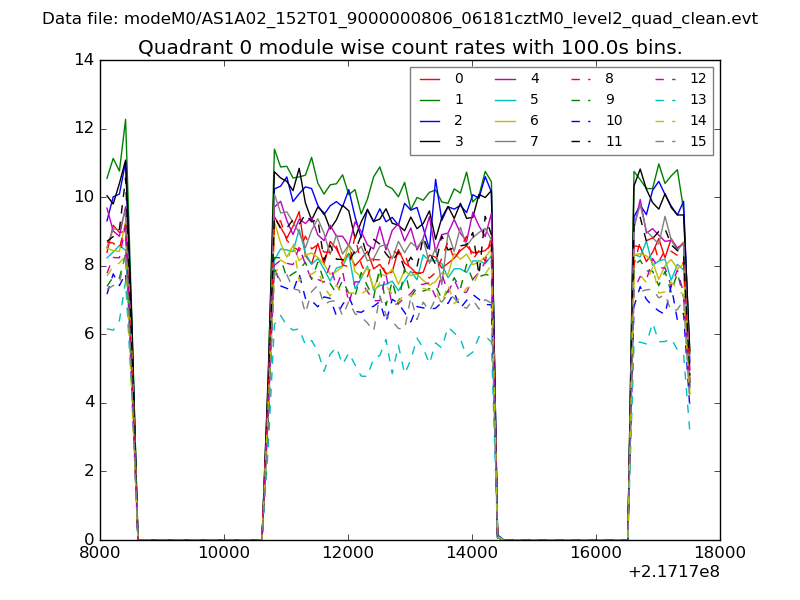 |
 |
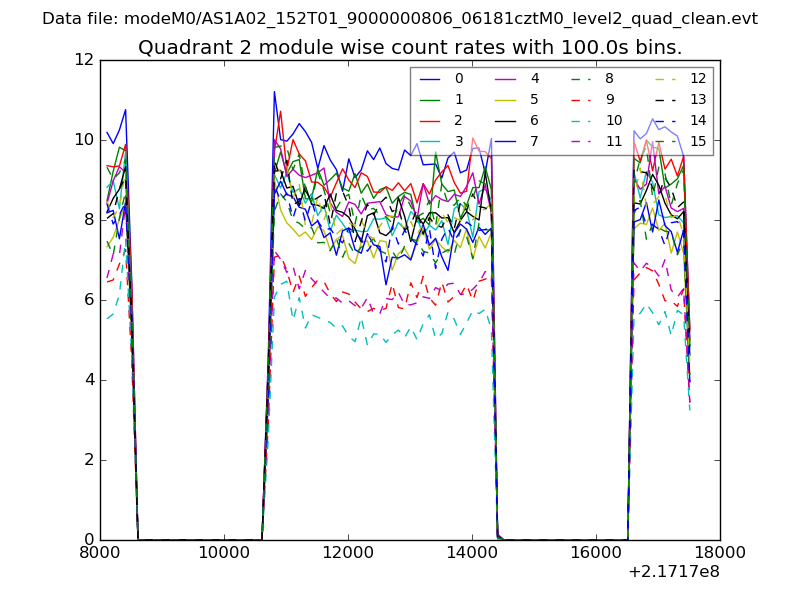
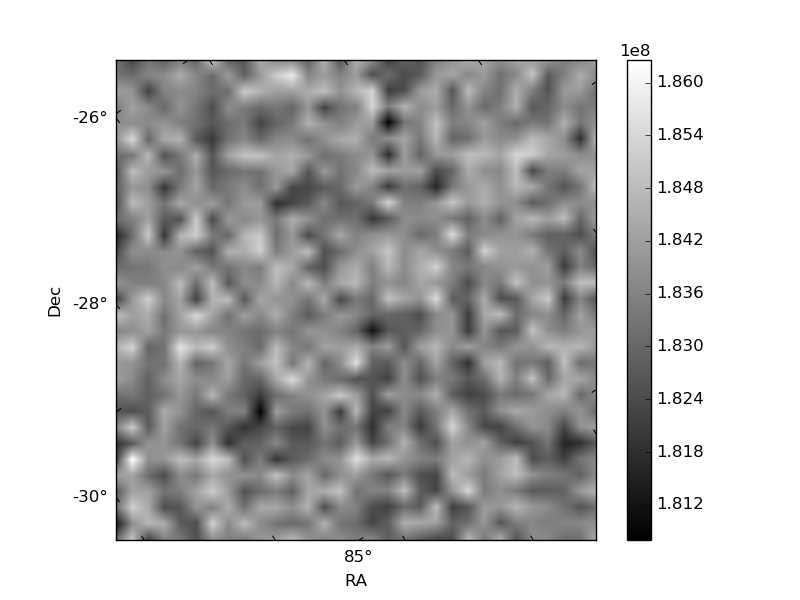
| Module-wise count rates for Quadrant B Data is divided into 100 sec bins |
 |
 |
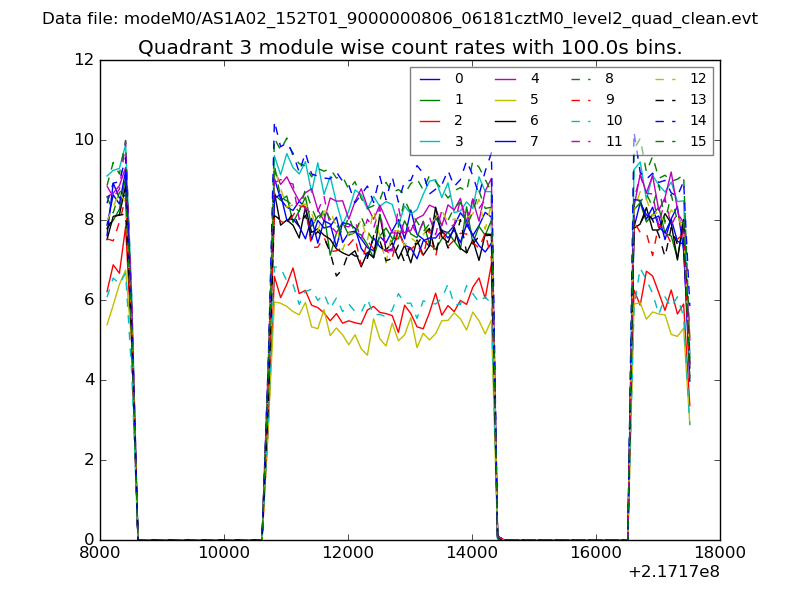
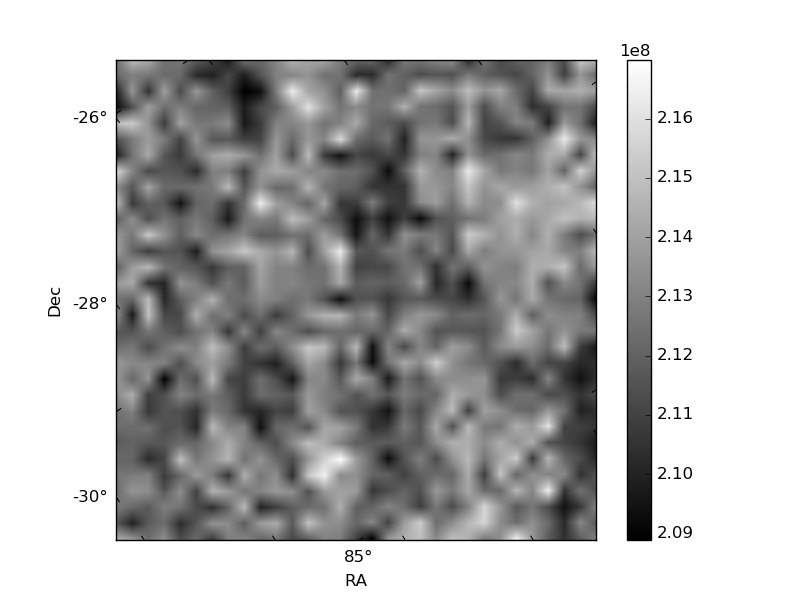
| Module-wise count rates for Quadrant C Data is divided into 100 sec bins |
 |
 |
| Module-wise count rates for Quadrant D Data is divided into 100 sec bins |
 |
 |
| Parameter | Plot |
|---|---|
| CZT HV Monitor | 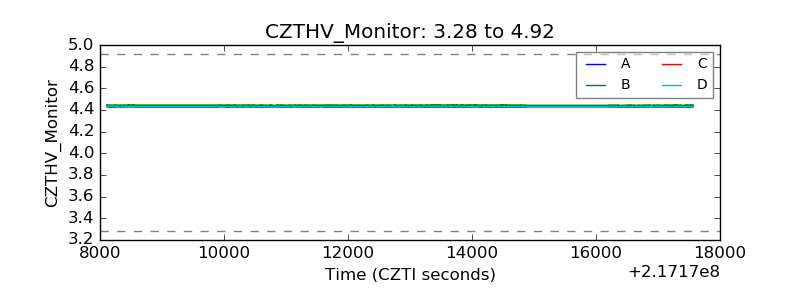 |
| D_VDD | 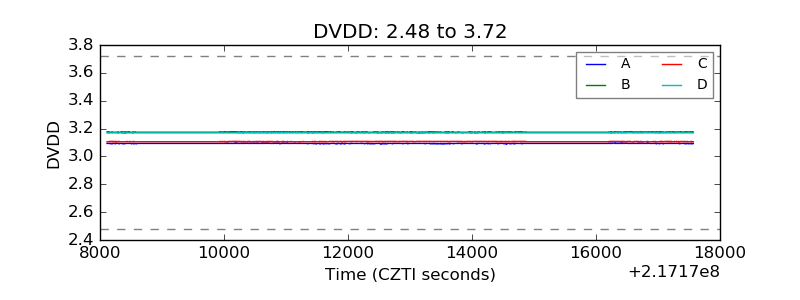 |
| Temperature 1 | 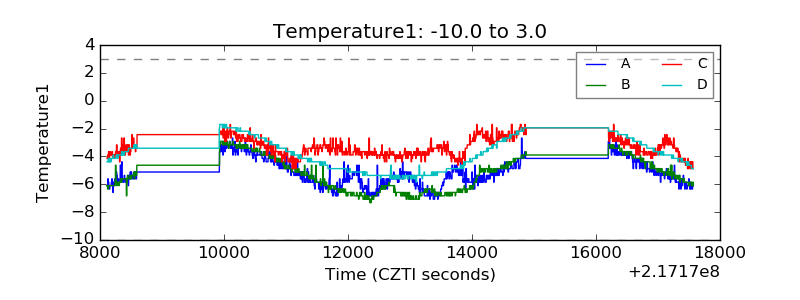 |
| Veto HV Monitor | 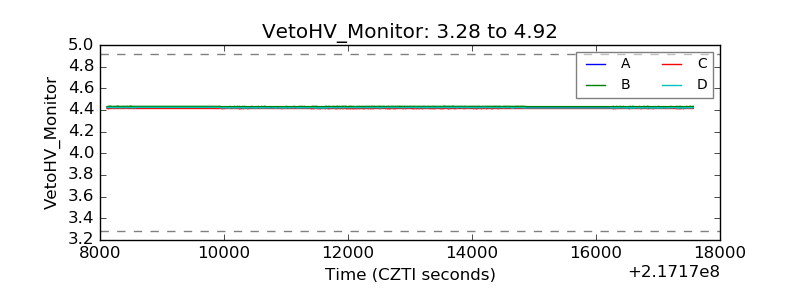 |
| Veto LLD | 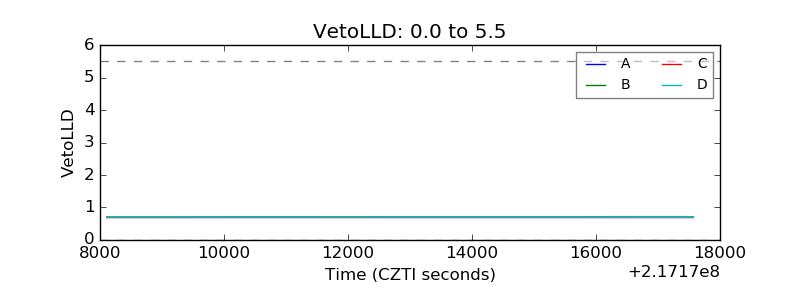 |
| Alpha Counter | 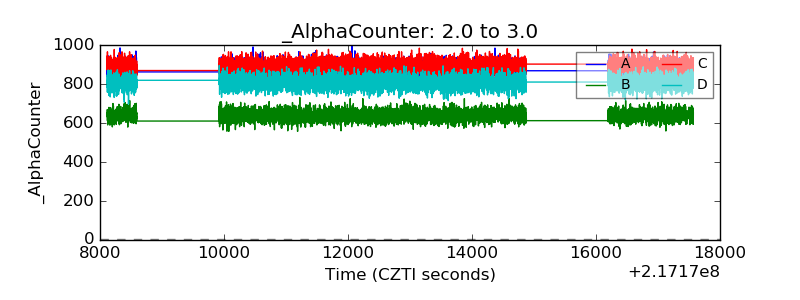 |
| _CPM_Rate | 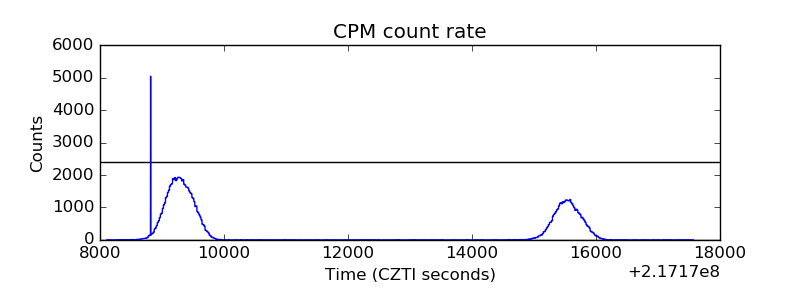 |
| CZT Counter | 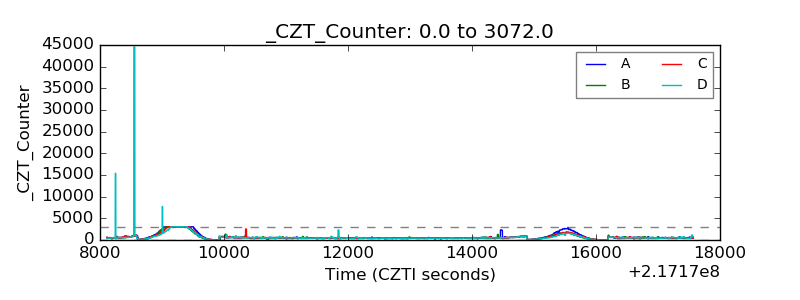 |
| +2.5 Volts monitor |  |
| +5 Volts monitor | 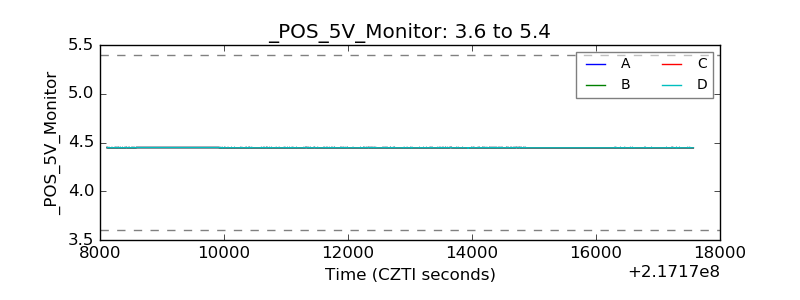 |
| _ROLL_ROT | 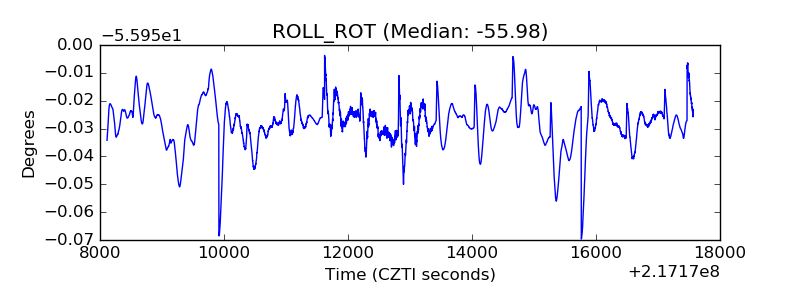 |
| _Roll_DEC | 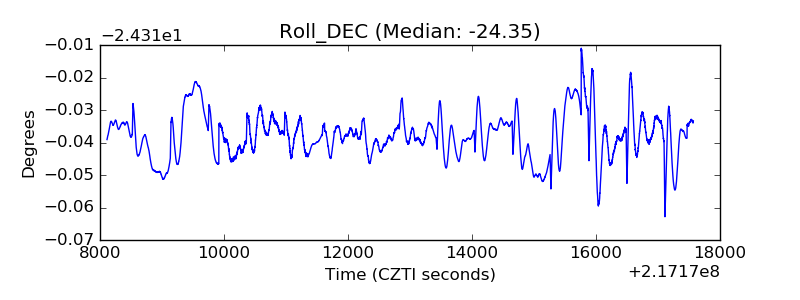 |
| _Roll_RA | 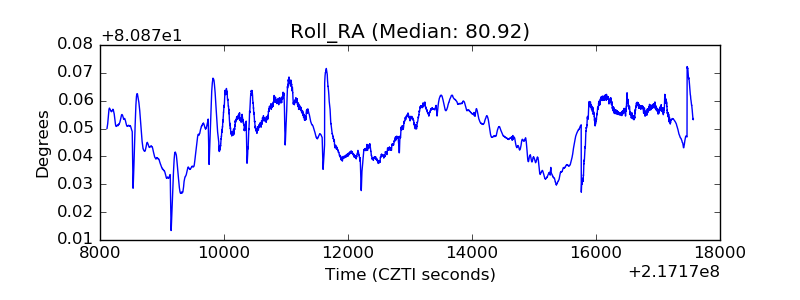 |
| Veto Counter | 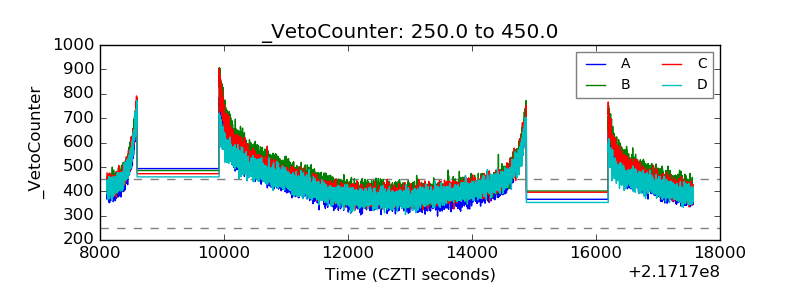 |