| Param | Original file | Final file |
|---|---|---|
| Filename | modeM0/AS1A02_152T01_9000000806_06182cztM0_level2.evt | modeM0/AS1A02_152T01_9000000806_06182cztM0_level2_quad_clean.evt |
| Size (bytes) | 422,406,720 | 95,826,240 |
| Size | 402.8 MB | 91.4 MB |
| Events in quadrant A | 3,123,753 | 623,999 |
| Events in quadrant B | 3,265,653 | 638,289 |
| Events in quadrant C | 2,925,605 | 605,616 |
| Events in quadrant D | 3,040,460 | 585,786 |
| Mode SS | |||
|---|---|---|---|
| Quadrant | BADHDUFLAG | Total packets | Discarded packets |
| A | 0 | 128 | 0 |
| B | 0 | 128 | 0 |
| C | 0 | 128 | 0 |
| D | 0 | 128 | 0 |
| Mode M0 | |||
|---|---|---|---|
| Quadrant | BADHDUFLAG | Total packets | Discarded packets |
| A | 0 | 13494 | 3 |
| B | 0 | 13948 | 2 |
| C | 0 | 13248 | 2 |
| D | 0 | 13720 | 2 |
| Mode M9 | |||
|---|---|---|---|
| Quadrant | BADHDUFLAG | Total packets | Discarded packets |
| A | 0 | 12 | 0 |
| B | 0 | 12 | 0 |
| C | 0 | 12 | 0 |
| D | 0 | 12 | 0 |
| Quadrant | Total seconds | Saturated seconds | Saturation percentage |
|---|---|---|---|
| A | 6436 | 21 | 0.326290% |
| B | 6436 | 48 | 0.745805% |
| C | 6436 | 8 | 0.124301% |
| D | 6437 | 28 | 0.434985% |
Noise dominated data is calculated using 1-second bins in cleaned event files. If a bin has >2000 counts, and if more than 50% of those come from <1% of pixels, then it is considered to be noise-dominated and hence unusable.
| Quadrant | # 1 sec bins | Bins with >0 counts | Bins with >2000 counts | High rate bins dominated by noise | Noise dominated (total time) | Noise dominated (detector-on time) | Marked lightcurve |
|---|---|---|---|---|---|---|---|
| A | 7581 | 6437 | 0 | 0 | 0.00% | 0.00% | 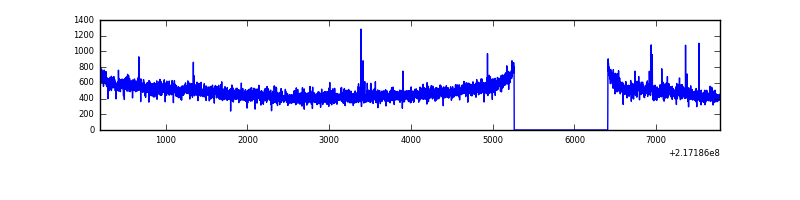 |
| B | 7581 | 6437 | 11 | 11 | 0.15% | 0.17% | 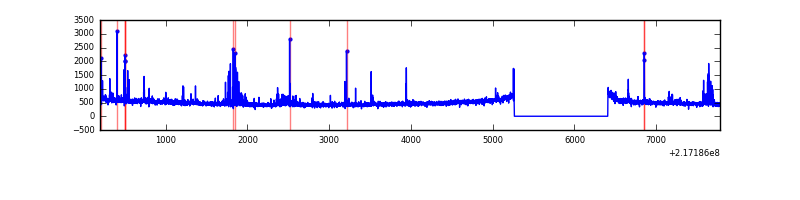 |
| C | 7581 | 6437 | 0 | 0 | 0.00% | 0.00% |  |
| D | 7582 | 6438 | 9 | 9 | 0.12% | 0.14% | 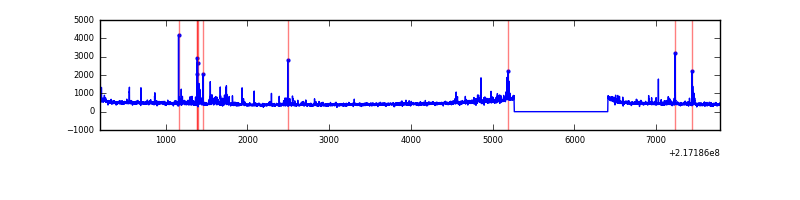 |
Top three noisy pixels from each quadrant. If the there are fewer than three noisy pixels in the level2.evt file, extra rows are filled as -1
| Pixel properties | Quadrant properties | ||||||
|---|---|---|---|---|---|---|---|
| Quadrant | DetID | PixID | Counts | Sigma | Mean | Median | Sigma |
| A | 15 | 234 | 91084 | 568.96 | 775 | 759 | 158.8 |
| A | 8 | 15 | 49365 | 306.17 | 775 | 759 | 158.8 |
| A | 0 | 226 | 7486 | 42.37 | 775 | 759 | 158.8 |
| B | 3 | 64 | 143432 | 954.94 | 784 | 766 | 149.4 |
| B | 4 | 80 | 31261 | 204.12 | 784 | 766 | 149.4 |
| B | 0 | 219 | 20001 | 128.75 | 784 | 766 | 149.4 |
| C | 1 | 16 | 12822 | 69.83 | 744 | 748 | 172.9 |
| C | 9 | 16 | 5995 | 30.35 | 744 | 748 | 172.9 |
| C | 13 | 61 | 5871 | 29.63 | 744 | 748 | 172.9 |
| D | 2 | 136 | 175297 | 968.98 | 739 | 718 | 180.2 |
| D | 8 | 195 | 24419 | 131.55 | 739 | 718 | 180.2 |
| D | 2 | 14 | 21956 | 117.88 | 739 | 718 | 180.2 |
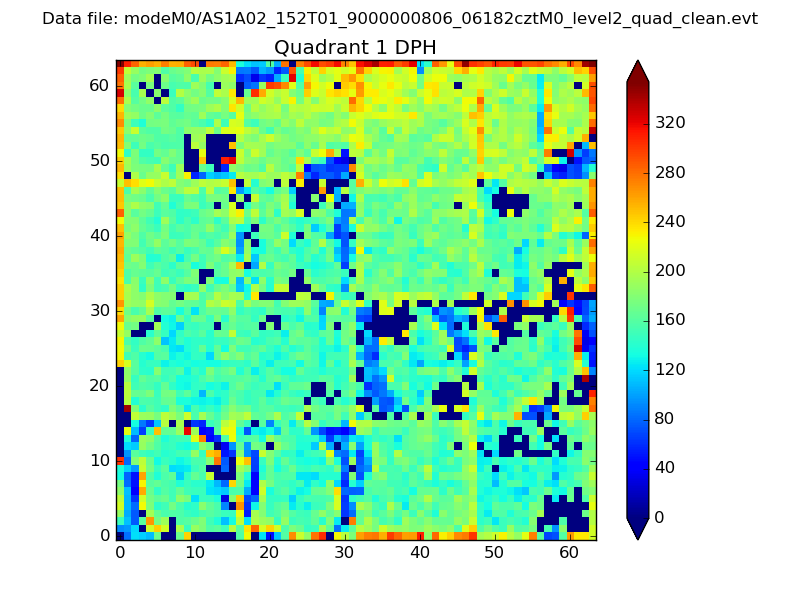
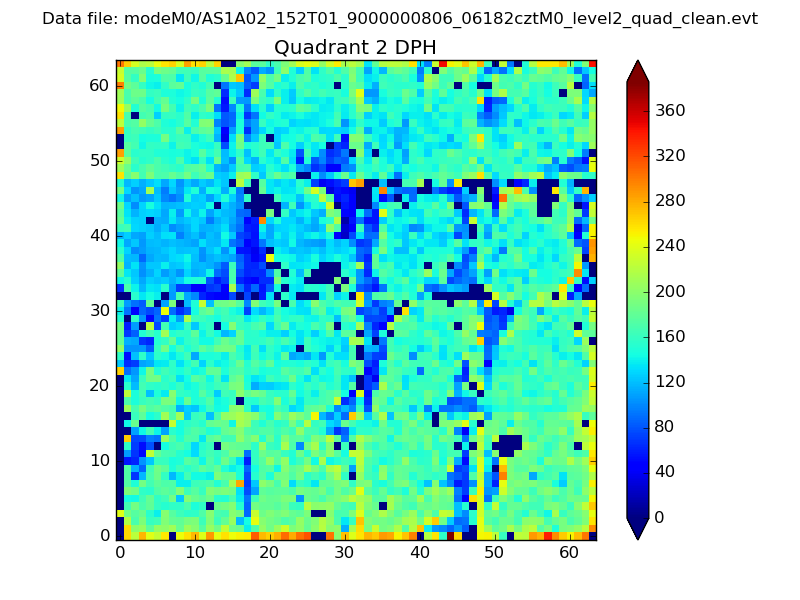
Histogram calculated using DETX and DETY for each event in the final _common_clean file
| Quadrant A | 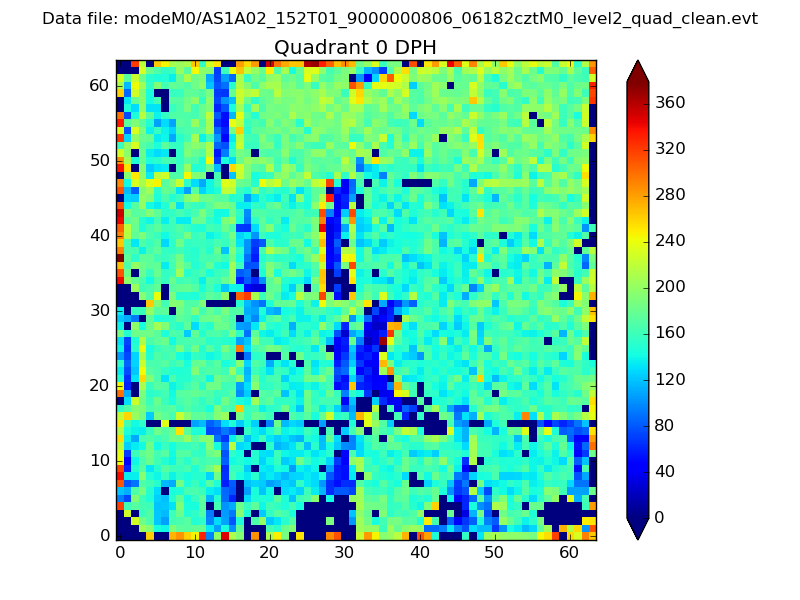 |
 |
Quadrant B |
|---|---|---|---|
| Quadrant D | 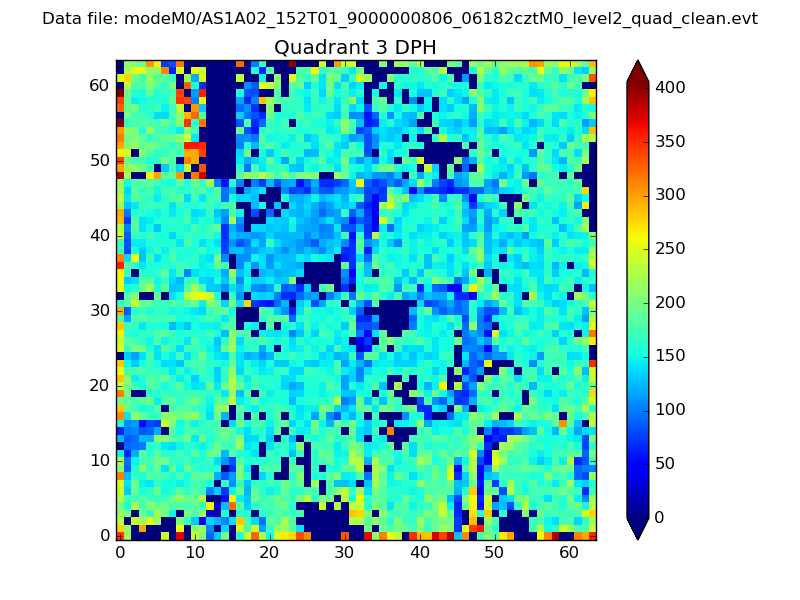 |
 |
Quadrant C |
| Plot type | Count rate plots | Images |
|---|---|---|
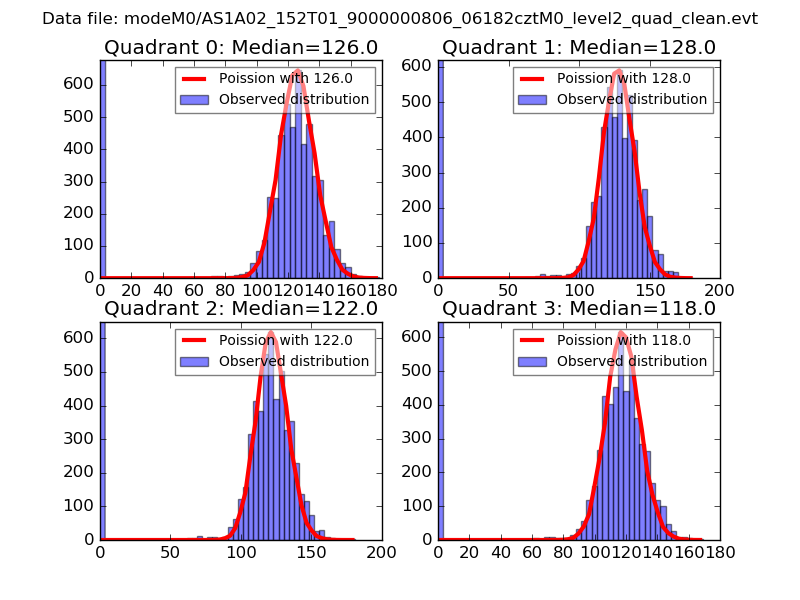
| Comparison with Poisson distribution Blue bars denote a histogram of data divided into 1 sec bins. Red curve is a Poisson curve with rate = median count rate of data. |
 |
 |
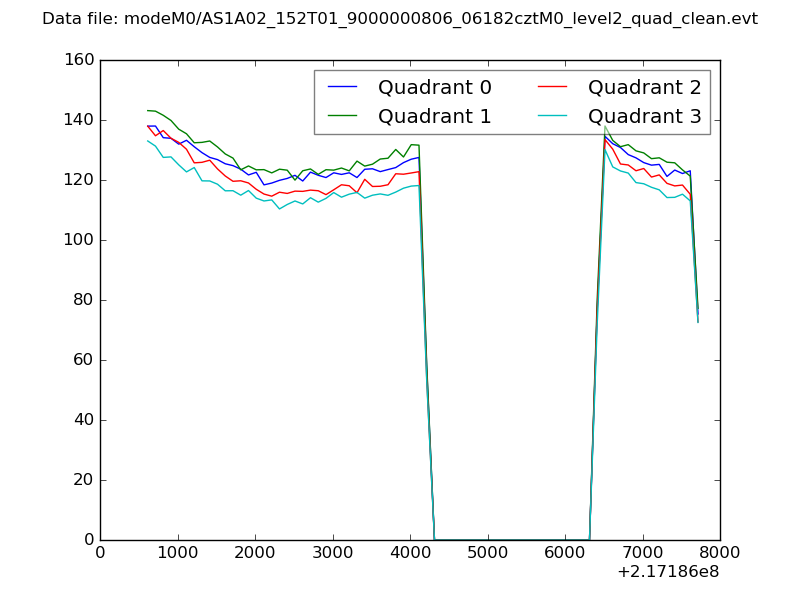
| Quadrant-wise count rates Data is divided into 100 sec bins |
 |
|
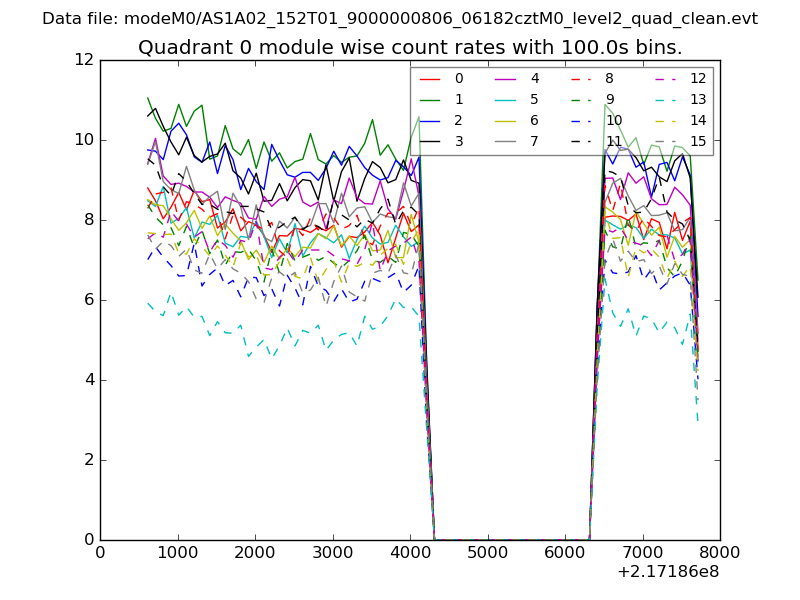
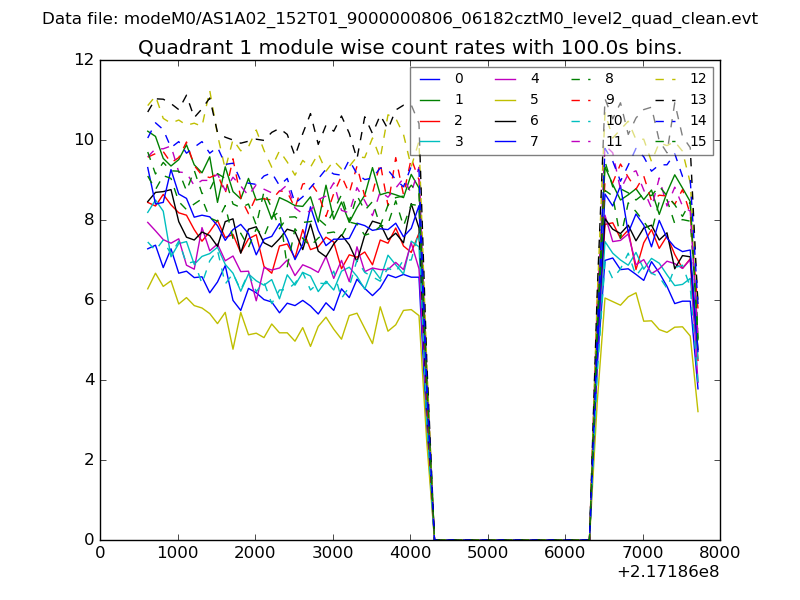
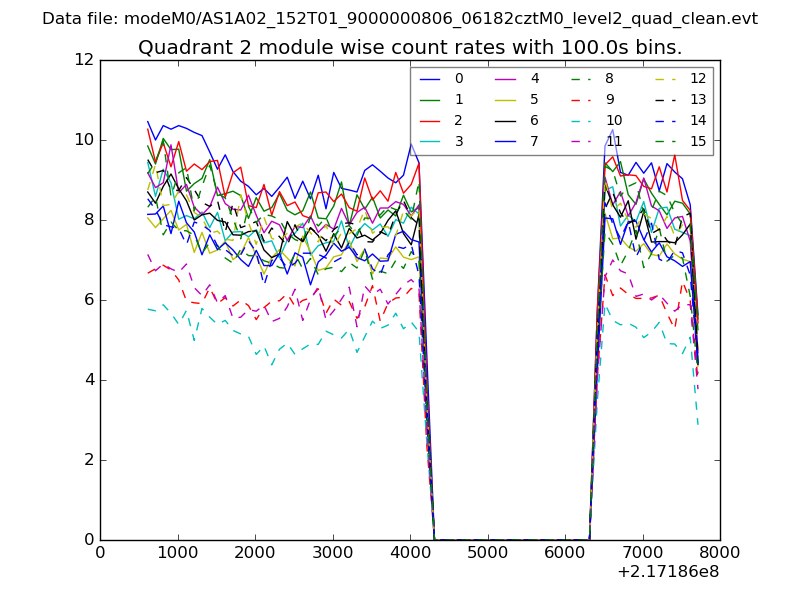
| Module-wise count rates for Quadrant A Data is divided into 100 sec bins |
 |
 |
| Module-wise count rates for Quadrant B Data is divided into 100 sec bins |
 |
 |
| Module-wise count rates for Quadrant C Data is divided into 100 sec bins |
 |
 |
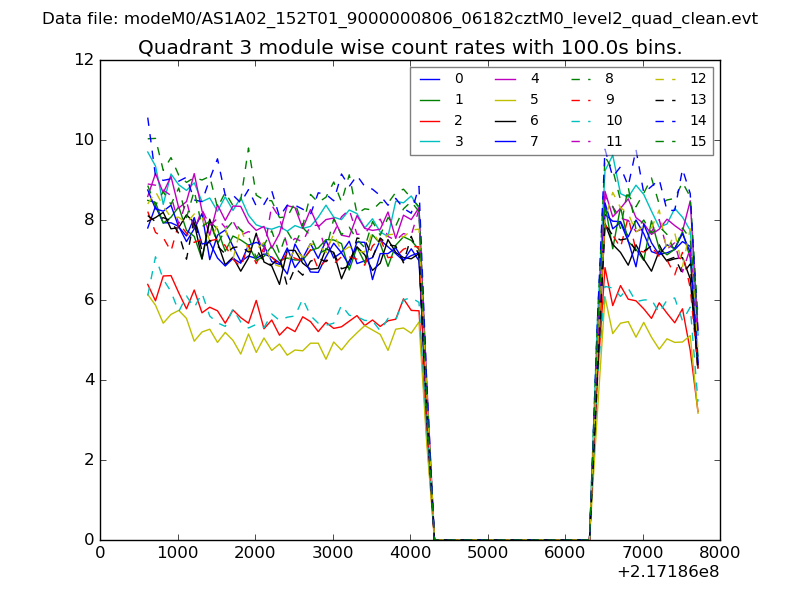
| Module-wise count rates for Quadrant D Data is divided into 100 sec bins |
 |
 |
| Parameter | Plot |
|---|---|
| CZT HV Monitor | 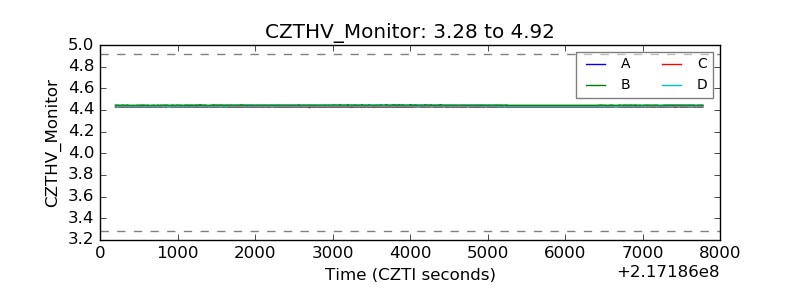 |
| D_VDD | 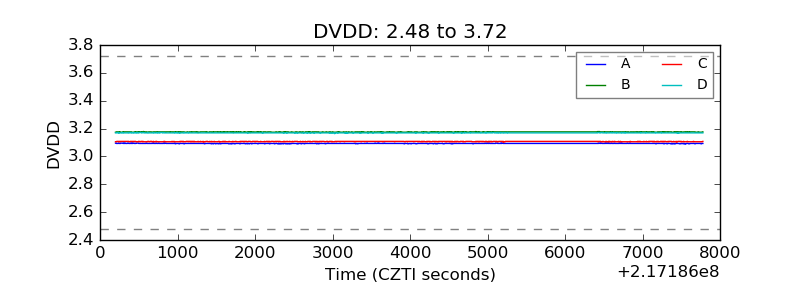 |
| Temperature 1 | 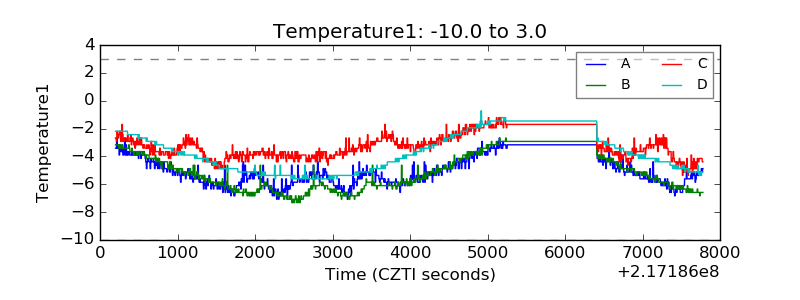 |
| Veto HV Monitor |  |
| Veto LLD |  |
| Alpha Counter | 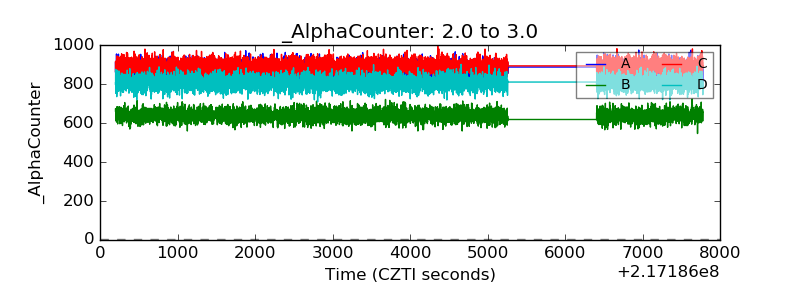 |
| _CPM_Rate | 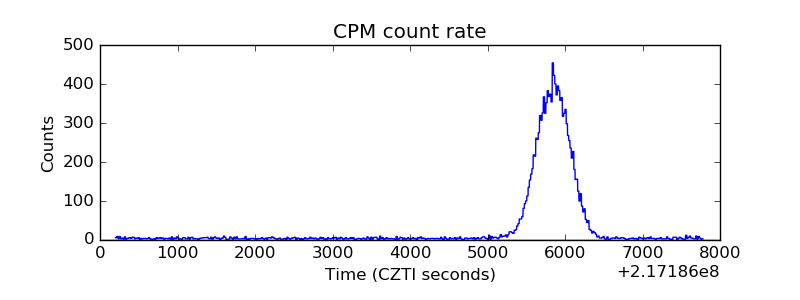 |
| CZT Counter | 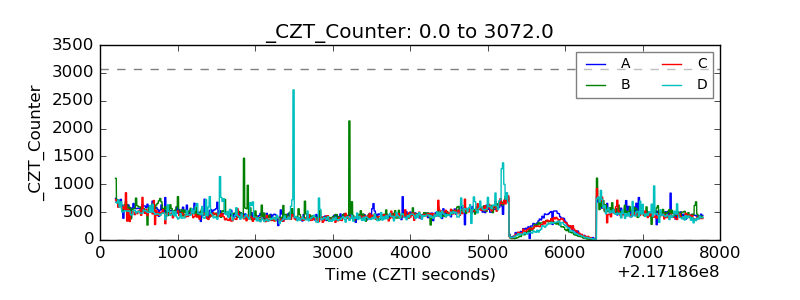 |
| +2.5 Volts monitor | 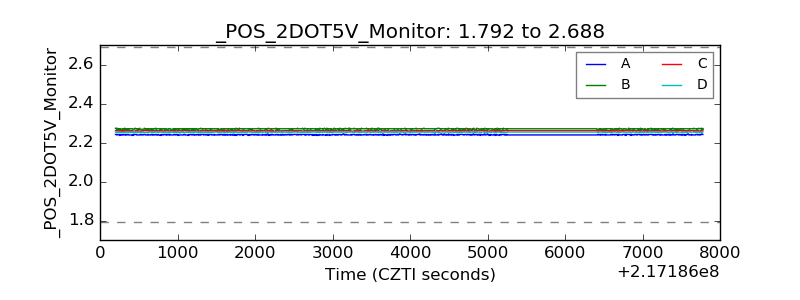 |
| +5 Volts monitor |  |
| _ROLL_ROT | 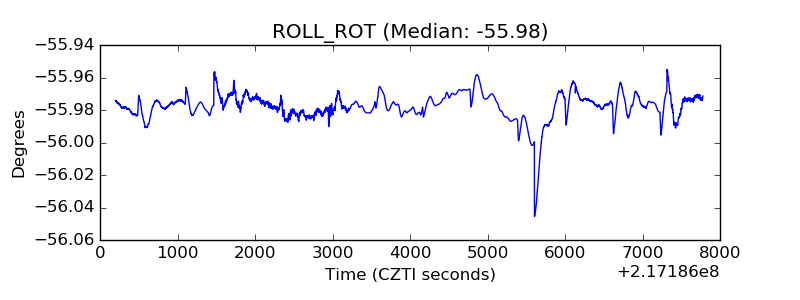 |
| _Roll_DEC | 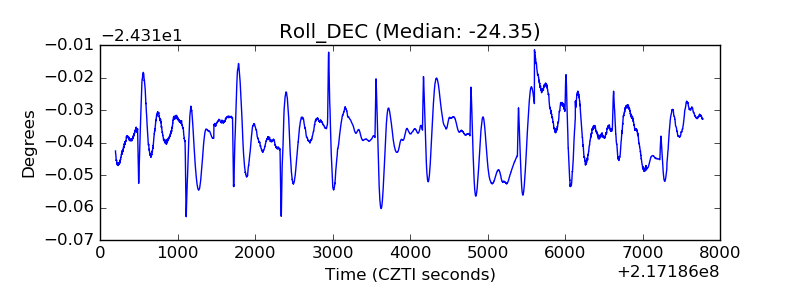 |
| _Roll_RA | 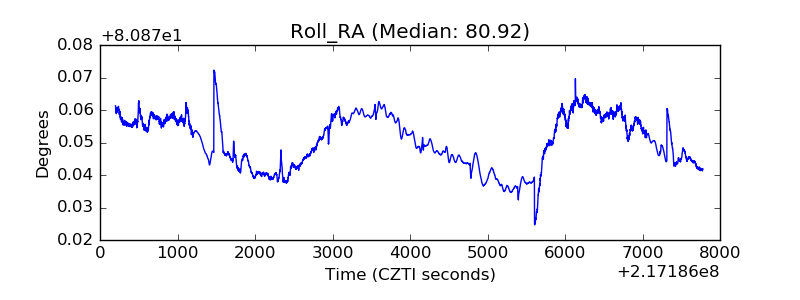 |
| Veto Counter | 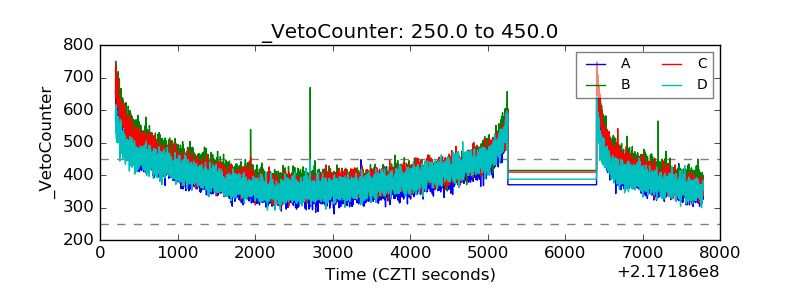 |