| Param | Original file | Final file |
|---|---|---|
| Filename | modeM0/AS1A02_152T01_9000000806_06184cztM0_level2.evt | modeM0/AS1A02_152T01_9000000806_06184cztM0_level2_quad_clean.evt |
| Size (bytes) | 403,577,280 | 84,067,200 |
| Size | 384.9 MB | 80.2 MB |
| Events in quadrant A | 2,877,558 | 541,320 |
| Events in quadrant B | 3,249,548 | 537,712 |
| Events in quadrant C | 2,750,569 | 520,713 |
| Events in quadrant D | 2,916,591 | 508,402 |
| Mode SS | |||
|---|---|---|---|
| Quadrant | BADHDUFLAG | Total packets | Discarded packets |
| A | 0 | 154 | 14 |
| B | 0 | 154 | 22 |
| C | 0 | 154 | 32 |
| D | 0 | 154 | 36 |
| Mode M0 | |||
|---|---|---|---|
| Quadrant | BADHDUFLAG | Total packets | Discarded packets |
| A | 0 | 15661 | 2682 |
| B | 0 | 17224 | 3364 |
| C | 0 | 15458 | 2717 |
| D | 0 | 16463 | 3099 |
| Mode M9 | |||
|---|---|---|---|
| Quadrant | BADHDUFLAG | Total packets | Discarded packets |
| A | 0 | 9 | 0 |
| B | 0 | 9 | 1 |
| C | 0 | 9 | 1 |
| D | 0 | 10 | 0 |
| Quadrant | Total seconds | Saturated seconds | Saturation percentage |
|---|---|---|---|
| A | 6292 | 19 | 0.301971% |
| B | 6181 | 84 | 1.359003% |
| C | 6253 | 4 | 0.063969% |
| D | 6273 | 26 | 0.414475% |
Noise dominated data is calculated using 1-second bins in cleaned event files. If a bin has >2000 counts, and if more than 50% of those come from <1% of pixels, then it is considered to be noise-dominated and hence unusable.
| Quadrant | # 1 sec bins | Bins with >0 counts | Bins with >2000 counts | High rate bins dominated by noise | Noise dominated (total time) | Noise dominated (detector-on time) | Marked lightcurve |
|---|---|---|---|---|---|---|---|
| A | 7947 | 7259 | 0 | 0 | 0.00% | 0.00% | 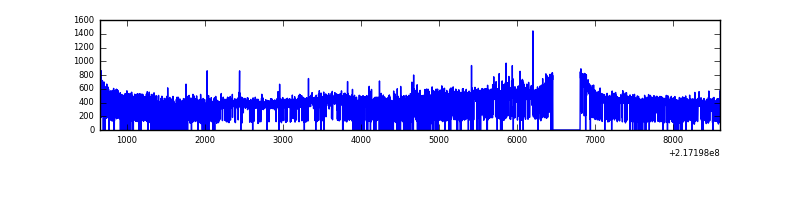 |
| B | 7948 | 7158 | 47 | 47 | 0.59% | 0.66% | 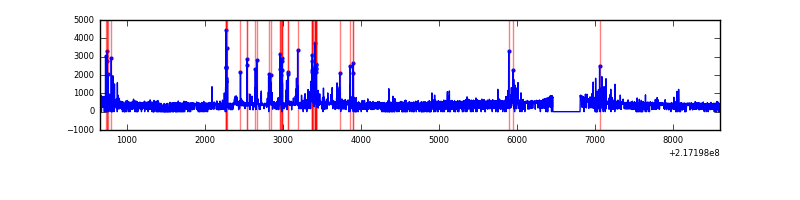 |
| C | 7948 | 7223 | 0 | 0 | 0.00% | 0.00% | 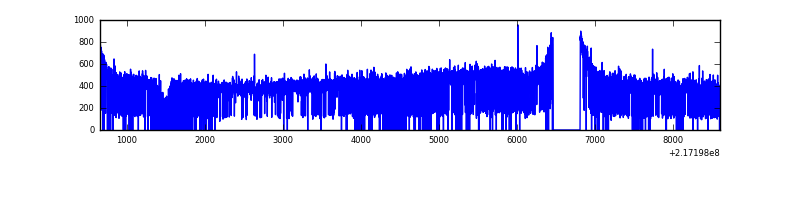 |
| D | 7948 | 7199 | 17 | 17 | 0.21% | 0.24% | 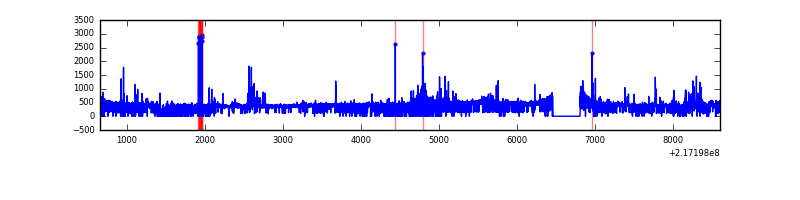 |
Top three noisy pixels from each quadrant. If the there are fewer than three noisy pixels in the level2.evt file, extra rows are filled as -1
| Pixel properties | Quadrant properties | ||||||
|---|---|---|---|---|---|---|---|
| Quadrant | DetID | PixID | Counts | Sigma | Mean | Median | Sigma |
| A | 8 | 15 | 51180 | 332.48 | 729 | 712 | 151.8 |
| A | 0 | 254 | 16515 | 104.11 | 729 | 712 | 151.8 |
| A | 0 | 226 | 6958 | 41.15 | 729 | 712 | 151.8 |
| B | 3 | 64 | 385994 | 2775.79 | 719 | 703 | 138.8 |
| B | 4 | 80 | 33147 | 233.74 | 719 | 703 | 138.8 |
| B | 15 | 204 | 25398 | 177.91 | 719 | 703 | 138.8 |
| C | 1 | 16 | 16326 | 94.82 | 699 | 702 | 164.8 |
| C | 13 | 61 | 5639 | 29.96 | 699 | 702 | 164.8 |
| C | 14 | 67 | 2331 | 9.89 | 699 | 702 | 164.8 |
| D | 2 | 136 | 179909 | 1048.2 | 696 | 673 | 171.0 |
| D | 10 | 172 | 42805 | 246.39 | 696 | 673 | 171.0 |
| D | 5 | 97 | 30693 | 175.56 | 696 | 673 | 171.0 |
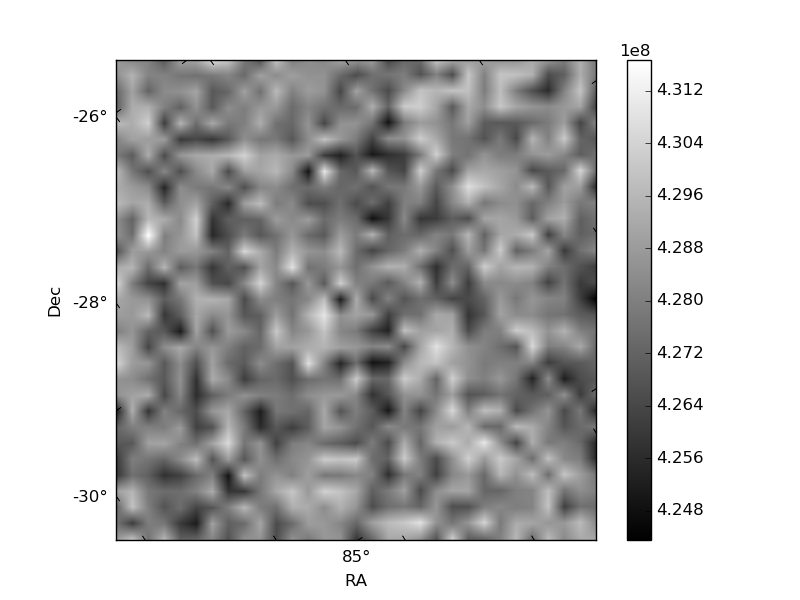
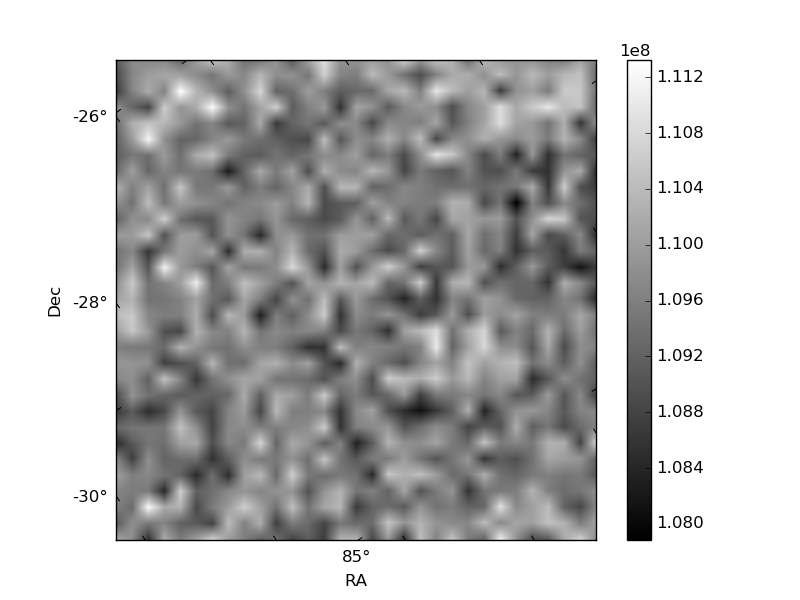
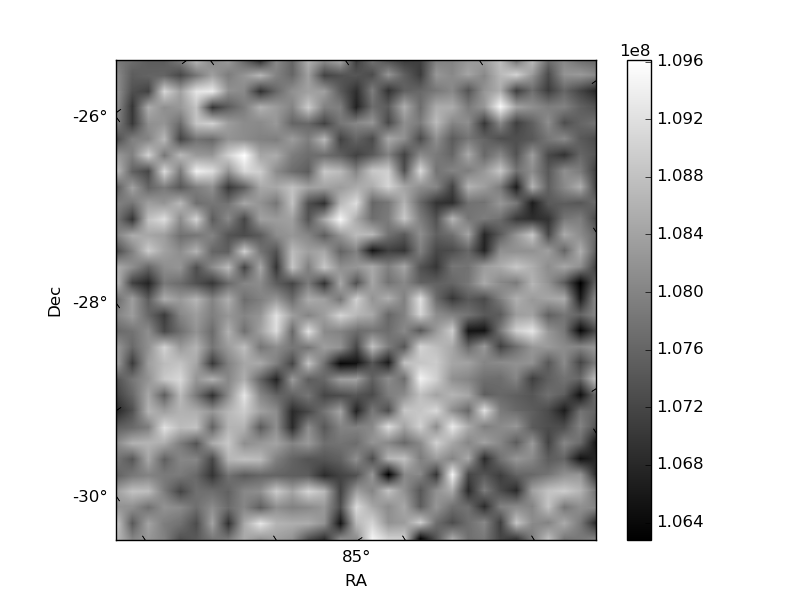
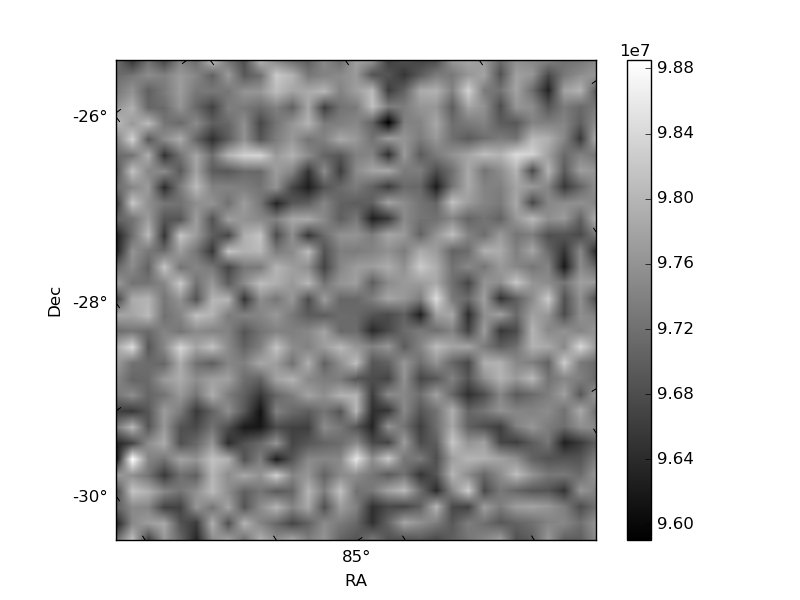
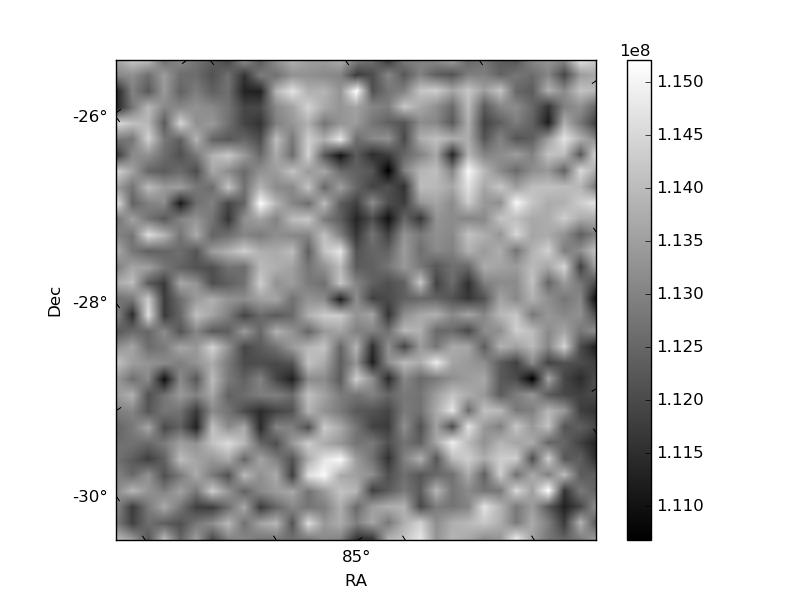
Histogram calculated using DETX and DETY for each event in the final _common_clean file
| Quadrant A | 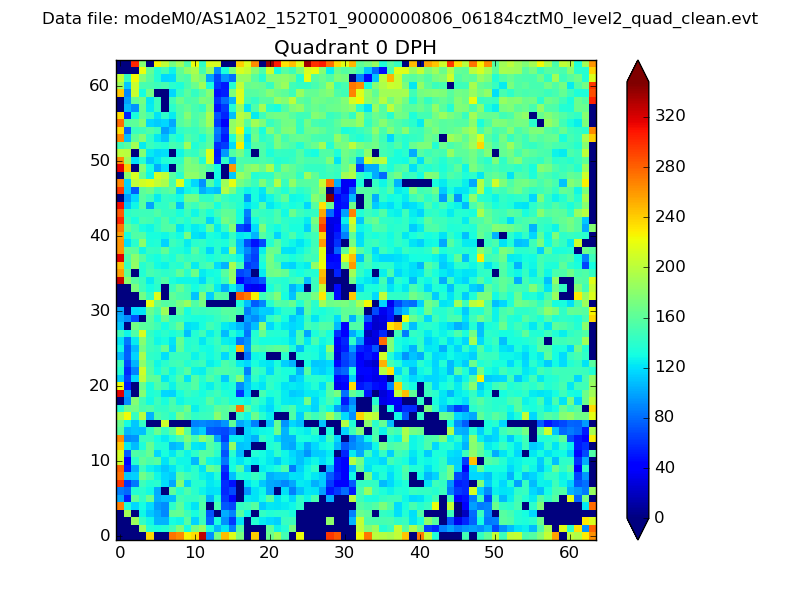 |
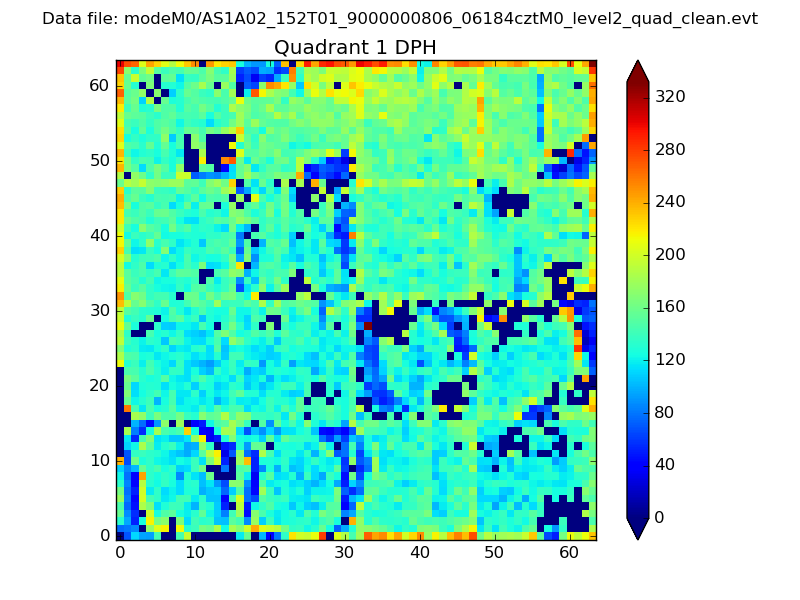 |
Quadrant B |
|---|---|---|---|
| Quadrant D | 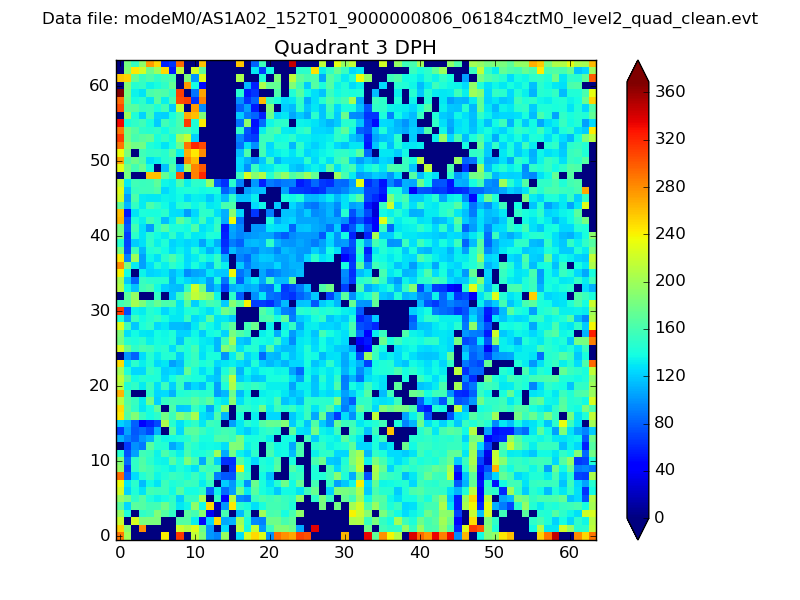 |
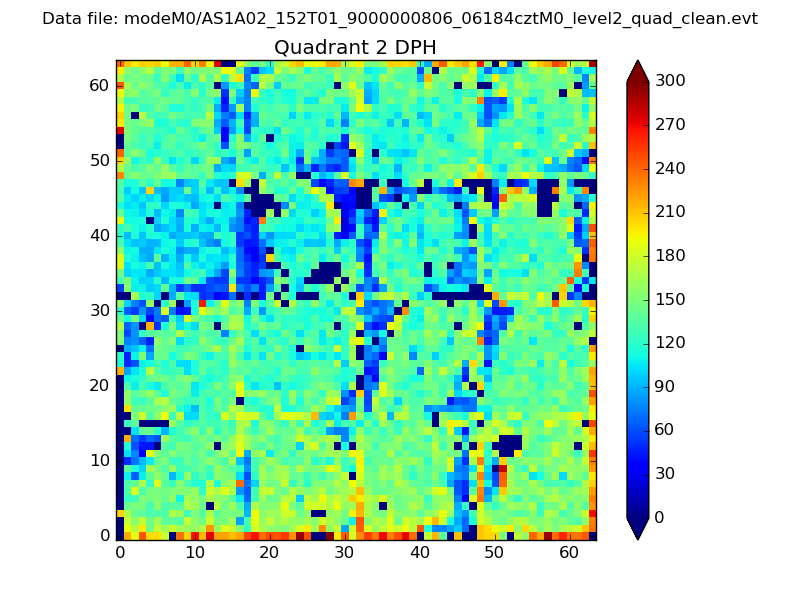 |
Quadrant C |
| Plot type | Count rate plots | Images |
|---|---|---|
| Comparison with Poisson distribution Blue bars denote a histogram of data divided into 1 sec bins. Red curve is a Poisson curve with rate = median count rate of data. |
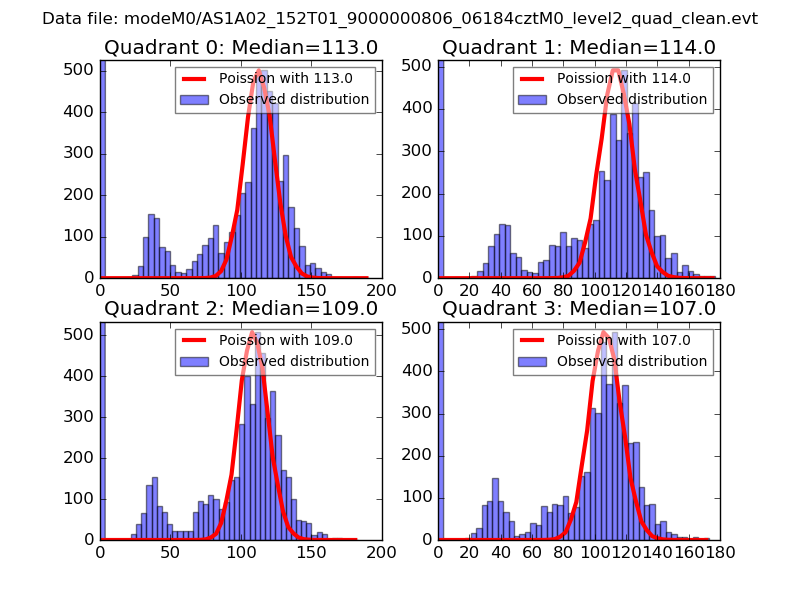 |
 |
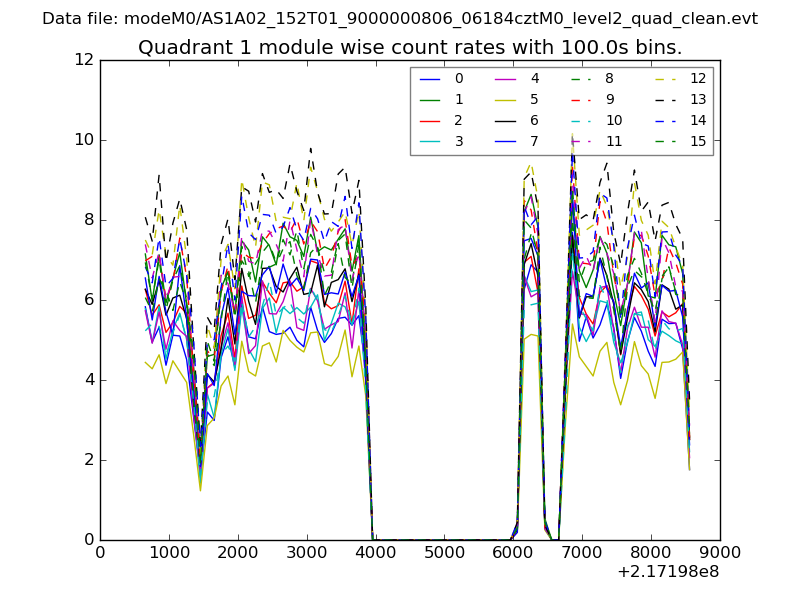
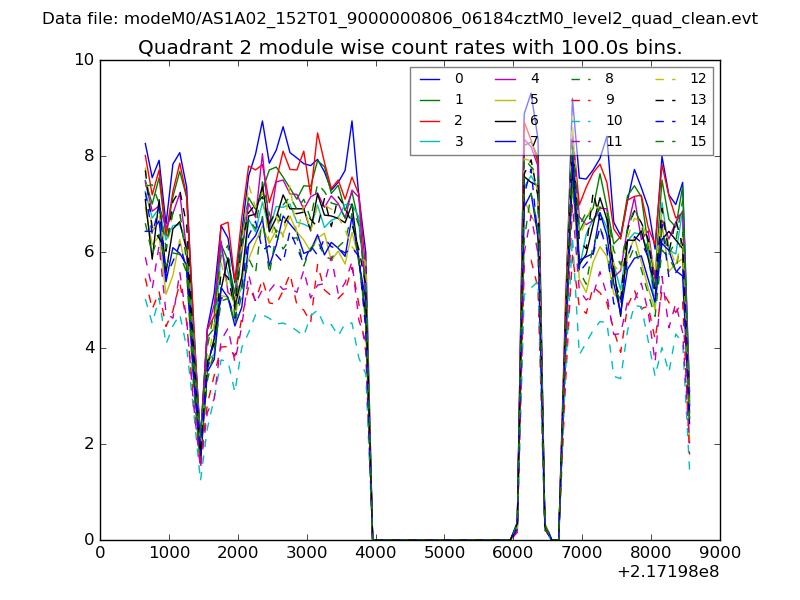
| Quadrant-wise count rates Data is divided into 100 sec bins |
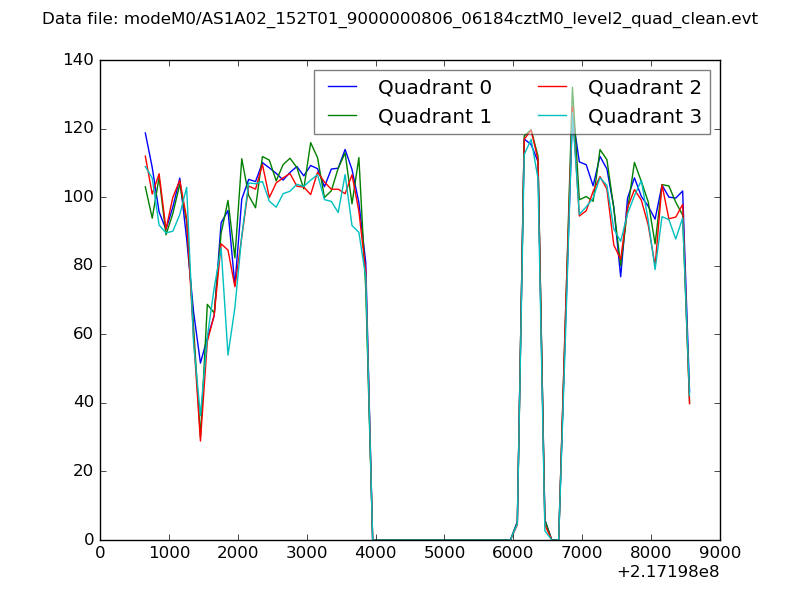 |
|
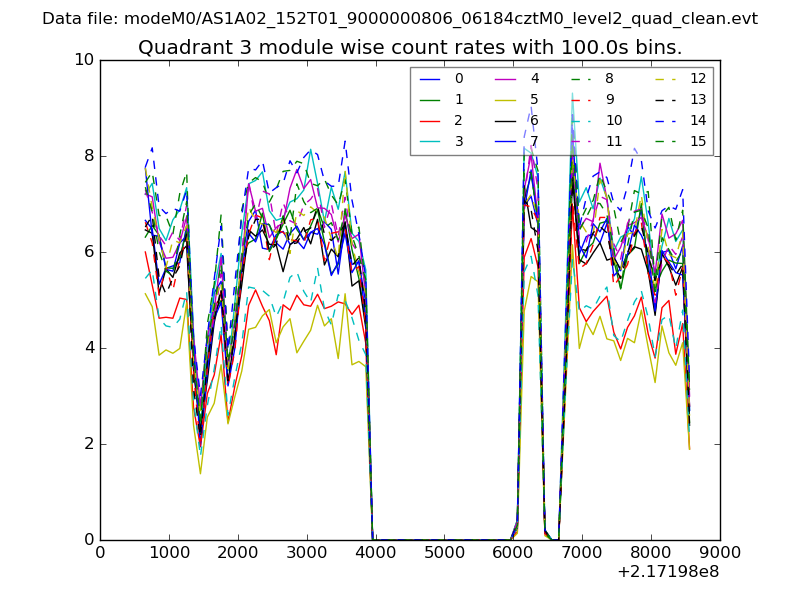
| Module-wise count rates for Quadrant A Data is divided into 100 sec bins |
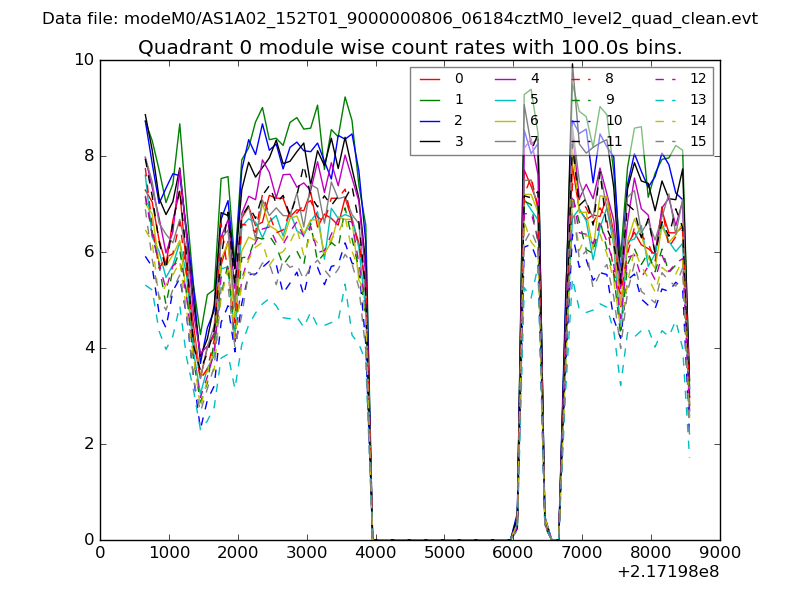 |
 |
| Module-wise count rates for Quadrant B Data is divided into 100 sec bins |
 |
 |
| Module-wise count rates for Quadrant C Data is divided into 100 sec bins |
 |
 |
| Module-wise count rates for Quadrant D Data is divided into 100 sec bins |
 |
 |
| Parameter | Plot |
|---|---|
| CZT HV Monitor | 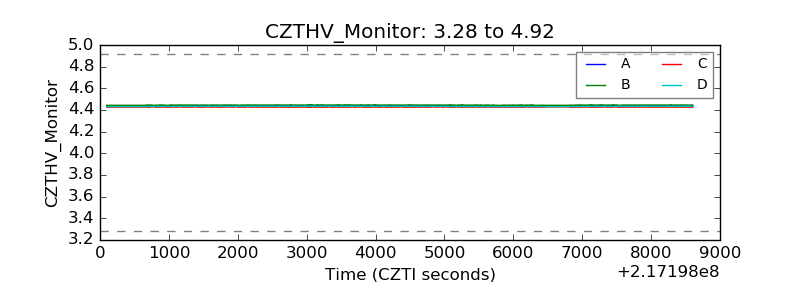 |
| D_VDD | 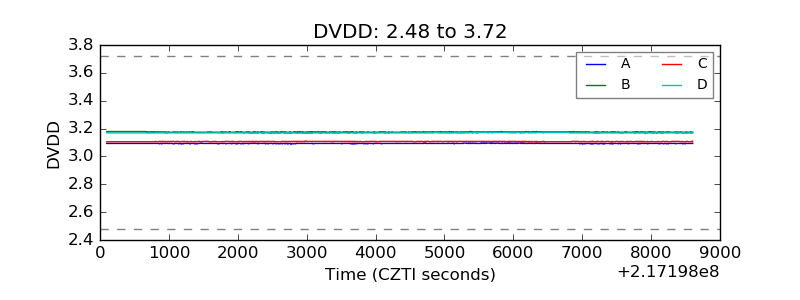 |
| Temperature 1 | 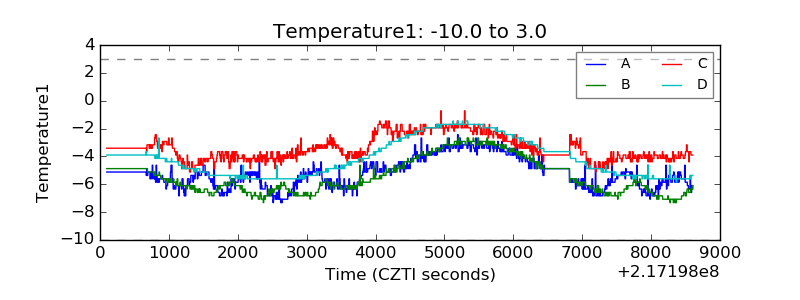 |
| Veto HV Monitor | 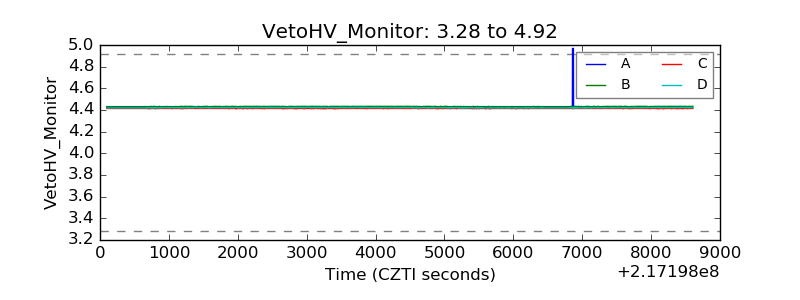 |
| Veto LLD | 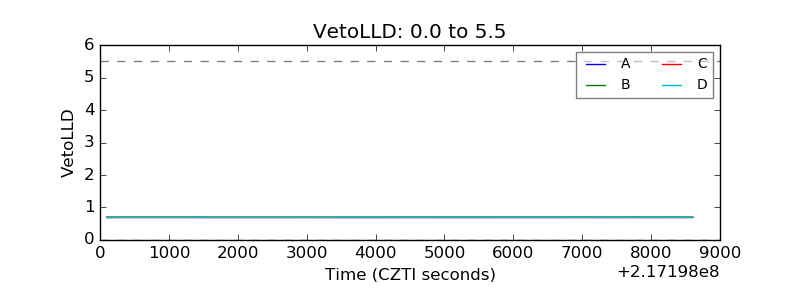 |
| Alpha Counter | 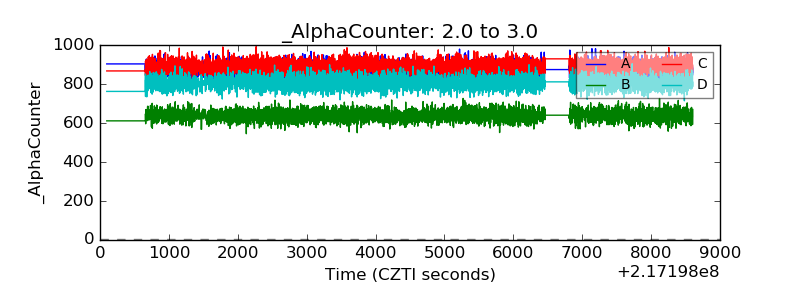 |
| _CPM_Rate | 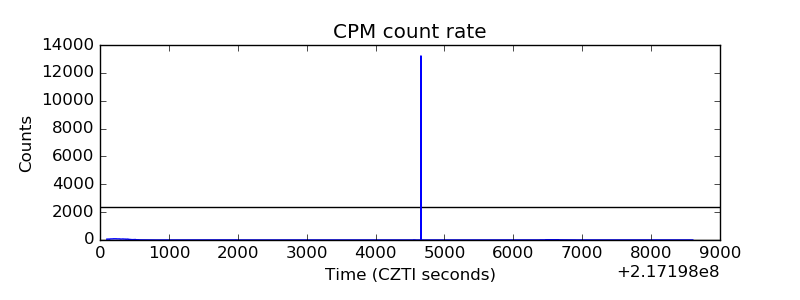 |
| CZT Counter | 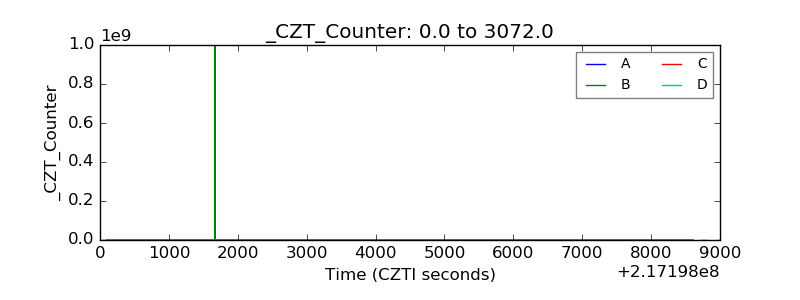 |
| +2.5 Volts monitor | 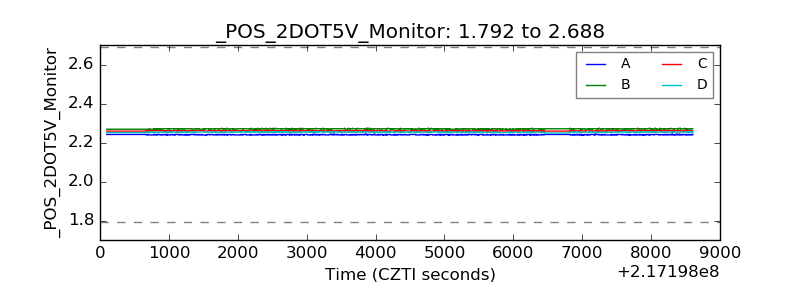 |
| +5 Volts monitor | 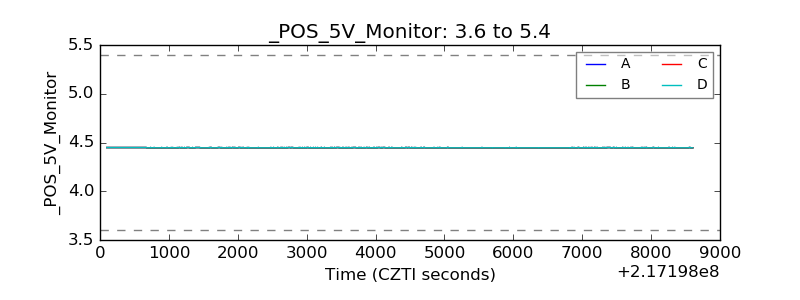 |
| _ROLL_ROT | 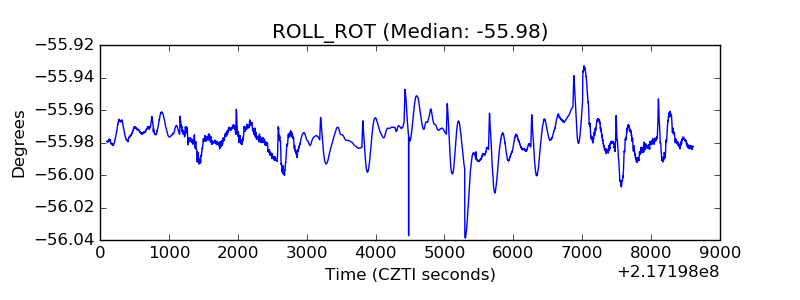 |
| _Roll_DEC | 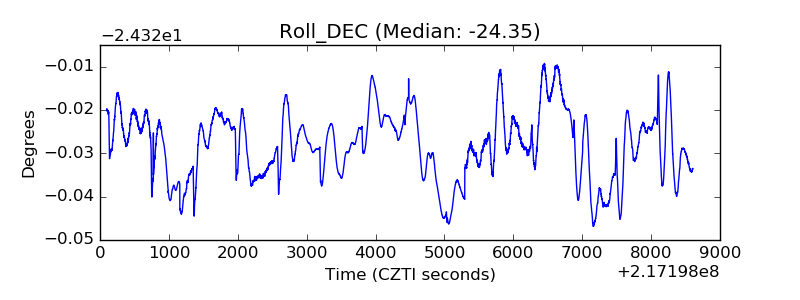 |
| _Roll_RA | 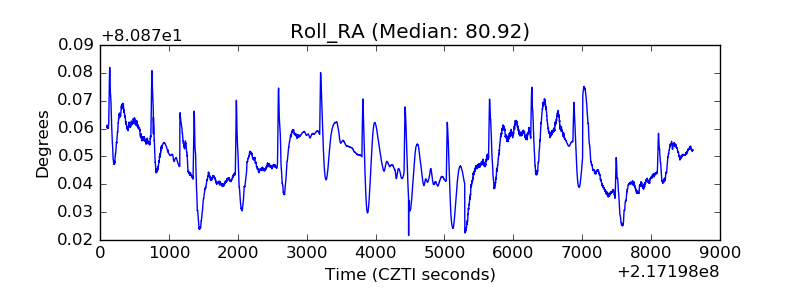 |
| Veto Counter | 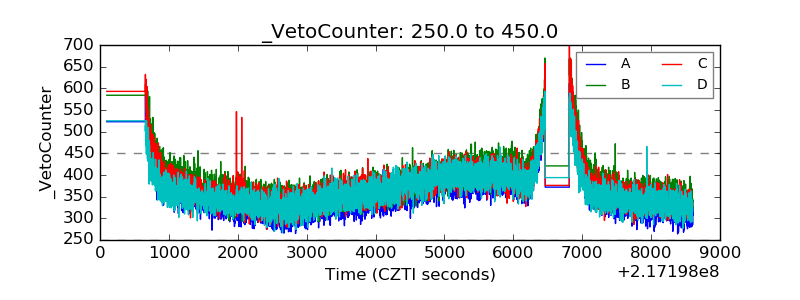 |