| Param | Original file | Final file |
|---|---|---|
| Filename | modeM0/AS1A02_152T01_9000000806_06186cztM0_level2.evt | modeM0/AS1A02_152T01_9000000806_06186cztM0_level2_quad_clean.evt |
| Size (bytes) | 121,835,520 | 32,443,200 |
| Size | 116.2 MB | 30.9 MB |
| Events in quadrant A | 876,480 | 207,326 |
| Events in quadrant B | 951,144 | 221,835 |
| Events in quadrant C | 856,982 | 209,738 |
| Events in quadrant D | 867,332 | 198,956 |
| Mode SS | |||
|---|---|---|---|
| Quadrant | BADHDUFLAG | Total packets | Discarded packets |
| A | 0 | 70 | 30 |
| B | 0 | 69 | 27 |
| C | 0 | 70 | 26 |
| D | 0 | 70 | 28 |
| Mode M0 | |||
|---|---|---|---|
| Quadrant | BADHDUFLAG | Total packets | Discarded packets |
| A | 0 | 8228 | 4212 |
| B | 0 | 7498 | 3216 |
| C | 0 | 7097 | 3009 |
| D | 0 | 7267 | 3180 |
| Mode M9 | |||
|---|---|---|---|
| Quadrant | BADHDUFLAG | Total packets | Discarded packets |
| A | 0 | 4 | 2 |
| B | 0 | 4 | 3 |
| C | 0 | 4 | 0 |
| D | 0 | 4 | 2 |
| Quadrant | Total seconds | Saturated seconds | Saturation percentage |
|---|---|---|---|
| A | 1913 | 17 | 0.888657% |
| B | 1993 | 11 | 0.551932% |
| C | 2002 | 1 | 0.049950% |
| D | 1942 | 2 | 0.102987% |
Noise dominated data is calculated using 1-second bins in cleaned event files. If a bin has >2000 counts, and if more than 50% of those come from <1% of pixels, then it is considered to be noise-dominated and hence unusable.
| Quadrant | # 1 sec bins | Bins with >0 counts | Bins with >2000 counts | High rate bins dominated by noise | Noise dominated (total time) | Noise dominated (detector-on time) | Marked lightcurve |
|---|---|---|---|---|---|---|---|
| A | 3607 | 2529 | 11 | 11 | 0.30% | 0.43% | 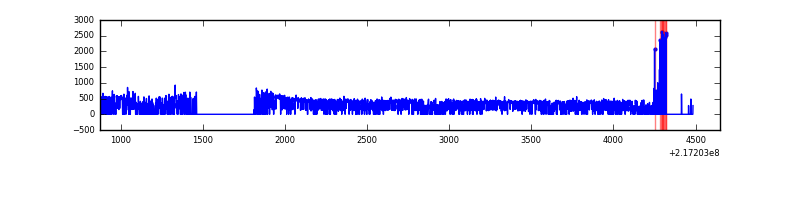 |
| B | 3604 | 2651 | 0 | 0 | 0.00% | 0.00% | 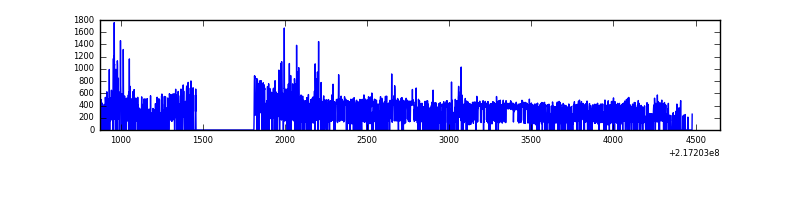 |
| C | 3769 | 2687 | 0 | 0 | 0.00% | 0.00% | 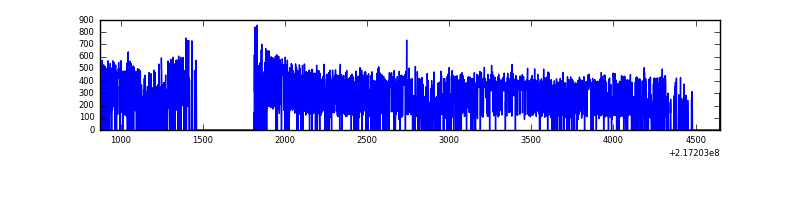 |
| D | 3598 | 2624 | 0 | 0 | 0.00% | 0.00% | 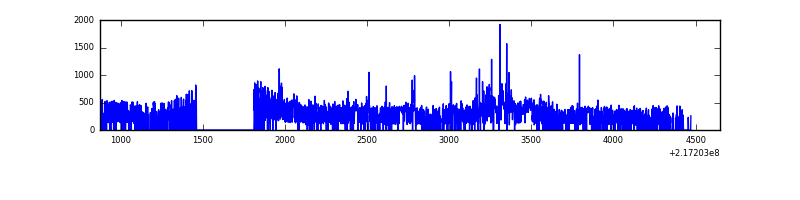 |
Top three noisy pixels from each quadrant. If the there are fewer than three noisy pixels in the level2.evt file, extra rows are filled as -1
| Pixel properties | Quadrant properties | ||||||
|---|---|---|---|---|---|---|---|
| Quadrant | DetID | PixID | Counts | Sigma | Mean | Median | Sigma |
| A | 15 | 236 | 31423 | 672.71 | 216 | 212 | 46.4 |
| A | 8 | 15 | 12325 | 261.08 | 216 | 212 | 46.4 |
| A | 0 | 226 | 2084 | 40.35 | 216 | 212 | 46.4 |
| B | 3 | 64 | 35762 | 766.78 | 230 | 225 | 46.3 |
| B | 4 | 80 | 13176 | 279.44 | 230 | 225 | 46.3 |
| B | 10 | 246 | 6558 | 136.65 | 230 | 225 | 46.3 |
| C | 1 | 16 | 4937 | 88.17 | 218 | 218 | 53.5 |
| C | 13 | 61 | 1759 | 28.79 | 218 | 218 | 53.5 |
| C | 3 | 202 | 640 | 7.88 | 218 | 218 | 53.5 |
| D | 2 | 136 | 59857 | 1112.77 | 210 | 203 | 53.6 |
| D | 2 | 14 | 6687 | 120.95 | 210 | 203 | 53.6 |
| D | 5 | 97 | 5540 | 99.55 | 210 | 203 | 53.6 |
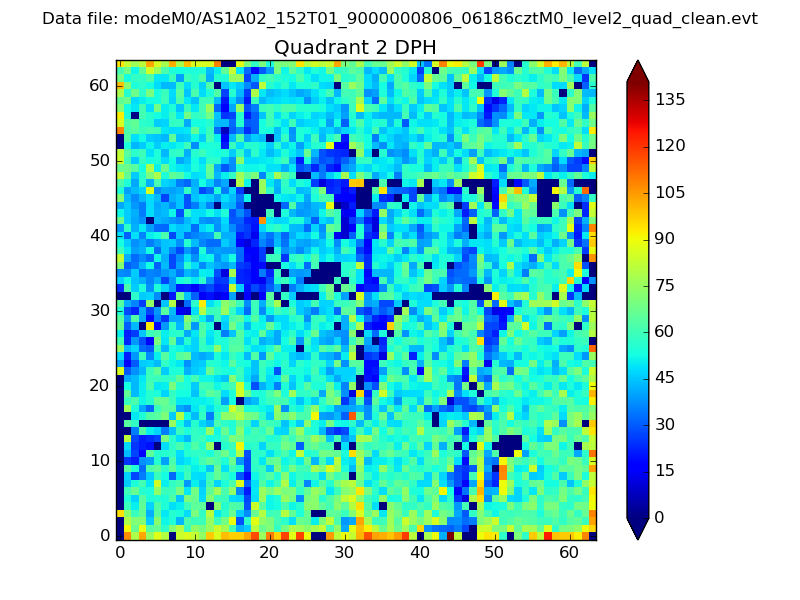
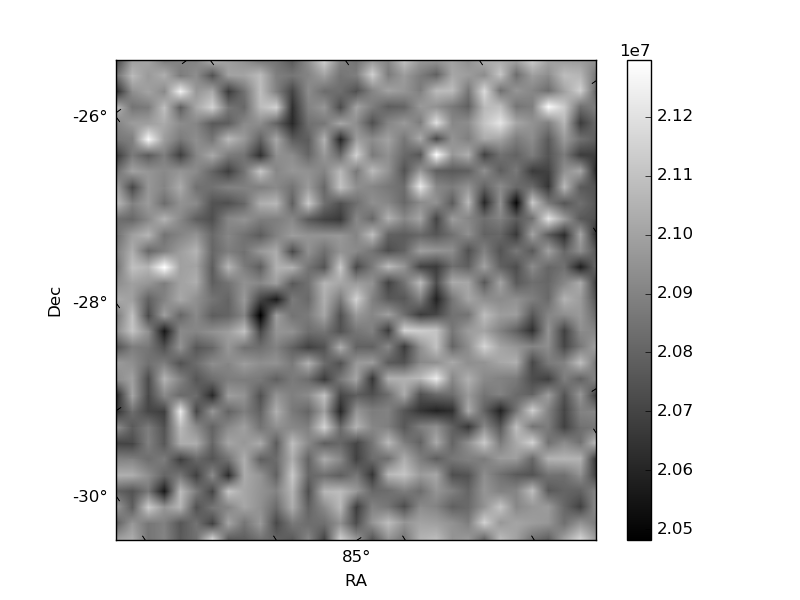
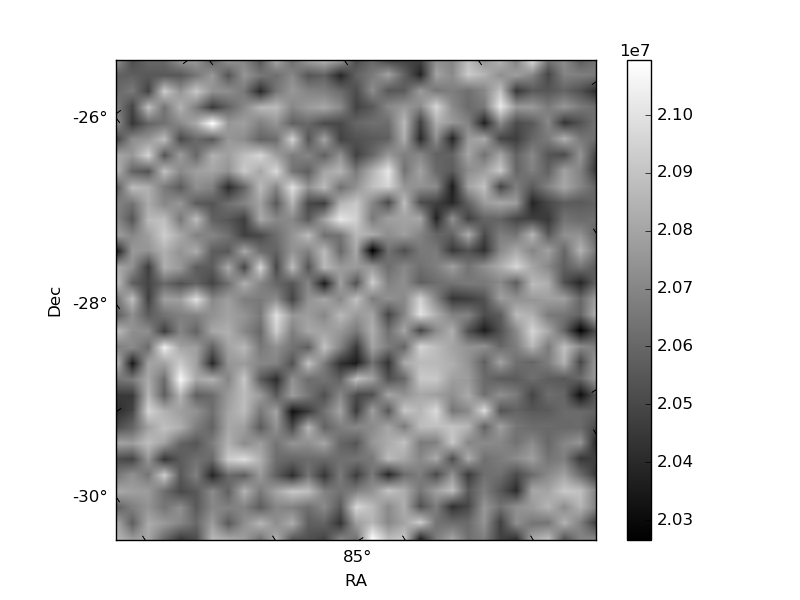
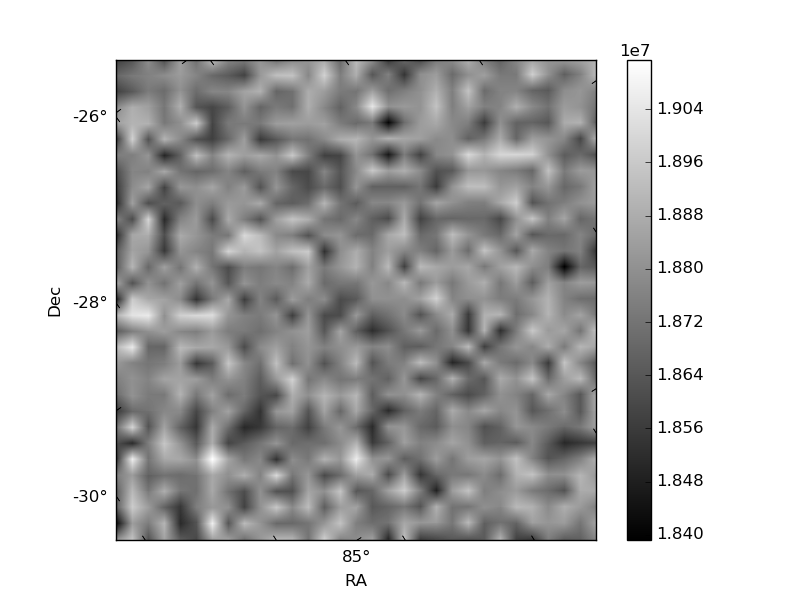
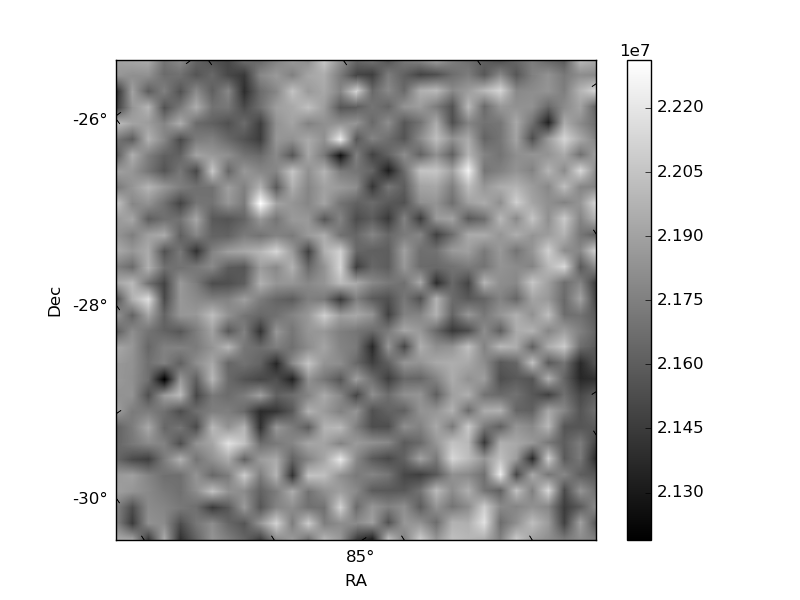
Histogram calculated using DETX and DETY for each event in the final _common_clean file
| Quadrant A | 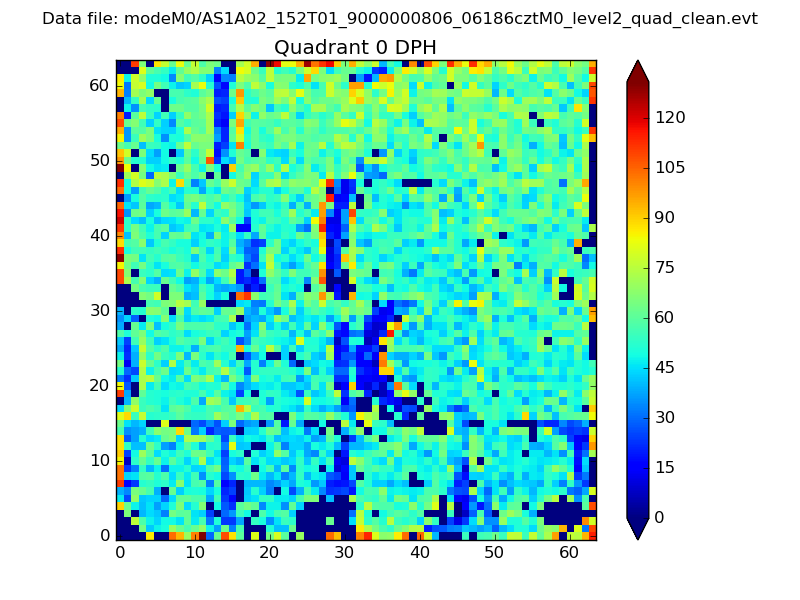 |
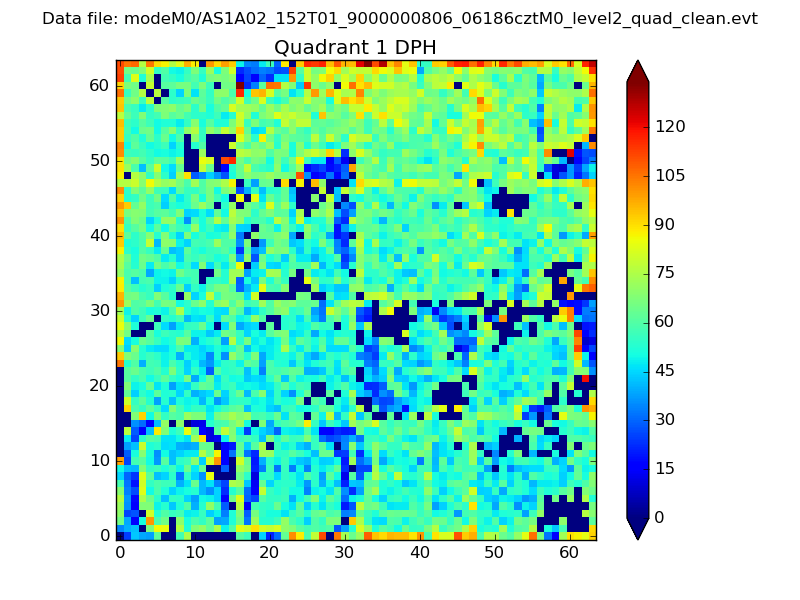 |
Quadrant B |
|---|---|---|---|
| Quadrant D | 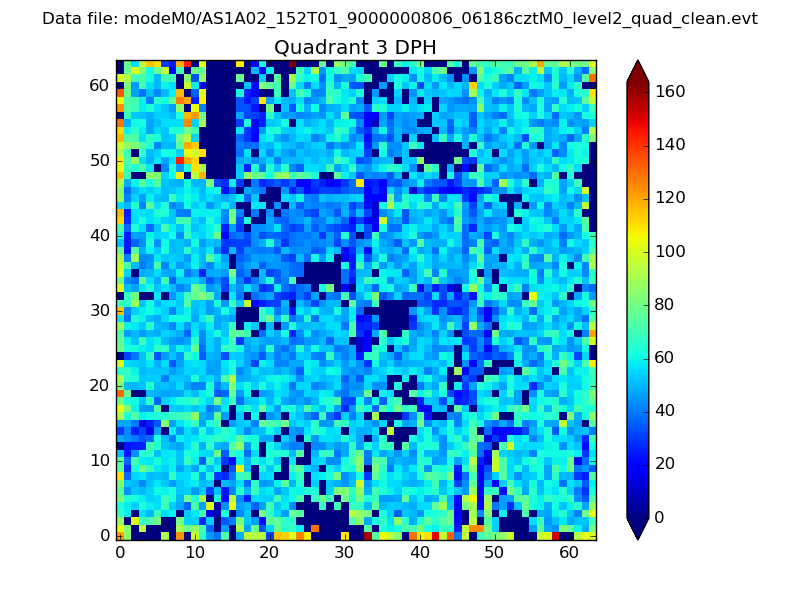 |
 |
Quadrant C |
| Plot type | Count rate plots | Images |
|---|---|---|
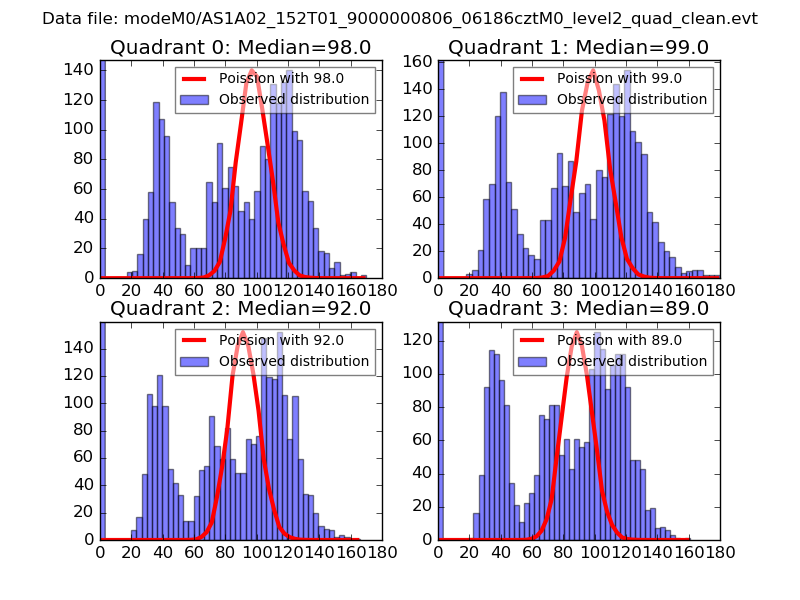
| Comparison with Poisson distribution Blue bars denote a histogram of data divided into 1 sec bins. Red curve is a Poisson curve with rate = median count rate of data. |
 |
 |
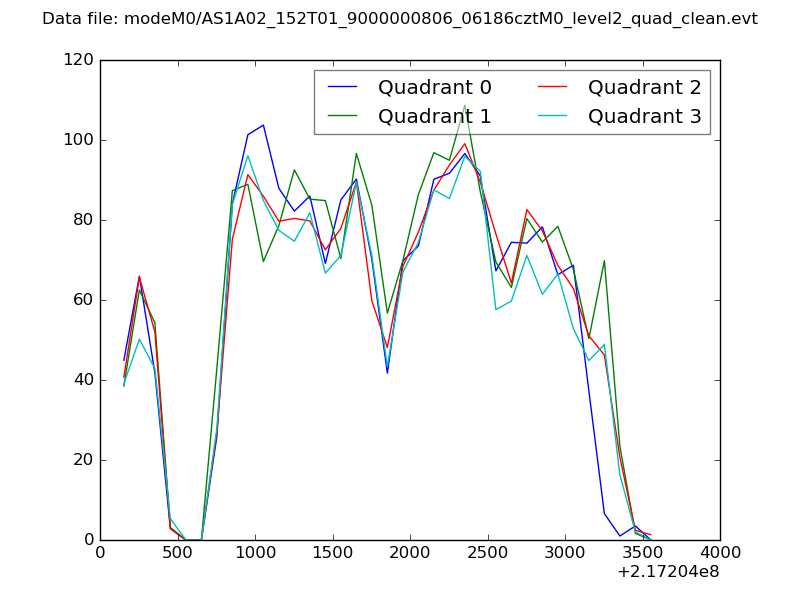
| Quadrant-wise count rates Data is divided into 100 sec bins |
 |
|
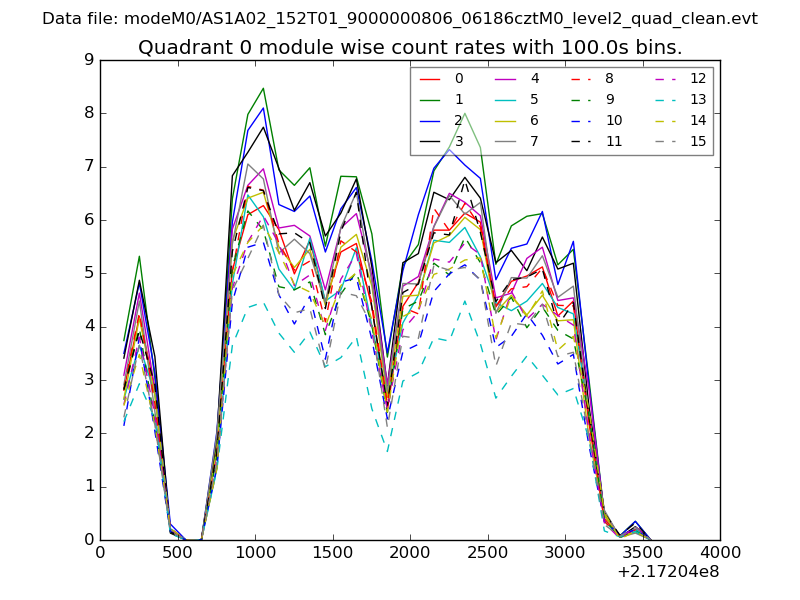
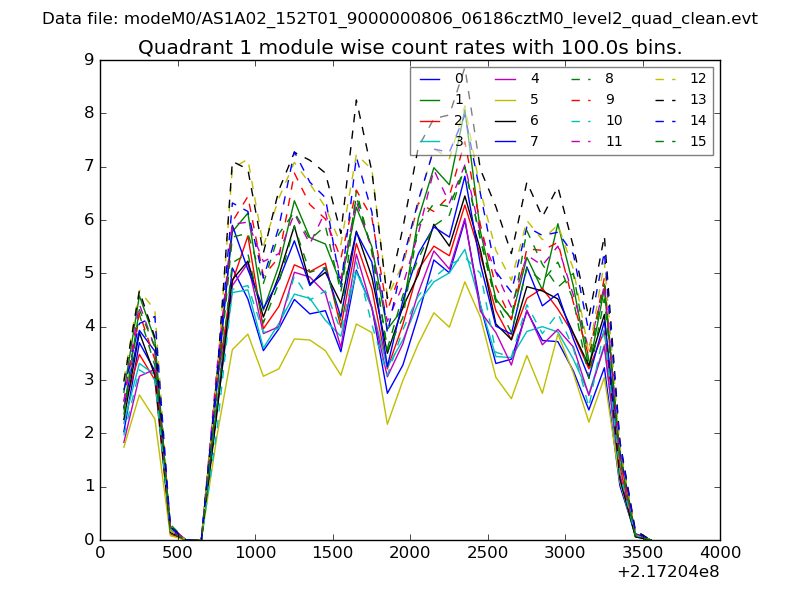
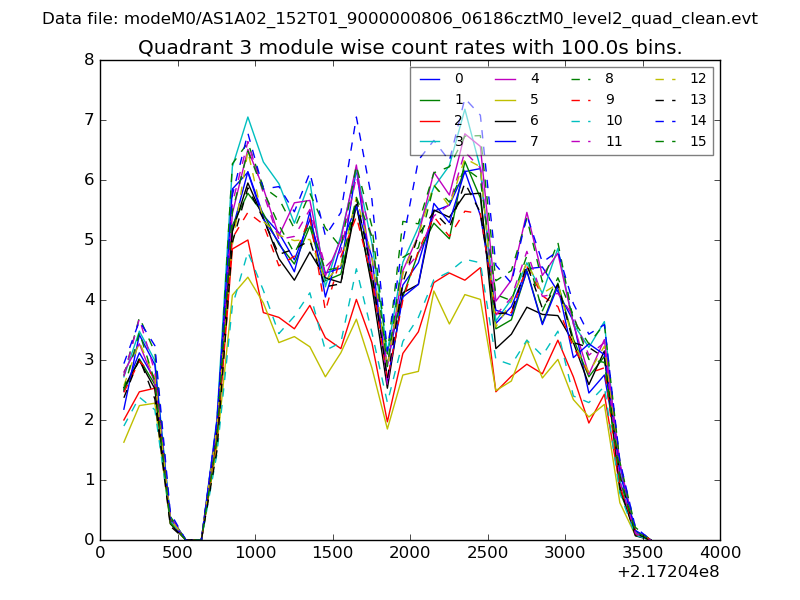
| Module-wise count rates for Quadrant A Data is divided into 100 sec bins |
 |
 |
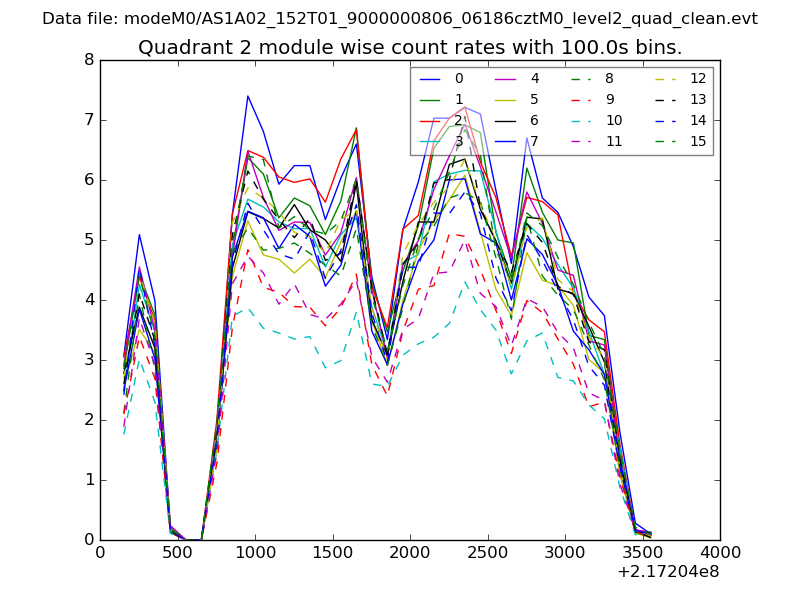
| Module-wise count rates for Quadrant B Data is divided into 100 sec bins |
 |
 |
| Module-wise count rates for Quadrant C Data is divided into 100 sec bins |
 |
 |
| Module-wise count rates for Quadrant D Data is divided into 100 sec bins |
 |
 |
| Parameter | Plot |
|---|---|
| CZT HV Monitor | 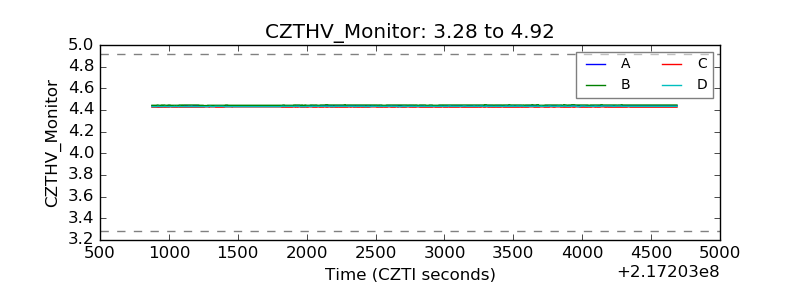 |
| D_VDD | 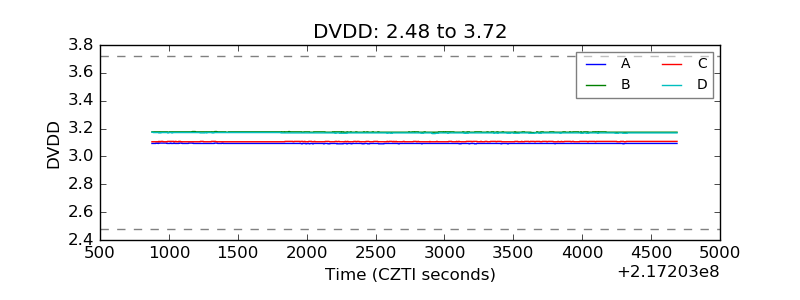 |
| Temperature 1 | 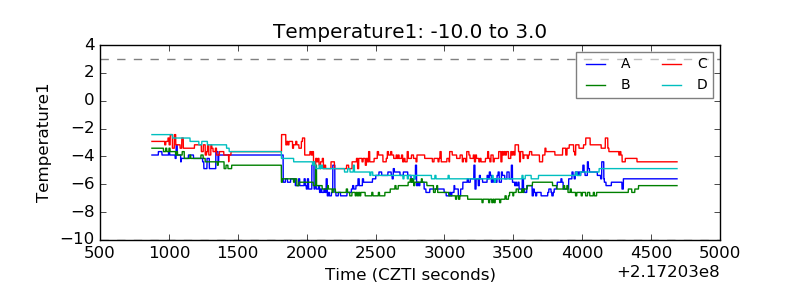 |
| Veto HV Monitor | 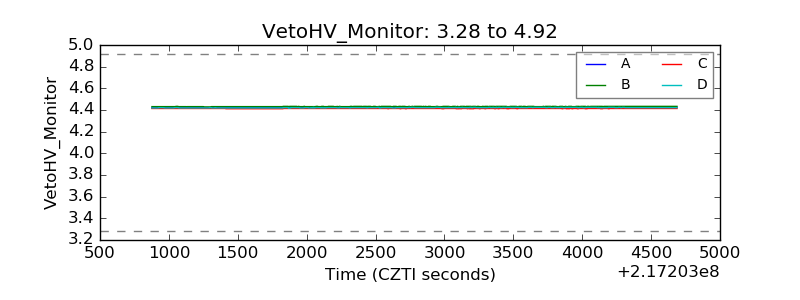 |
| Veto LLD | 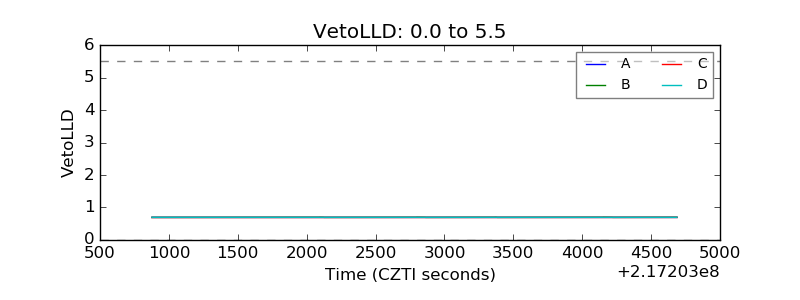 |
| Alpha Counter | 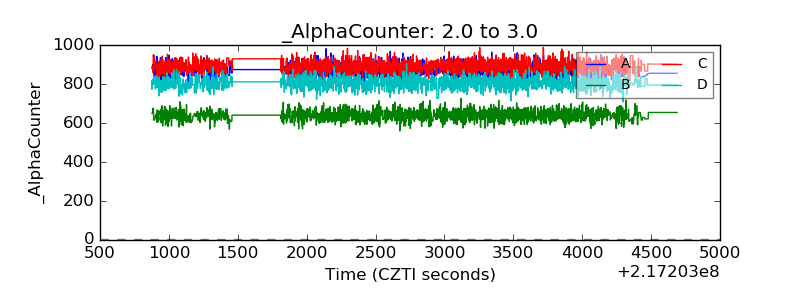 |
| _CPM_Rate | 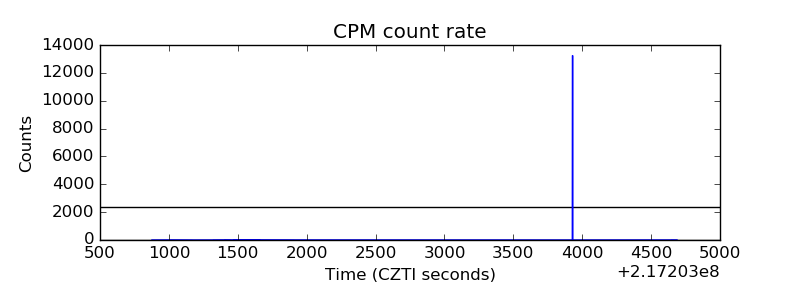 |
| CZT Counter | 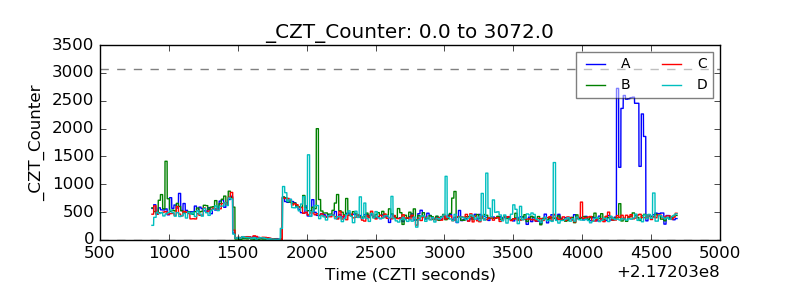 |
| +2.5 Volts monitor |  |
| +5 Volts monitor |  |
| _ROLL_ROT | 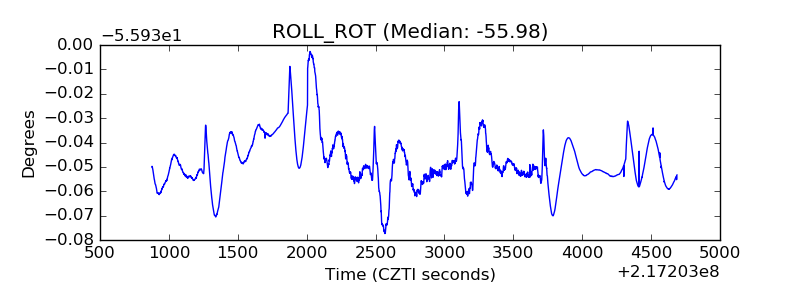 |
| _Roll_DEC | 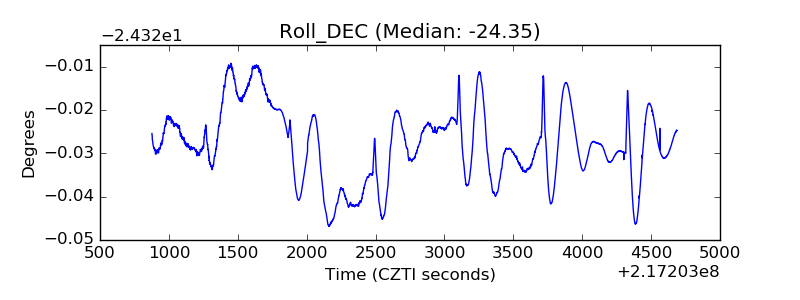 |
| _Roll_RA | 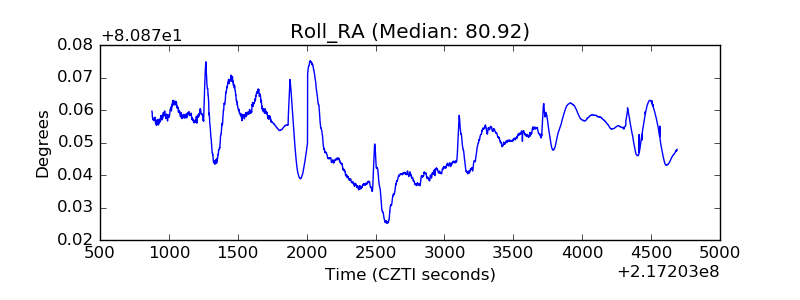 |
| Veto Counter | 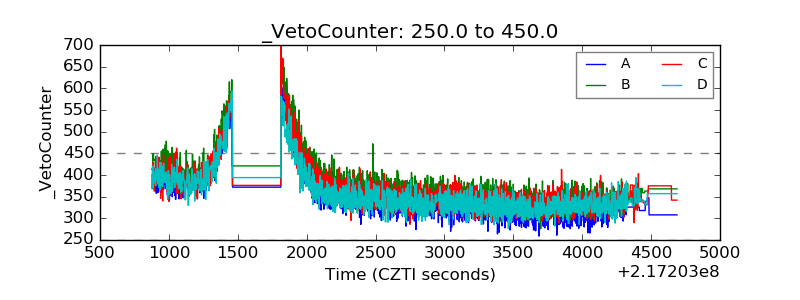 |