| Param | Original file | Final file |
|---|---|---|
| Filename | modeM0/AS1A02_152T01_9000000806_06188cztM0_level2.evt | modeM0/AS1A02_152T01_9000000806_06188cztM0_level2_quad_clean.evt |
| Size (bytes) | 305,326,080 | 46,915,200 |
| Size | 291.2 MB | 44.7 MB |
| Events in quadrant A | 2,491,325 | 268,942 |
| Events in quadrant B | 2,199,696 | 293,951 |
| Events in quadrant C | 2,090,947 | 278,915 |
| Events in quadrant D | 2,161,939 | 266,772 |
| Mode SS | |||
|---|---|---|---|
| Quadrant | BADHDUFLAG | Total packets | Discarded packets |
| A | 0 | 100 | 12 |
| B | 0 | 100 | 12 |
| C | 0 | 100 | 12 |
| D | 0 | 100 | 12 |
| Mode M0 | |||
|---|---|---|---|
| Quadrant | BADHDUFLAG | Total packets | Discarded packets |
| A | 0 | 11286 | 980 |
| B | 0 | 10328 | 898 |
| C | 0 | 10134 | 880 |
| D | 0 | 10634 | 1142 |
| Mode M9 | |||
|---|---|---|---|
| Quadrant | BADHDUFLAG | Total packets | Discarded packets |
| A | 0 | 1 | 0 |
| B | 0 | 1 | 0 |
| C | 0 | 1 | 0 |
| D | 0 | 1 | 0 |
| Quadrant | Total seconds | Saturated seconds | Saturation percentage |
|---|---|---|---|
| A | 4416 | 194 | 4.393116% |
| B | 4468 | 75 | 1.678603% |
| C | 4456 | 42 | 0.942549% |
| D | 4387 | 28 | 0.638249% |
Noise dominated data is calculated using 1-second bins in cleaned event files. If a bin has >2000 counts, and if more than 50% of those come from <1% of pixels, then it is considered to be noise-dominated and hence unusable.
| Quadrant | # 1 sec bins | Bins with >0 counts | Bins with >2000 counts | High rate bins dominated by noise | Noise dominated (total time) | Noise dominated (detector-on time) | Marked lightcurve |
|---|---|---|---|---|---|---|---|
| A | 4923 | 4766 | 150 | 150 | 3.05% | 3.15% | 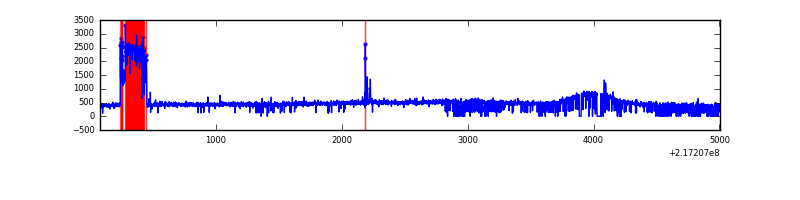 |
| B | 4923 | 4787 | 2 | 2 | 0.04% | 0.04% | 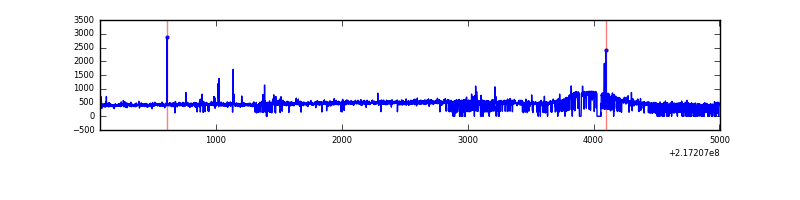 |
| C | 4923 | 4772 | 0 | 0 | 0.00% | 0.00% | 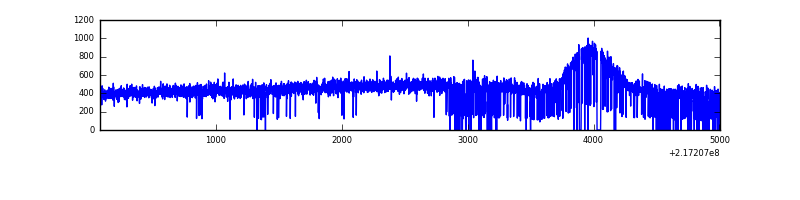 |
| D | 4923 | 4743 | 9 | 9 | 0.18% | 0.19% | 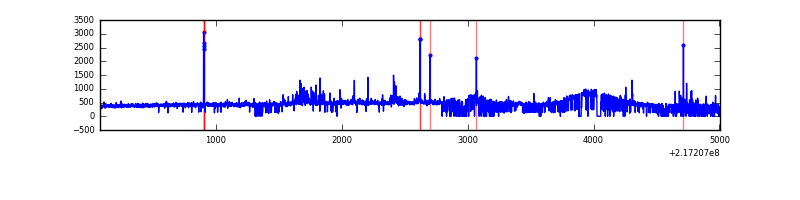 |
Top three noisy pixels from each quadrant. If the there are fewer than three noisy pixels in the level2.evt file, extra rows are filled as -1
| Pixel properties | Quadrant properties | ||||||
|---|---|---|---|---|---|---|---|
| Quadrant | DetID | PixID | Counts | Sigma | Mean | Median | Sigma |
| A | 15 | 236 | 419010 | 3780.69 | 532 | 519 | 110.7 |
| A | 8 | 15 | 19094 | 167.81 | 532 | 519 | 110.7 |
| A | 0 | 254 | 7067 | 59.16 | 532 | 519 | 110.7 |
| B | 3 | 64 | 30677 | 280.94 | 551 | 538 | 107.3 |
| B | 12 | 111 | 11197 | 99.36 | 551 | 538 | 107.3 |
| B | 15 | 204 | 9414 | 82.74 | 551 | 538 | 107.3 |
| C | 1 | 16 | 5990 | 43.16 | 533 | 534 | 126.4 |
| C | 13 | 61 | 4141 | 28.53 | 533 | 534 | 126.4 |
| C | 8 | 128 | 3157 | 20.75 | 533 | 534 | 126.4 |
| D | 2 | 136 | 85479 | 652.99 | 525 | 507 | 130.1 |
| D | 8 | 195 | 37792 | 286.53 | 525 | 507 | 130.1 |
| D | 5 | 97 | 27426 | 206.87 | 525 | 507 | 130.1 |
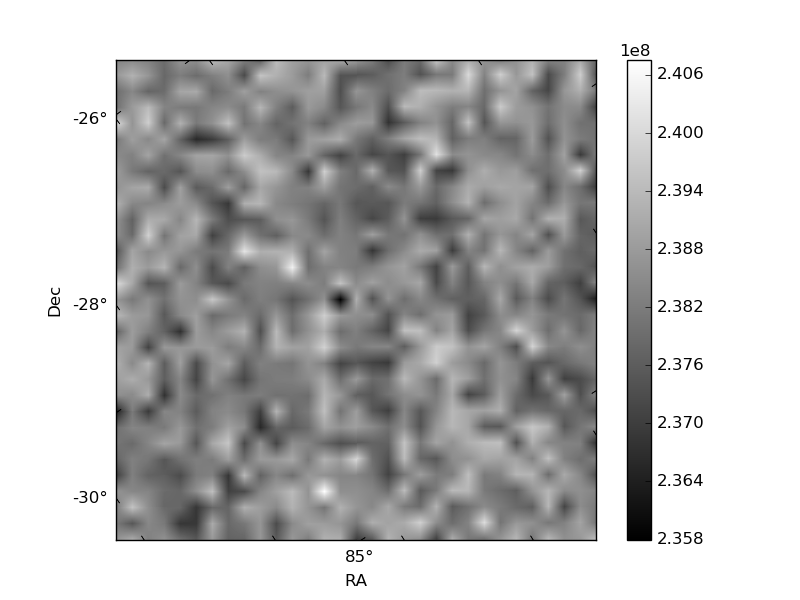
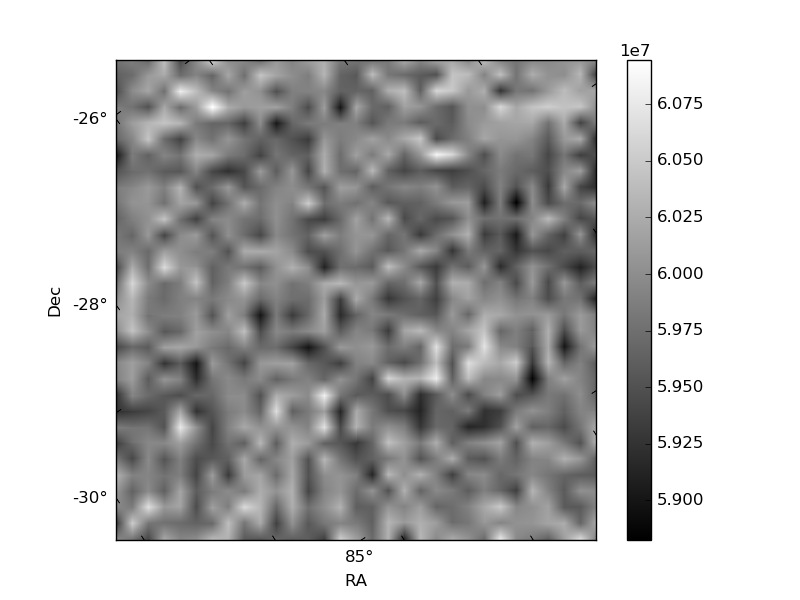
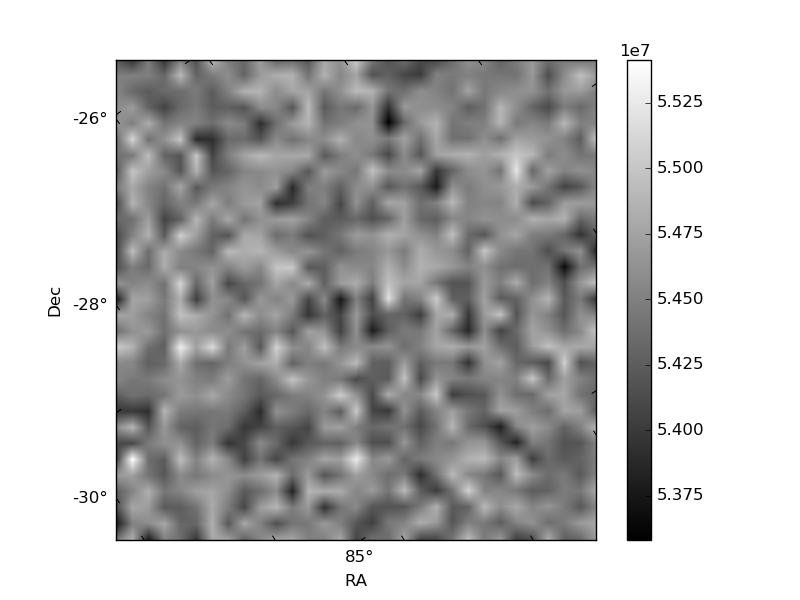
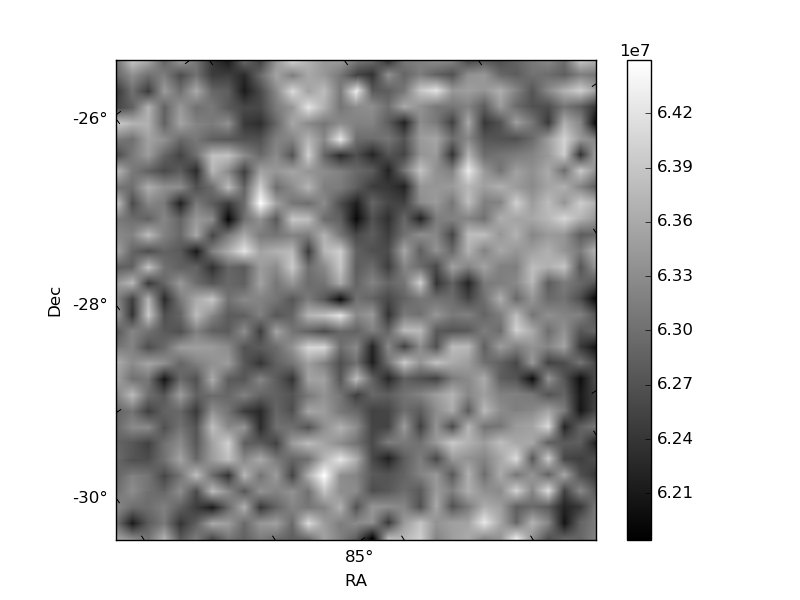
Histogram calculated using DETX and DETY for each event in the final _common_clean file
| Quadrant A | 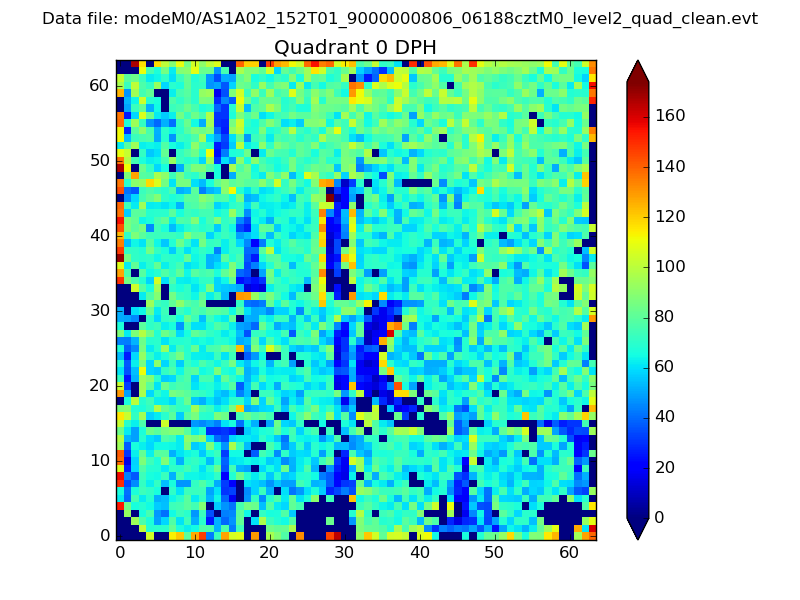 |
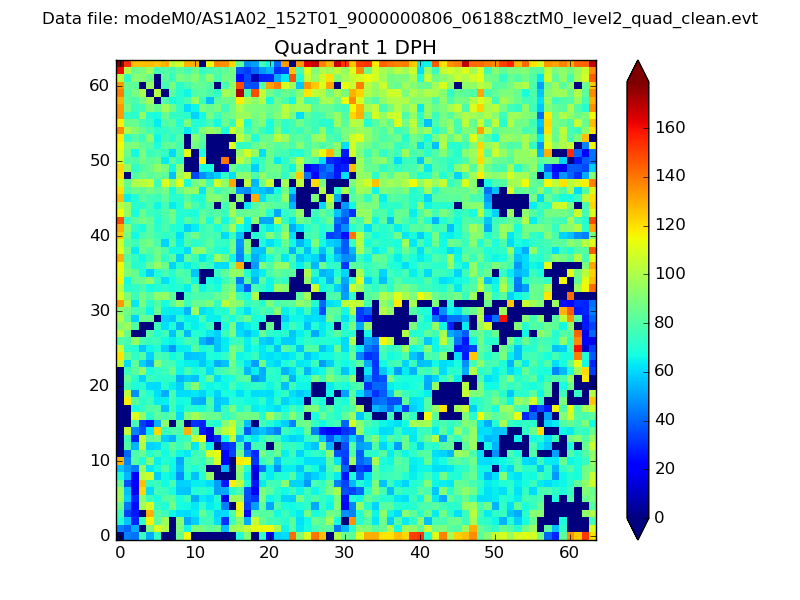 |
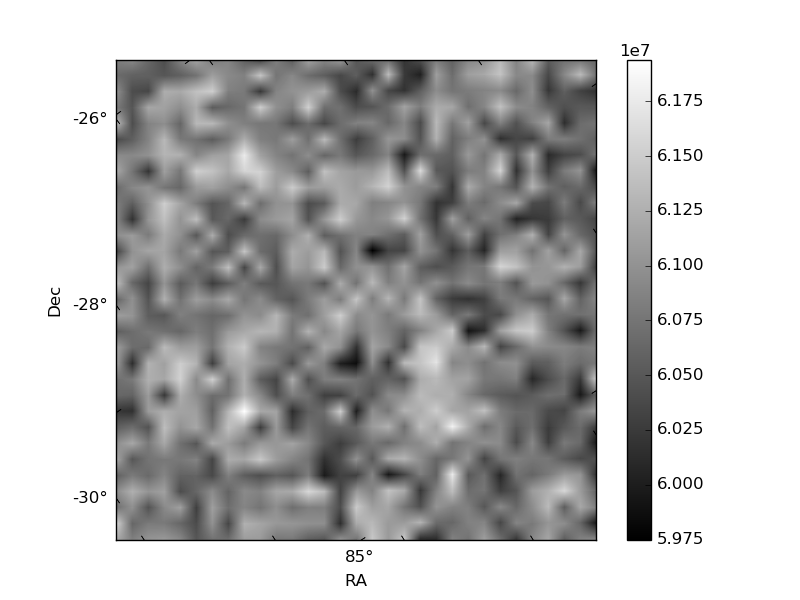
Quadrant B |
|---|---|---|---|
| Quadrant D | 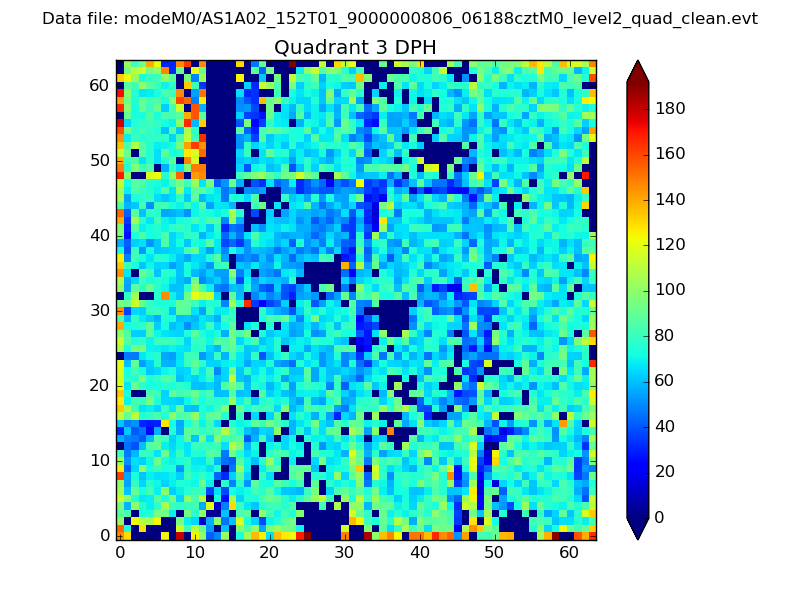 |
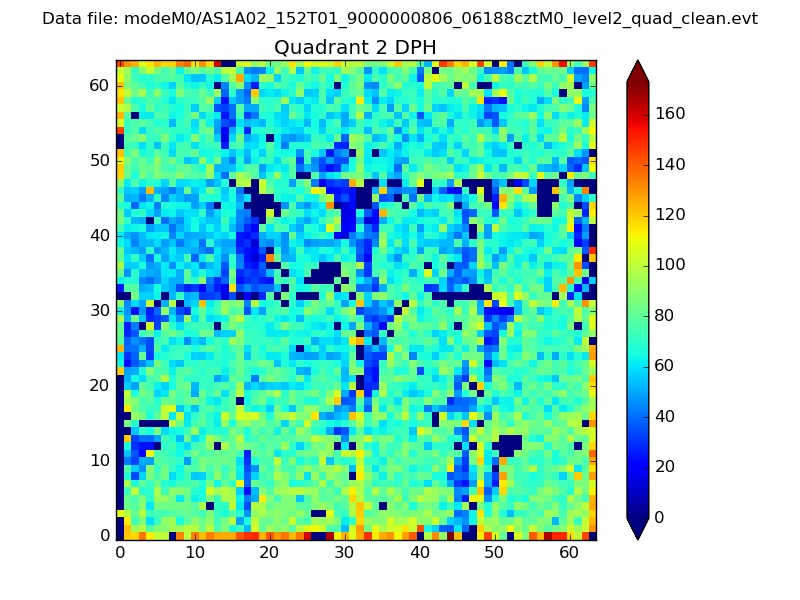 |
Quadrant C |
| Plot type | Count rate plots | Images |
|---|---|---|
| Comparison with Poisson distribution Blue bars denote a histogram of data divided into 1 sec bins. Red curve is a Poisson curve with rate = median count rate of data. |
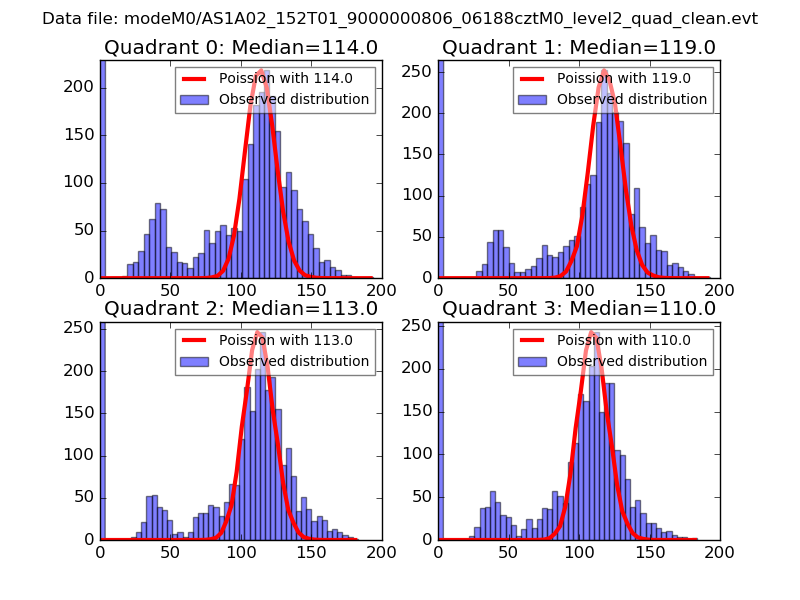 |
 |
| Quadrant-wise count rates Data is divided into 100 sec bins |
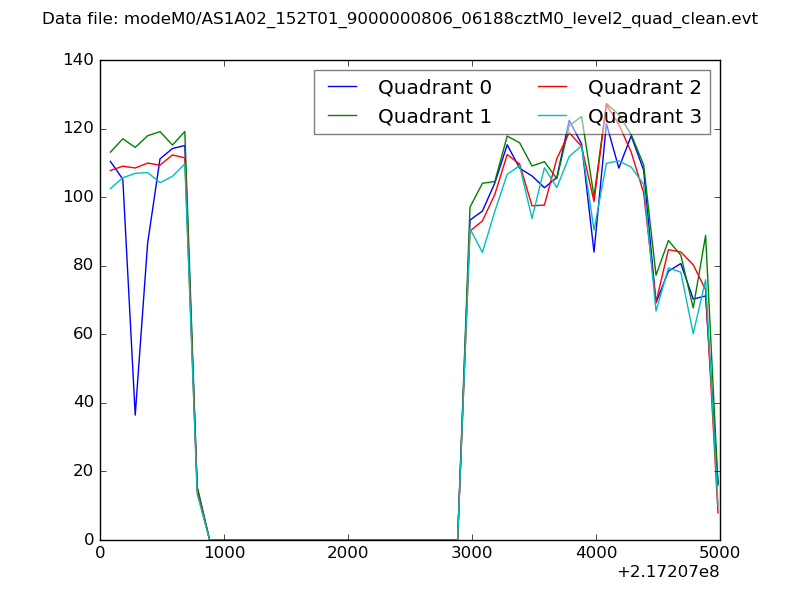 |
|
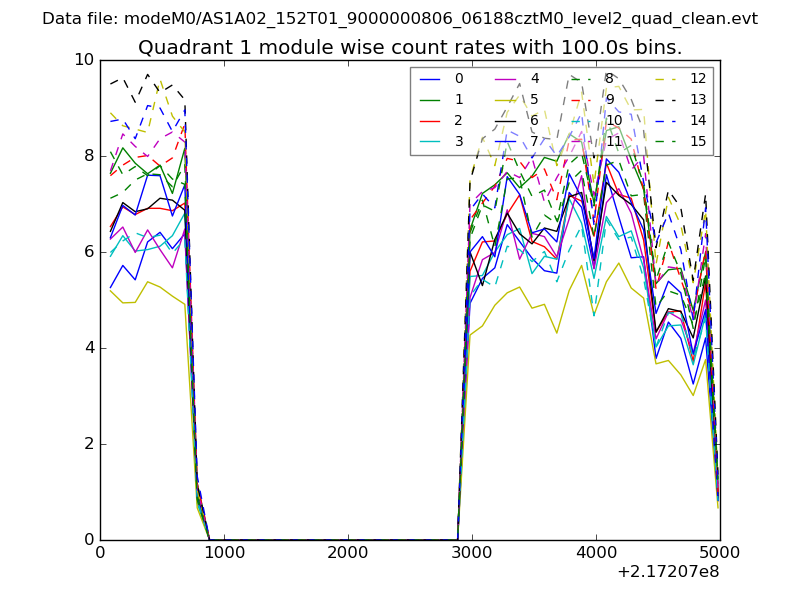
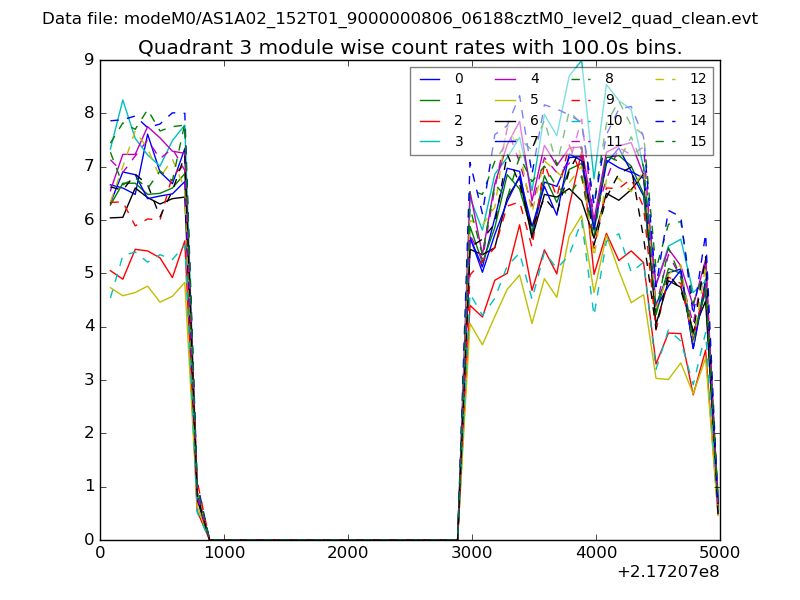
| Module-wise count rates for Quadrant A Data is divided into 100 sec bins |
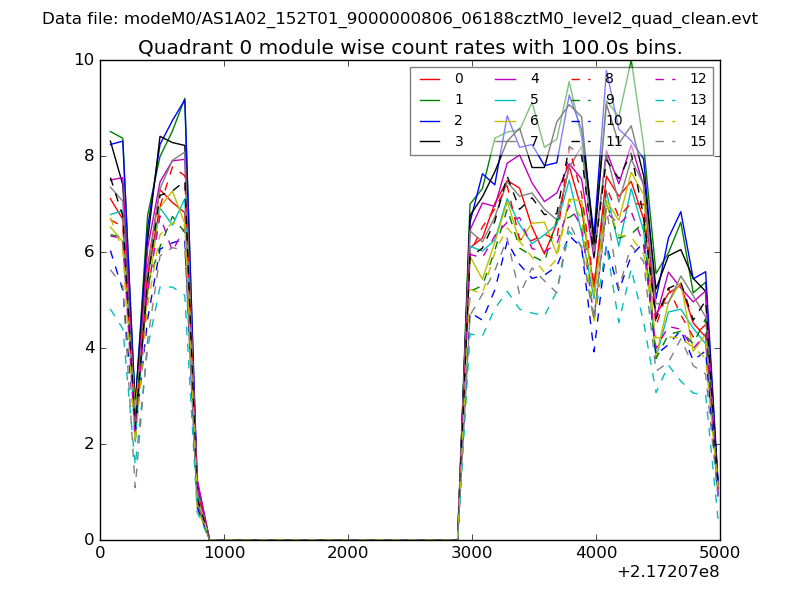 |
 |
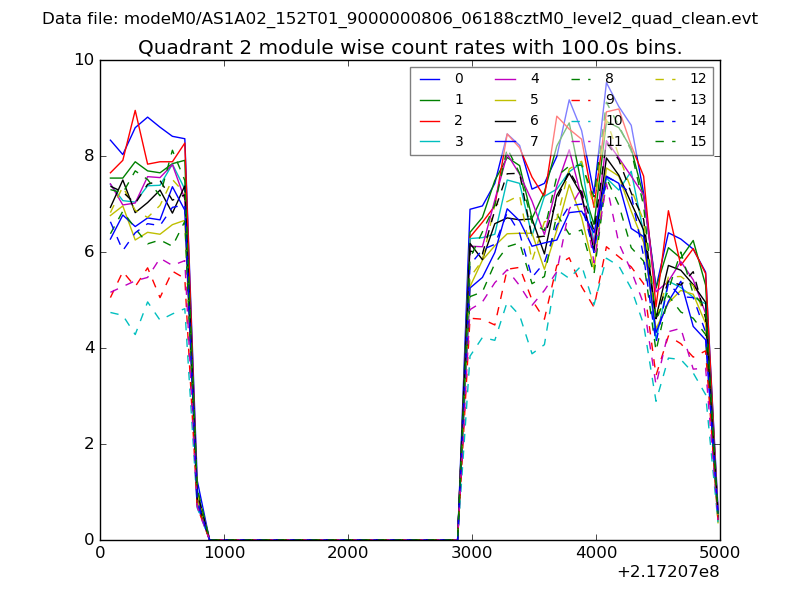
| Module-wise count rates for Quadrant B Data is divided into 100 sec bins |
 |
 |
| Module-wise count rates for Quadrant C Data is divided into 100 sec bins |
 |
 |
| Module-wise count rates for Quadrant D Data is divided into 100 sec bins |
 |
 |
| Parameter | Plot |
|---|---|
| CZT HV Monitor | 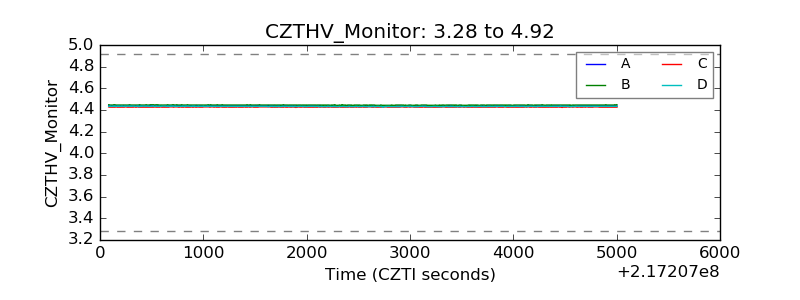 |
| D_VDD | 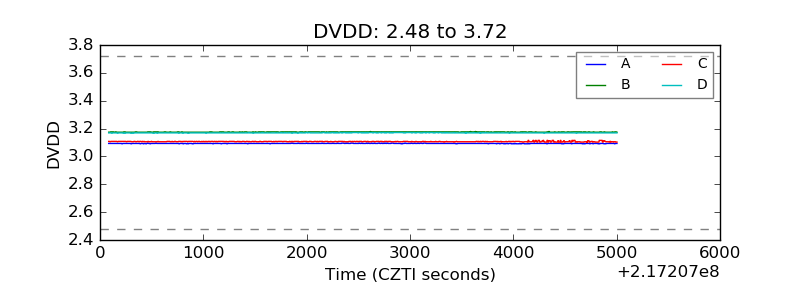 |
| Temperature 1 | 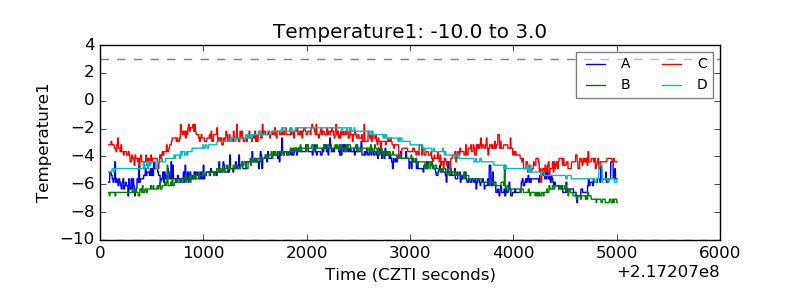 |
| Veto HV Monitor | 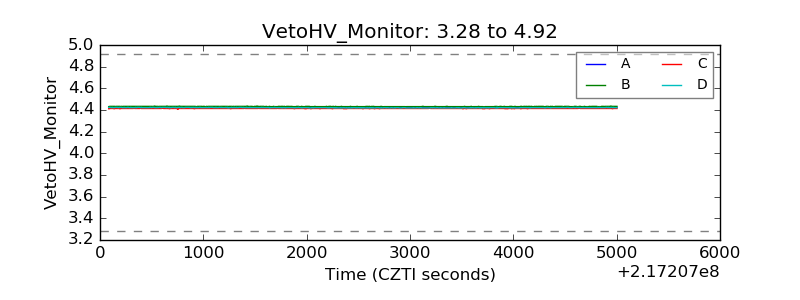 |
| Veto LLD | 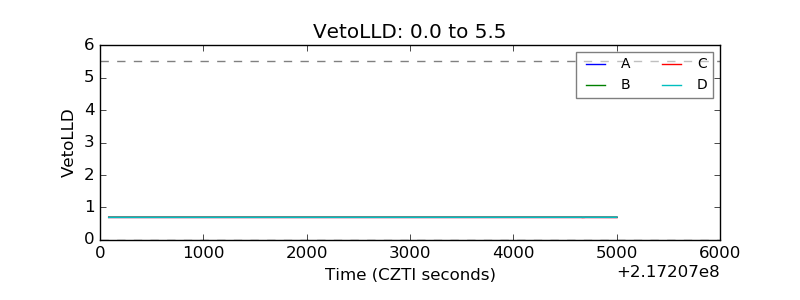 |
| Alpha Counter | 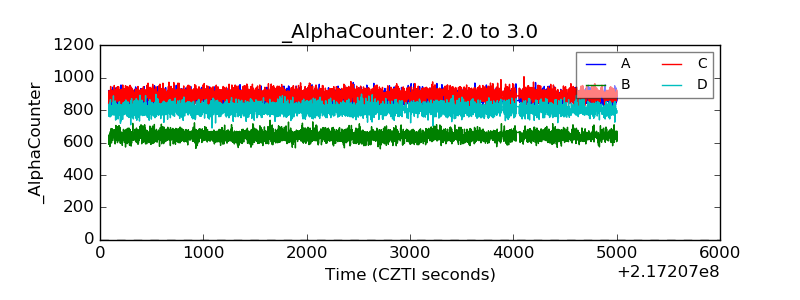 |
| _CPM_Rate | 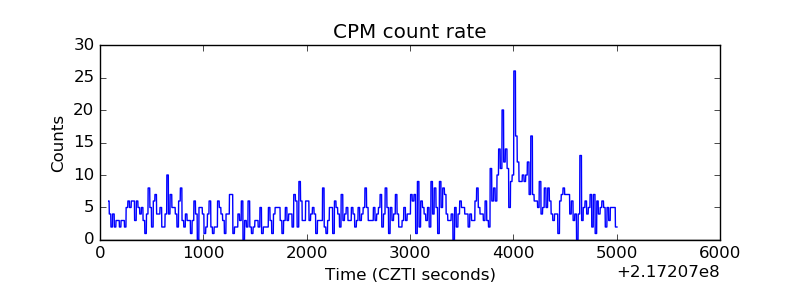 |
| CZT Counter | 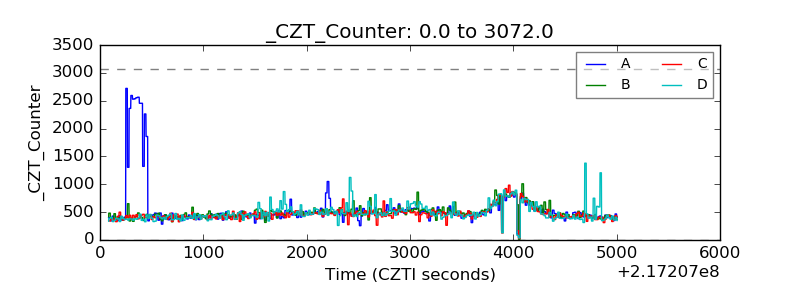 |
| +2.5 Volts monitor |  |
| +5 Volts monitor | 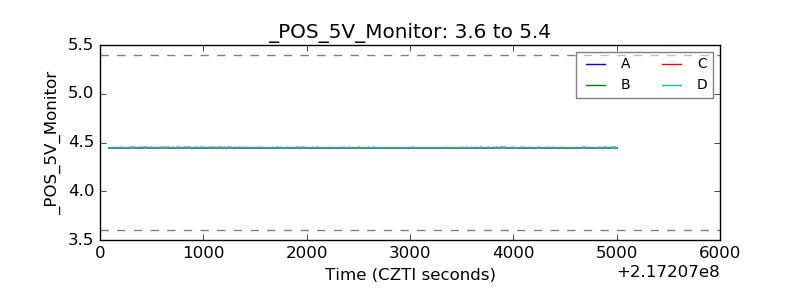 |
| _ROLL_ROT | 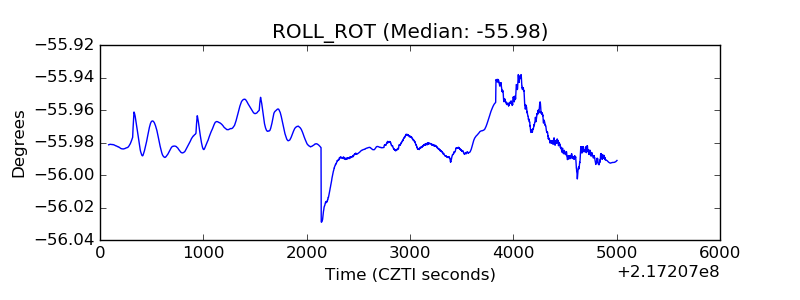 |
| _Roll_DEC | 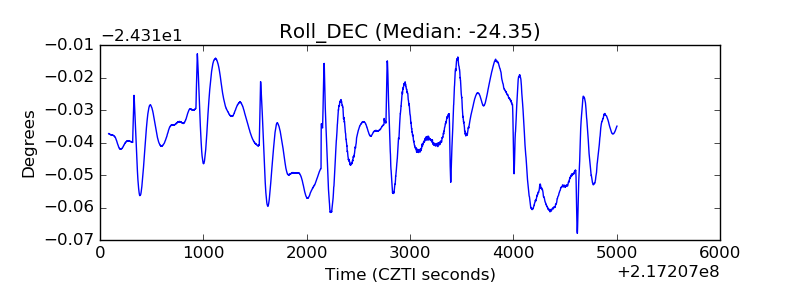 |
| _Roll_RA | 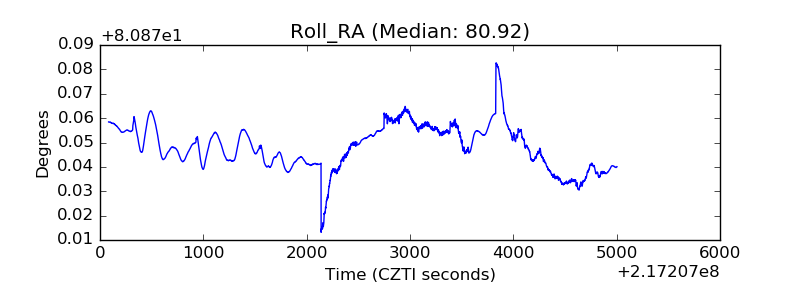 |
| Veto Counter | 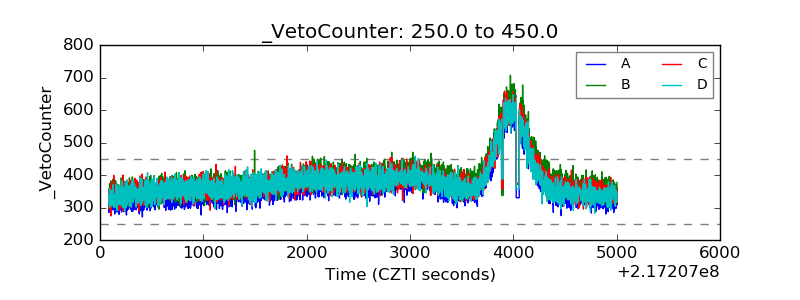 |