| Param | Original file | Final file |
|---|---|---|
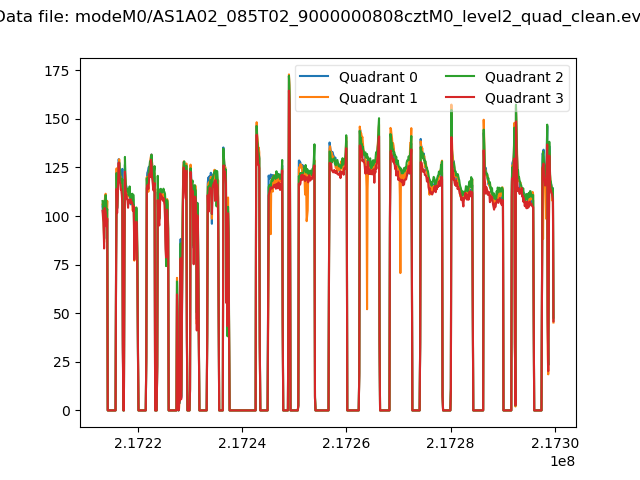
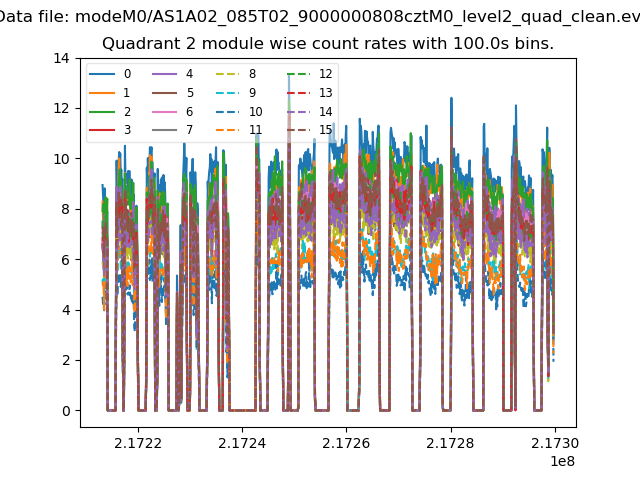
| Filename | modeM0/AS1A02_085T02_9000000808cztM0_level2.fits | modeM0/AS1A02_085T02_9000000808cztM0_level2_quad_clean.evt |
| Size (bytes) | 672,030,720 | 707,955,840 |
| Size | 640.9 MB | 675.2 MB |
| Events in quadrant A | 4,044,268 | 4,279,213 |
| Events in quadrant B | 3,854,994 | 4,184,417 |
| Events in quadrant C | 4,018,344 | 4,168,393 |
| Events in quadrant D | 3,451,030 | 3,827,402 |
| Mode SS | |||
|---|---|---|---|
| Quadrant | BADHDUFLAG | Total packets | Discarded packets |
| A | 0 | 1494 | 0 |
| B | 0 | 1488 | 0 |
| C | 0 | 1496 | 0 |
| D | 0 | 1474 | 0 |
| Mode M9 | |||
|---|---|---|---|
| Quadrant | BADHDUFLAG | Total packets | Discarded packets |
| A | 0 | 112 | 0 |
| B | 0 | 112 | 0 |
| C | 0 | 112 | 0 |
| D | 0 | 111 | 0 |
| Mode M0 | |||
|---|---|---|---|
| Quadrant | BADHDUFLAG | Total packets | Discarded packets |
| A | 0 | 152530 | 0 |
| B | 0 | 170305 | 0 |
| C | 0 | 149671 | 0 |
| D | 0 | 168419 | 0 |
| Quadrant | Total seconds | Saturated seconds | Saturation percentage |
|---|---|---|---|
| A | 72694 | 748 | 1.028971% |
| B | 72582 | 2331 | 3.211540% |
| C | 72675 | 538 | 0.740282% |
| D | 72547 | 1053 | 1.451473% |
Noise dominated data is calculated using 1-second bins in cleaned event files. If a bin has >2000 counts, and if more than 50% of those come from <1% of pixels, then it is considered to be noise-dominated and hence unusable.
| Quadrant | # 1 sec bins | Bins with >0 counts | Bins with >2000 counts | High rate bins dominated by noise | Noise dominated (total time) | Noise dominated (detector-on time) | Marked lightcurve |
|---|---|---|---|---|---|---|---|
| A | 86645 | 73714 | 0 | 0 | 0.00% | 0.00% | 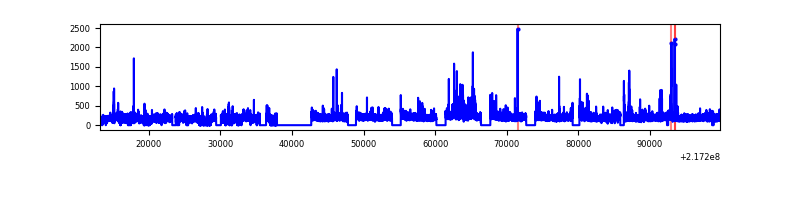 |
| B | 86645 | 73634 | 0 | 0 | 0.00% | 0.00% | 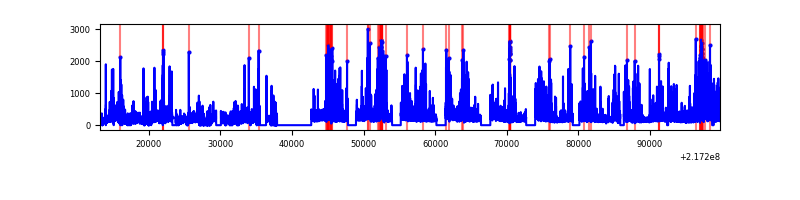 |
| C | 86645 | 73730 | 0 | 0 | 0.00% | 0.00% | 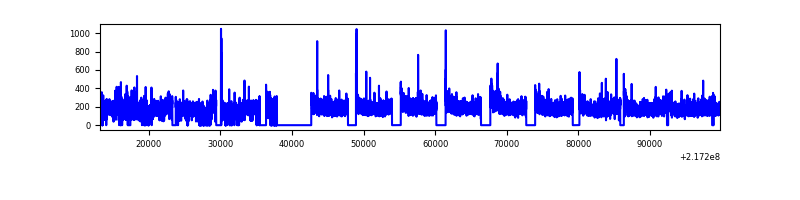 |
| D | 86645 | 73624 | 0 | 0 | 0.00% | 0.00% |  |
Top three noisy pixels from each quadrant. If the there are fewer than three noisy pixels in the level2.evt file, extra rows are filled as -1
| Pixel properties | Quadrant properties | ||||||
|---|---|---|---|---|---|---|---|
| Quadrant | DetID | PixID | Counts | Sigma | Mean | Median | Sigma |
| A | 14 | 188 | 3983 | 11.18 | 1050 | 981 | 268.4 |
| A | 0 | 29 | 3965 | 11.12 | 1050 | 981 | 268.4 |
| A | 7 | 110 | 3552 | 9.58 | 1050 | 981 | 268.4 |
| B | 2 | 9 | 3440 | 12.05 | 1018 | 971 | 204.9 |
| B | 12 | 226 | 2776 | 8.81 | 1018 | 971 | 204.9 |
| B | 14 | 254 | 2720 | 8.54 | 1018 | 971 | 204.9 |
| C | 1 | 81 | 3117 | 7.58 | 1061 | 984 | 281.5 |
| C | 1 | 80 | 3098 | 7.51 | 1061 | 984 | 281.5 |
| C | 12 | 241 | 2801 | 6.45 | 1061 | 984 | 281.5 |
| D | 11 | 82 | 2589 | 6.45 | 983 | 893 | 262.9 |
| D | 3 | 14 | 2586 | 6.44 | 983 | 893 | 262.9 |
| D | 6 | 231 | 2583 | 6.43 | 983 | 893 | 262.9 |
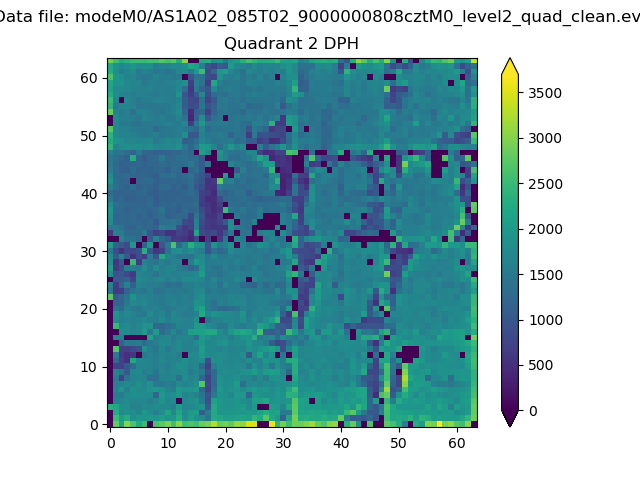
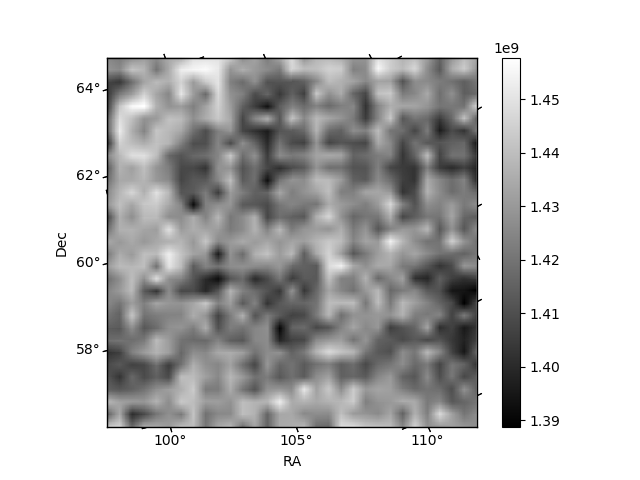
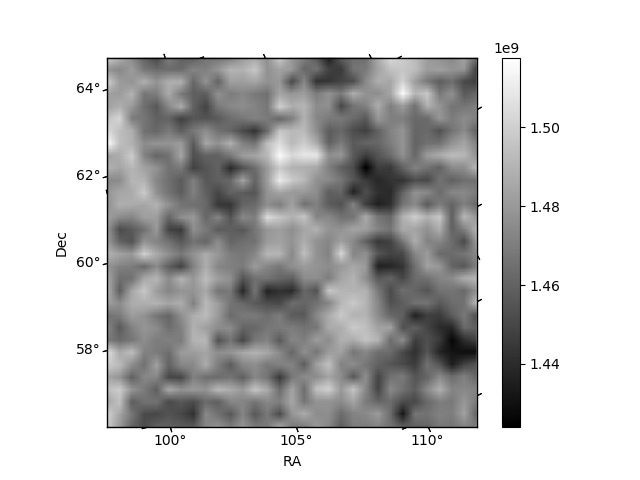
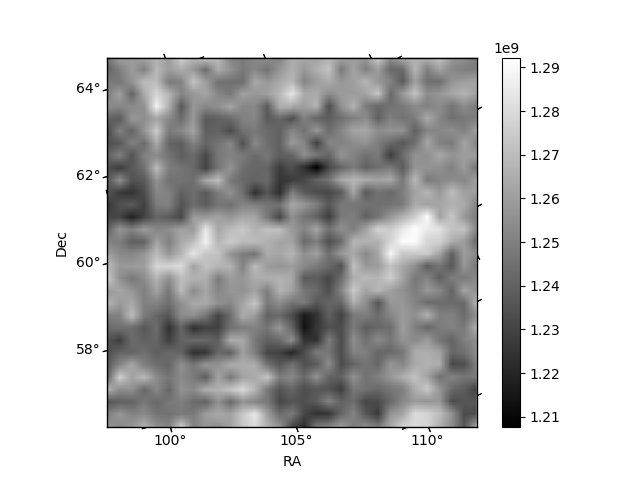
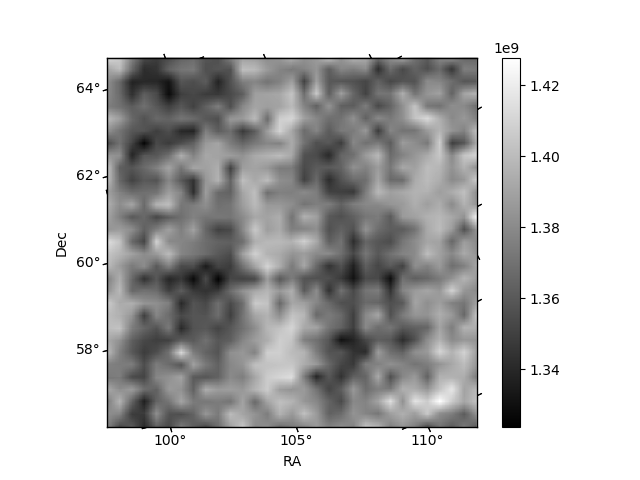
Histogram calculated using DETX and DETY for each event in the final _common_clean file
| Quadrant A | 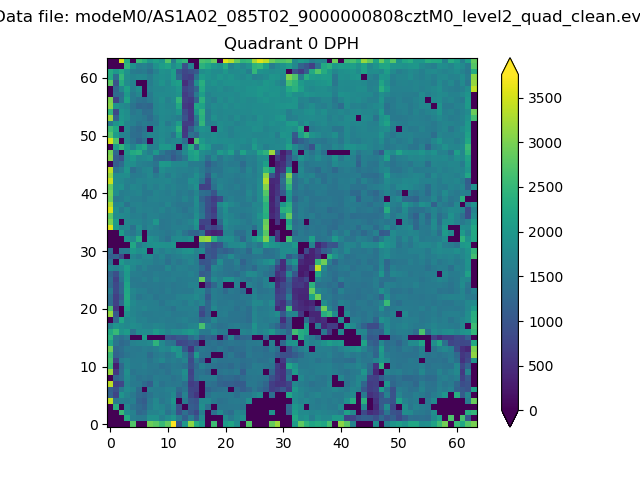 |
 |
Quadrant B |
|---|---|---|---|
| Quadrant D | 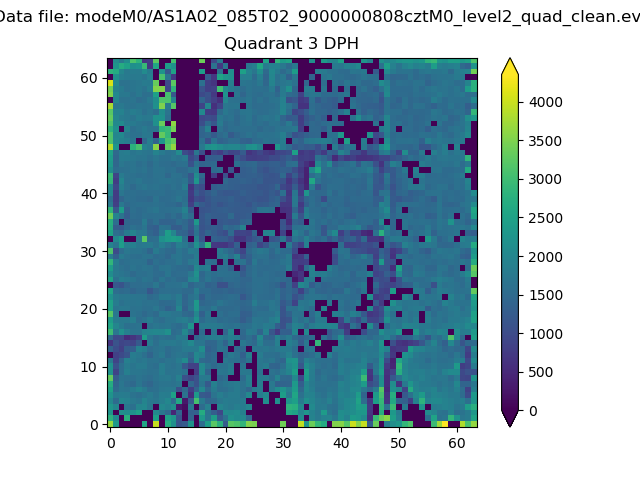 |
 |
Quadrant C |
| Plot type | Count rate plots | Images |
|---|---|---|
| Comparison with Poisson distribution Blue bars denote a histogram of data divided into 1 sec bins. Red curve is a Poisson curve with rate = median count rate of data. |
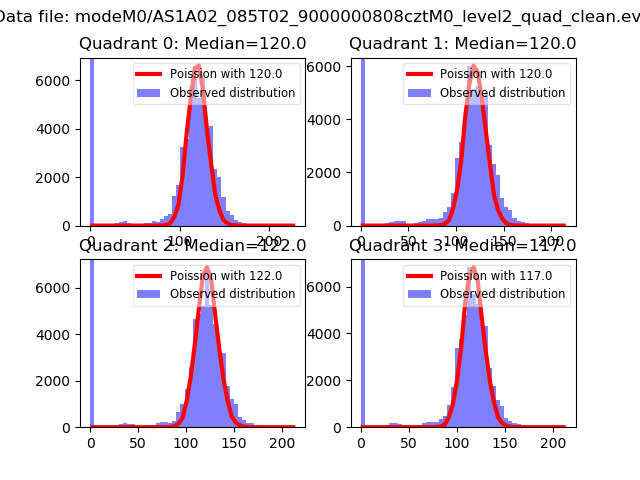 |
 |
| Quadrant-wise count rates Data is divided into 100 sec bins |
 |
|
| Module-wise count rates for Quadrant A Data is divided into 100 sec bins |
 |
 |
| Module-wise count rates for Quadrant B Data is divided into 100 sec bins |
 |
 |
| Module-wise count rates for Quadrant C Data is divided into 100 sec bins |
 |
 |
| Module-wise count rates for Quadrant D Data is divided into 100 sec bins |
 |
 |
| Parameter | Plot |
|---|---|
| CZT HV Monitor | 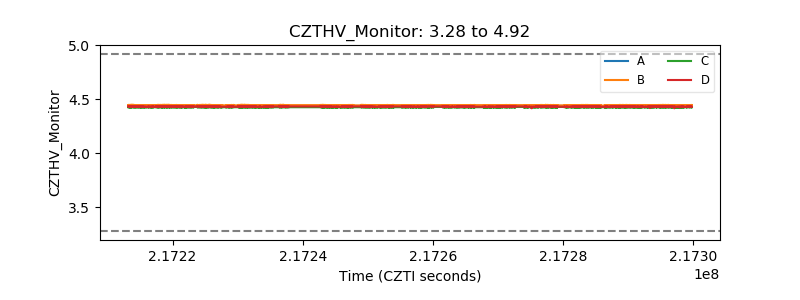 |
| D_VDD | 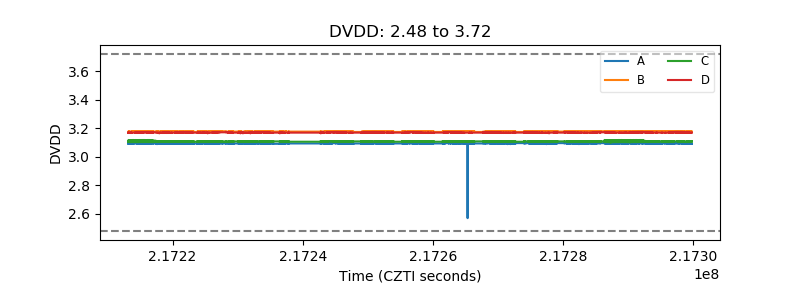 |
| Temperature 1 |  |
| Veto HV Monitor | 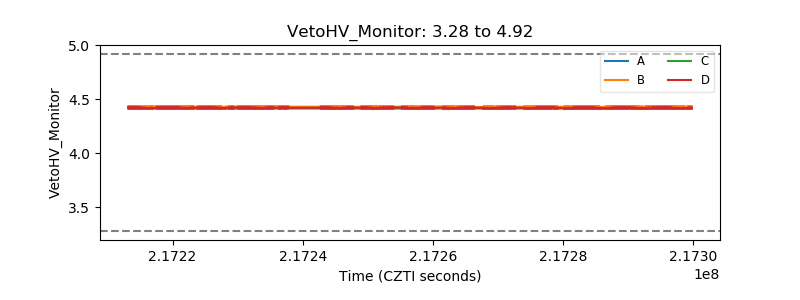 |
| Veto LLD |  |
| Alpha Counter |  |
| _CPM_Rate | 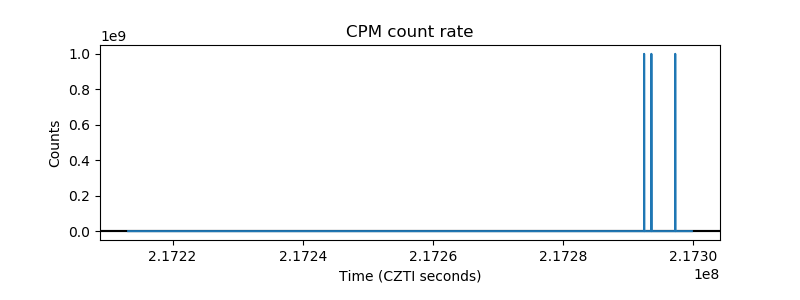 |
| CZT Counter | 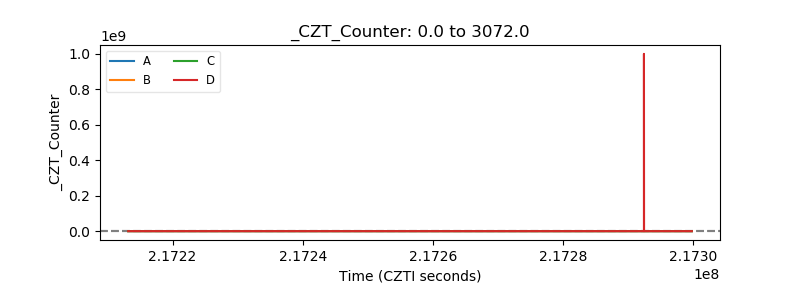 |
| +2.5 Volts monitor |  |
| +5 Volts monitor | 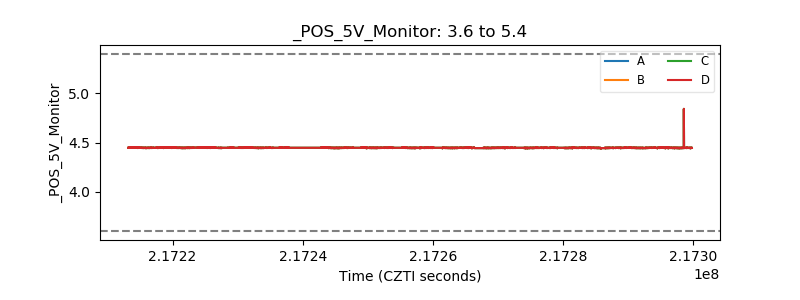 |
| _ROLL_ROT |  |
| _Roll_DEC | 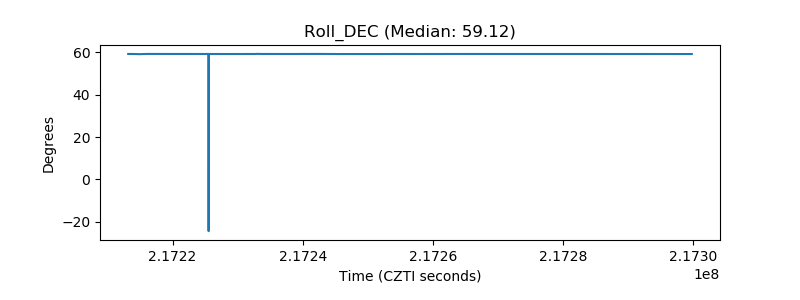 |
| _Roll_RA | 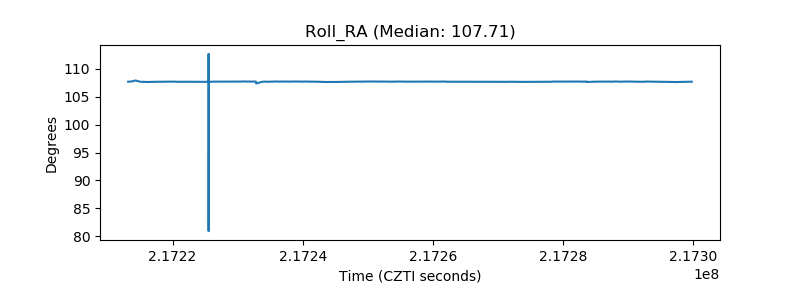 |
| Veto Counter | 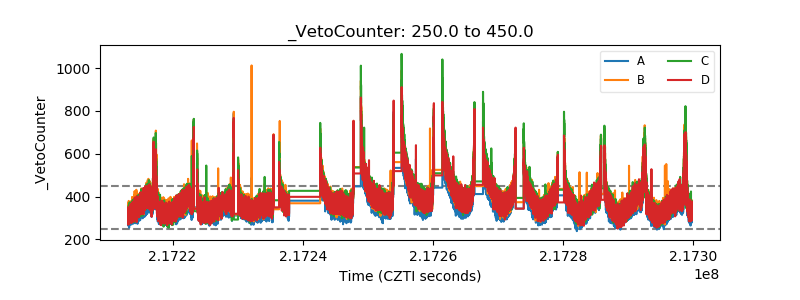 |