| Param | Original file | Final file |
|---|---|---|
| Filename | modeM0/AS1A02_085T02_9000000808_06189cztM0_level2.evt | modeM0/AS1A02_085T02_9000000808_06189cztM0_level2_quad_clean.evt |
| Size (bytes) | 932,060,160 | 180,688,320 |
| Size | 888.9 MB | 172.3 MB |
| Events in quadrant A | 6,509,155 | 1,123,129 |
| Events in quadrant B | 7,162,660 | 1,132,015 |
| Events in quadrant C | 6,347,869 | 1,139,901 |
| Events in quadrant D | 7,230,767 | 1,082,305 |
| Mode SS | |||
|---|---|---|---|
| Quadrant | BADHDUFLAG | Total packets | Discarded packets |
| A | 0 | 331 | 27 |
| B | 0 | 330 | 36 |
| C | 0 | 332 | 30 |
| D | 0 | 332 | 46 |
| Mode M9 | |||
|---|---|---|---|
| Quadrant | BADHDUFLAG | Total packets | Discarded packets |
| A | 0 | 19 | 0 |
| B | 0 | 19 | 0 |
| C | 0 | 19 | 0 |
| D | 0 | 19 | 0 |
| Mode M0 | |||
|---|---|---|---|
| Quadrant | BADHDUFLAG | Total packets | Discarded packets |
| A | 0 | 32689 | 3448 |
| B | 0 | 34658 | 3998 |
| C | 0 | 32655 | 3438 |
| D | 0 | 35568 | 3924 |
| Quadrant | Total seconds | Saturated seconds | Saturation percentage |
|---|---|---|---|
| A | 14412 | 114 | 0.791007% |
| B | 14354 | 170 | 1.184339% |
| C | 14416 | 72 | 0.499445% |
| D | 14371 | 234 | 1.628279% |
Noise dominated data is calculated using 1-second bins in cleaned event files. If a bin has >2000 counts, and if more than 50% of those come from <1% of pixels, then it is considered to be noise-dominated and hence unusable.
| Quadrant | # 1 sec bins | Bins with >0 counts | Bins with >2000 counts | High rate bins dominated by noise | Noise dominated (total time) | Noise dominated (detector-on time) | Marked lightcurve |
|---|---|---|---|---|---|---|---|
| A | 18151 | 15144 | 0 | 0 | 0.00% | 0.00% | 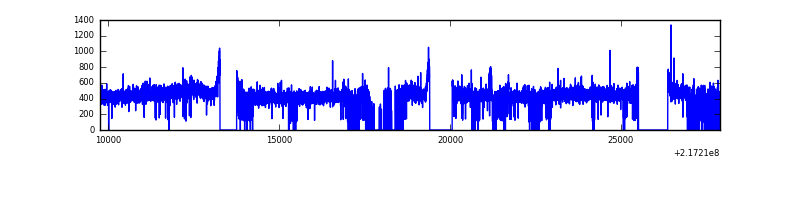 |
| B | 18151 | 15093 | 29 | 29 | 0.16% | 0.19% | 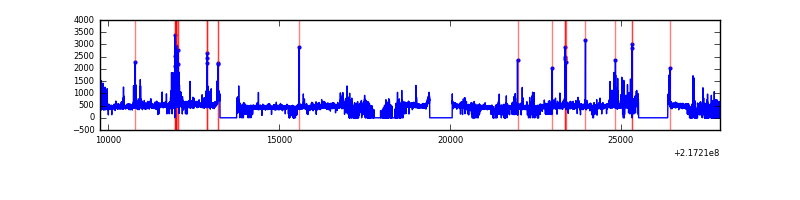 |
| C | 18150 | 15154 | 0 | 0 | 0.00% | 0.00% | 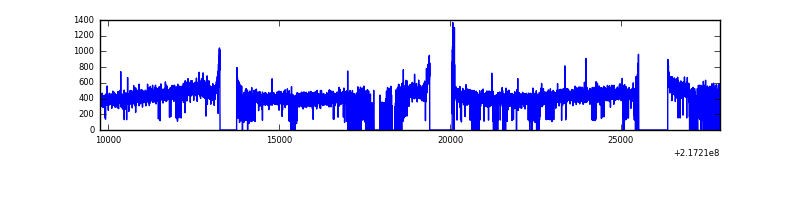 |
| D | 18150 | 15106 | 124 | 124 | 0.68% | 0.82% |  |
Top three noisy pixels from each quadrant. If the there are fewer than three noisy pixels in the level2.evt file, extra rows are filled as -1
| Pixel properties | Quadrant properties | ||||||
|---|---|---|---|---|---|---|---|
| Quadrant | DetID | PixID | Counts | Sigma | Mean | Median | Sigma |
| A | 8 | 15 | 117441 | 344.12 | 1648 | 1608 | 336.6 |
| A | 15 | 236 | 36330 | 103.15 | 1648 | 1608 | 336.6 |
| A | 0 | 226 | 16031 | 42.85 | 1648 | 1608 | 336.6 |
| B | 3 | 64 | 303227 | 951.79 | 1650 | 1610 | 316.9 |
| B | 15 | 204 | 243110 | 762.08 | 1650 | 1610 | 316.9 |
| B | 0 | 219 | 93254 | 289.19 | 1650 | 1610 | 316.9 |
| C | 1 | 16 | 82987 | 220.92 | 1600 | 1606 | 368.4 |
| C | 9 | 16 | 23186 | 58.58 | 1600 | 1606 | 368.4 |
| C | 13 | 61 | 12755 | 30.27 | 1600 | 1606 | 368.4 |
| D | 2 | 136 | 581035 | 1501.91 | 1587 | 1533 | 385.8 |
| D | 12 | 110 | 151565 | 388.84 | 1587 | 1533 | 385.8 |
| D | 13 | 105 | 148205 | 380.13 | 1587 | 1533 | 385.8 |
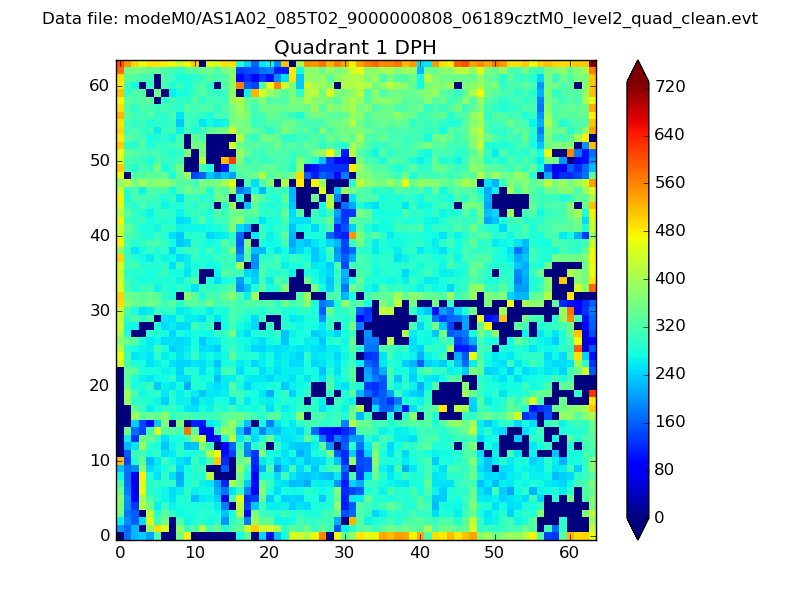
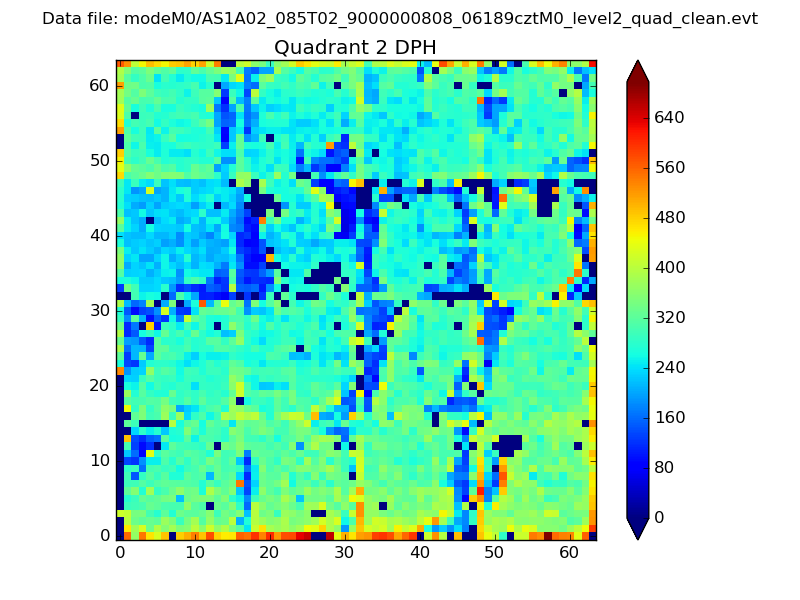
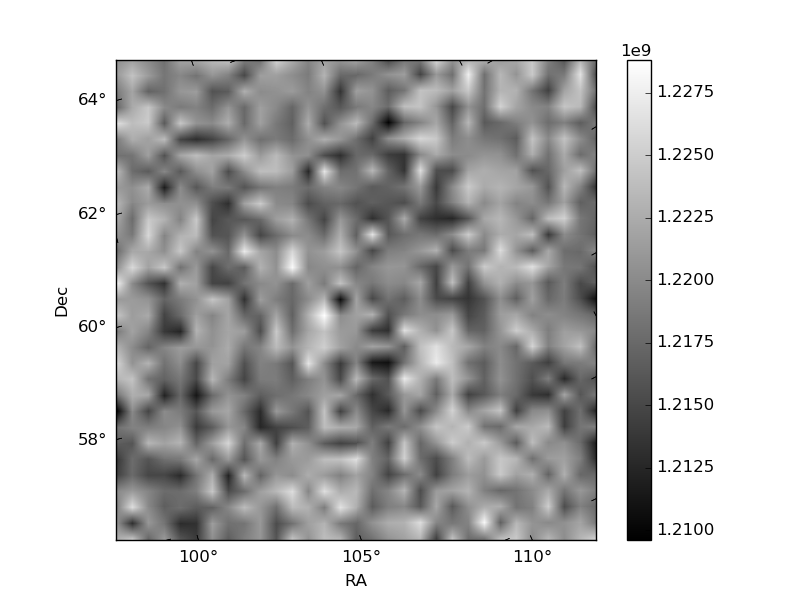
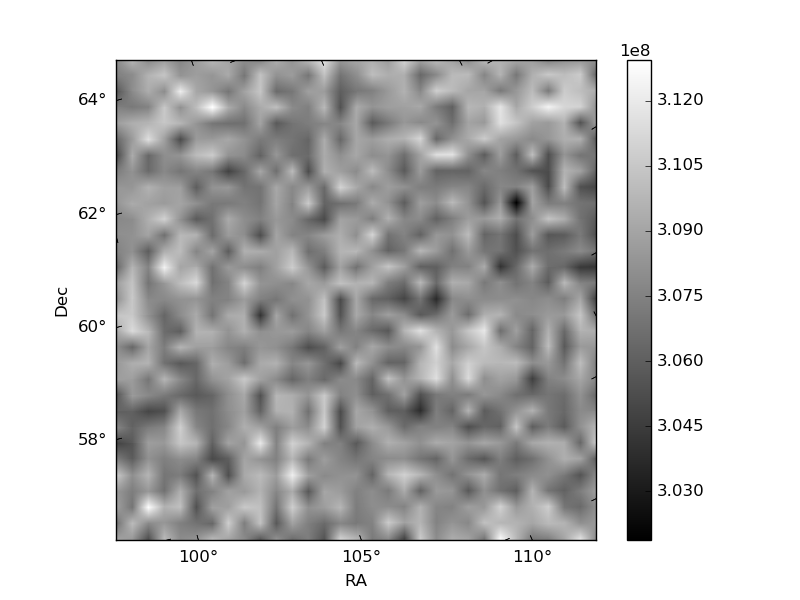
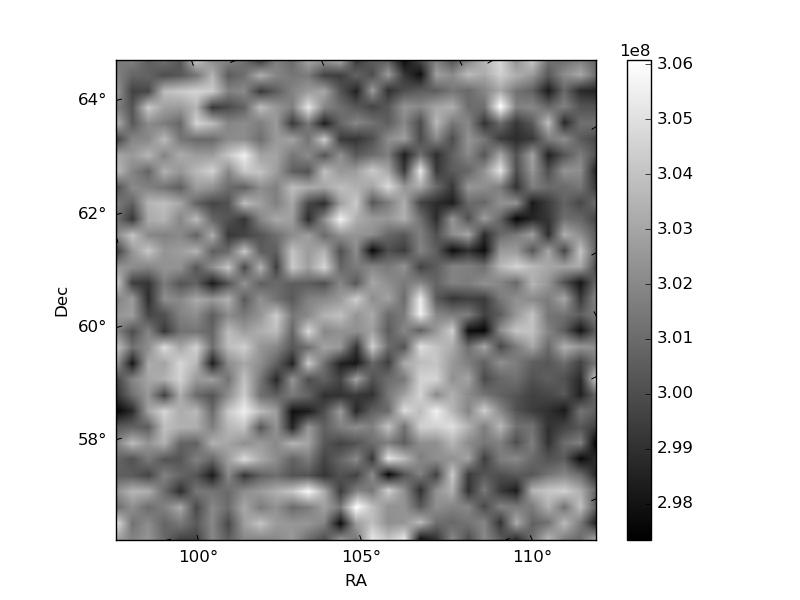
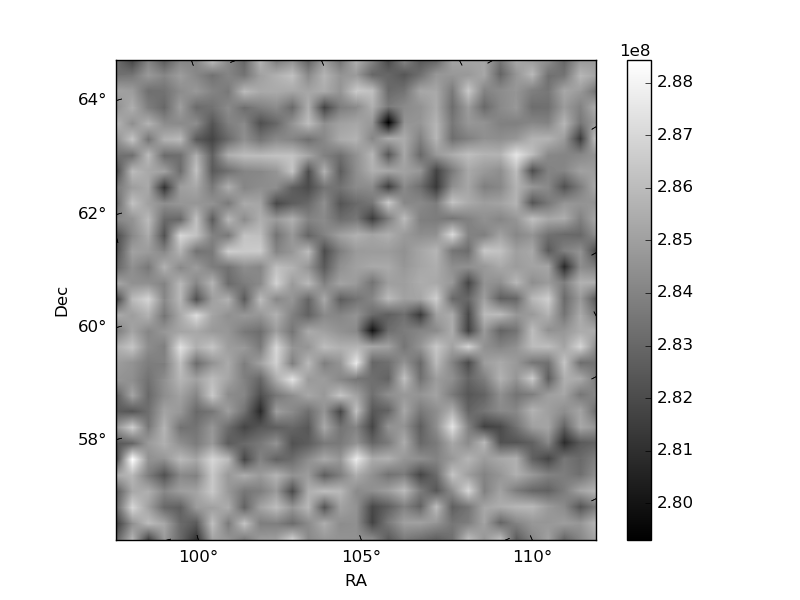
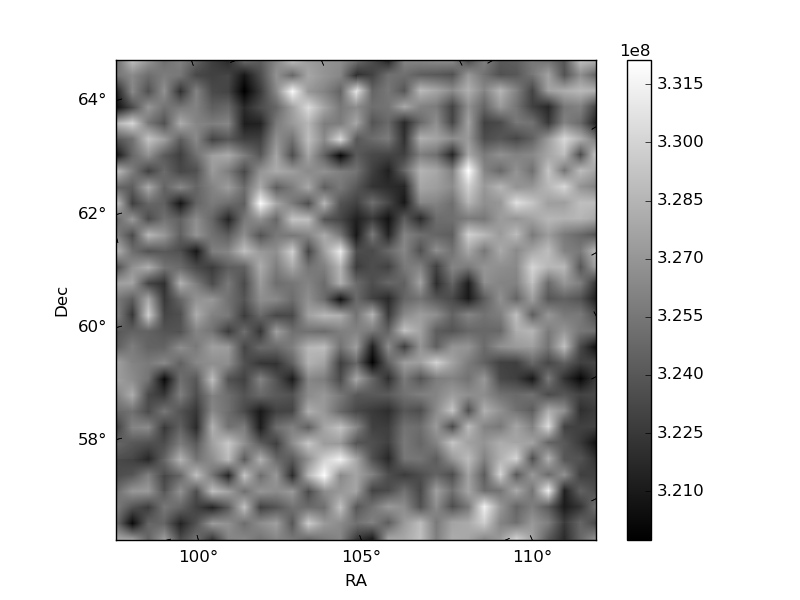
Histogram calculated using DETX and DETY for each event in the final _common_clean file
| Quadrant A | 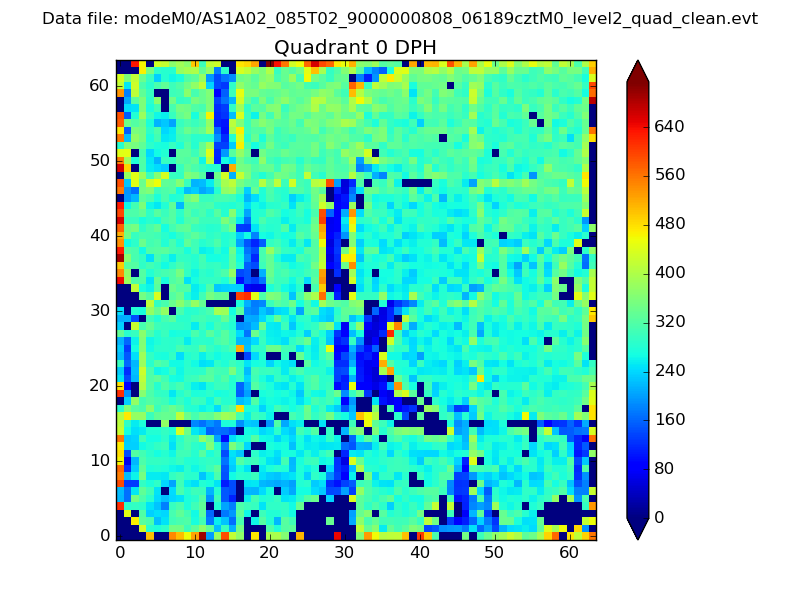 |
 |
Quadrant B |
|---|---|---|---|
| Quadrant D | 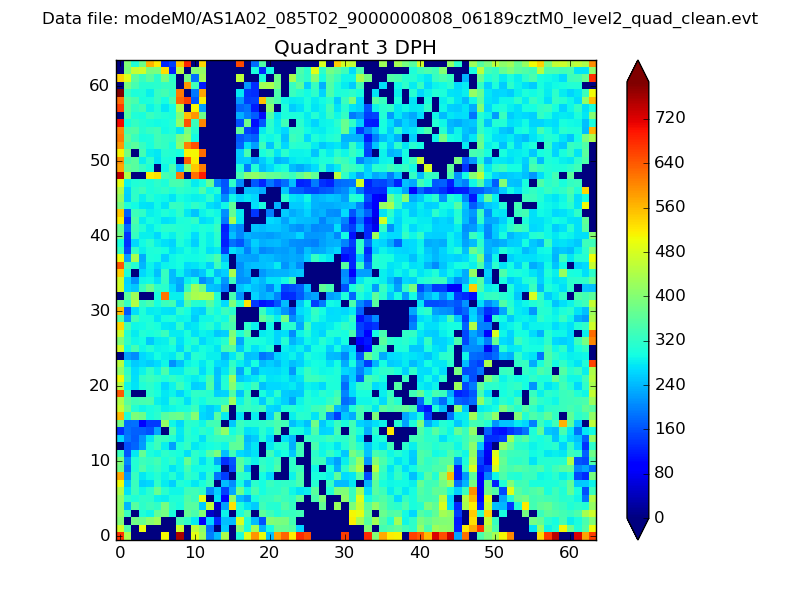 |
 |
Quadrant C |
| Plot type | Count rate plots | Images |
|---|---|---|
| Comparison with Poisson distribution Blue bars denote a histogram of data divided into 1 sec bins. Red curve is a Poisson curve with rate = median count rate of data. |
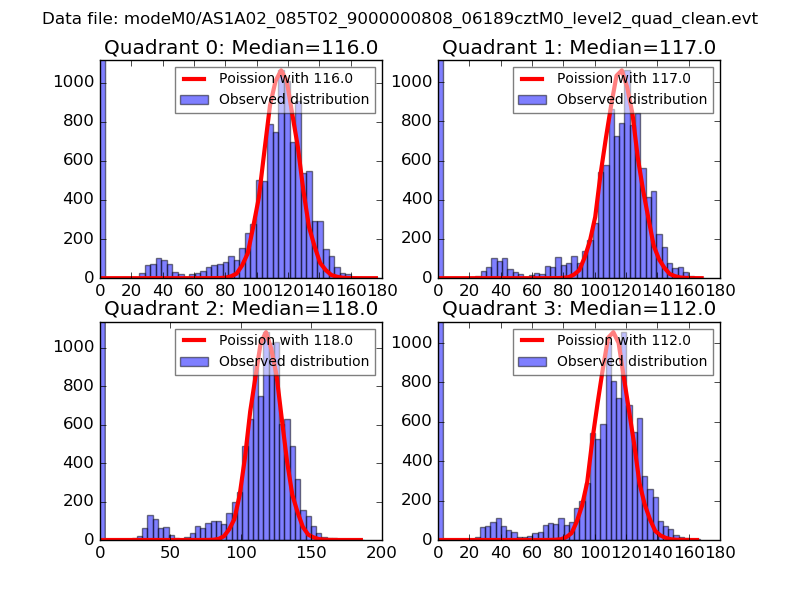 |
 |
| Quadrant-wise count rates Data is divided into 100 sec bins |
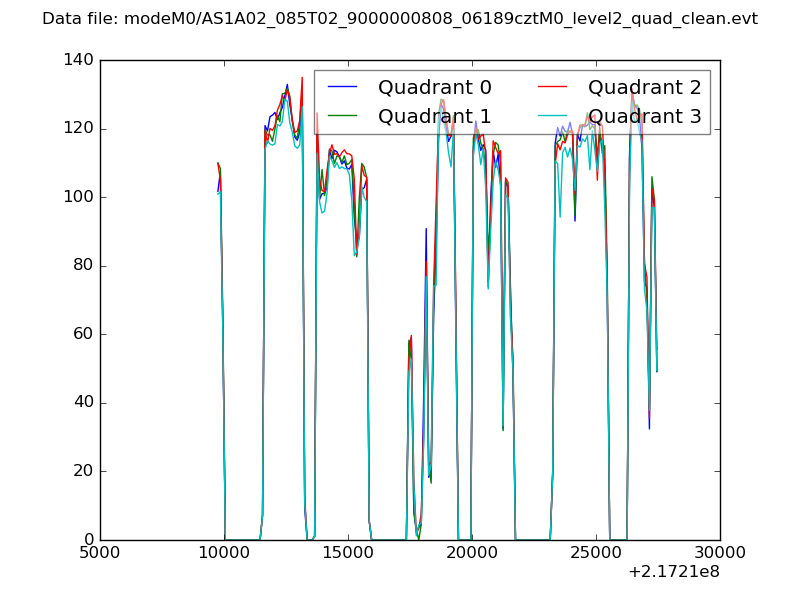 |
|
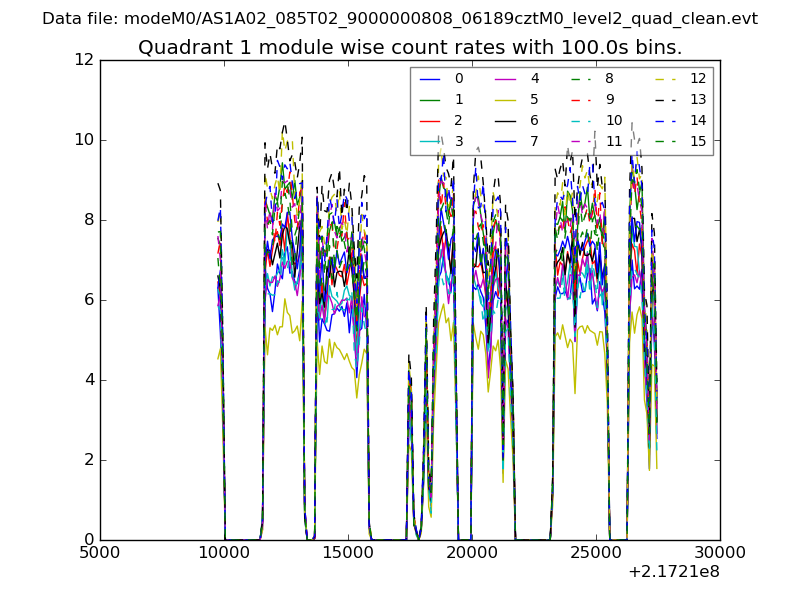
| Module-wise count rates for Quadrant A Data is divided into 100 sec bins |
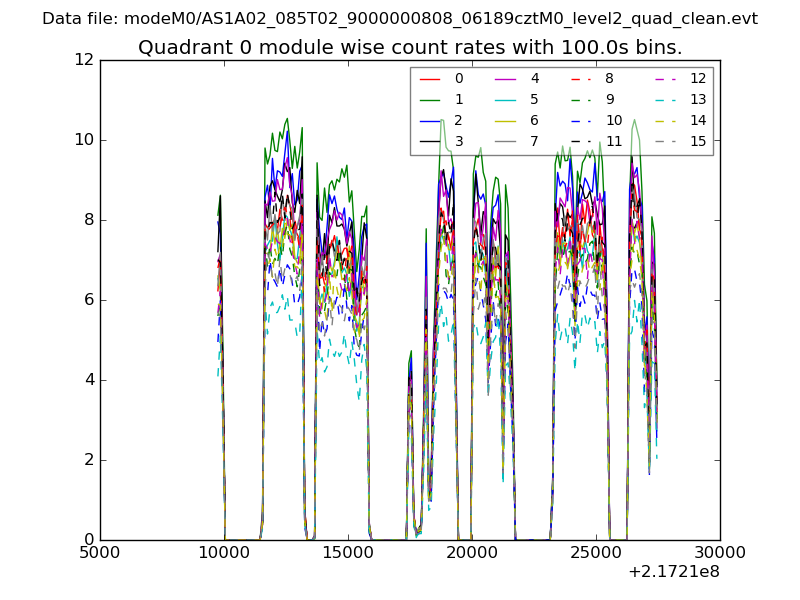 |
 |
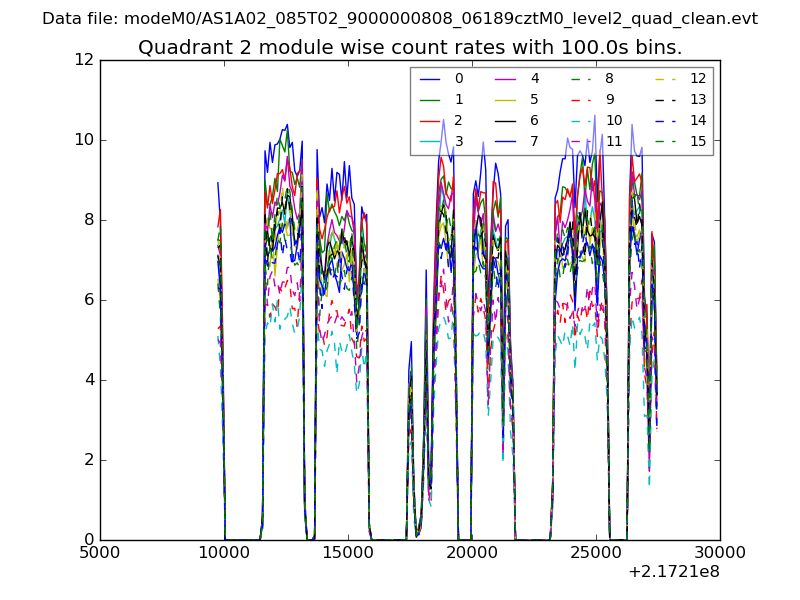
| Module-wise count rates for Quadrant B Data is divided into 100 sec bins |
 |
 |
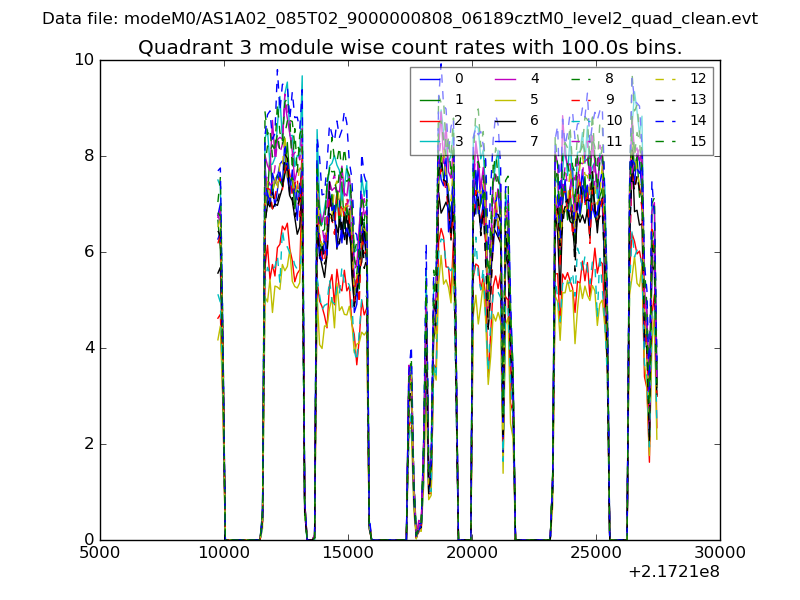
| Module-wise count rates for Quadrant C Data is divided into 100 sec bins |
 |
 |
| Module-wise count rates for Quadrant D Data is divided into 100 sec bins |
 |
 |
| Parameter | Plot |
|---|---|
| CZT HV Monitor | 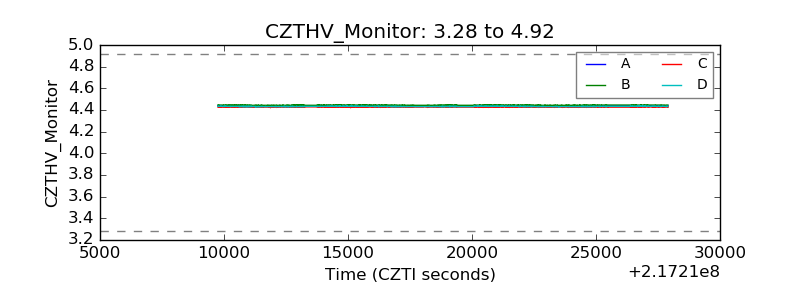 |
| D_VDD | 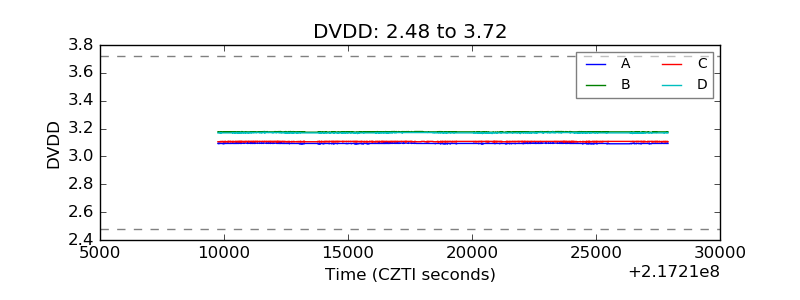 |
| Temperature 1 | 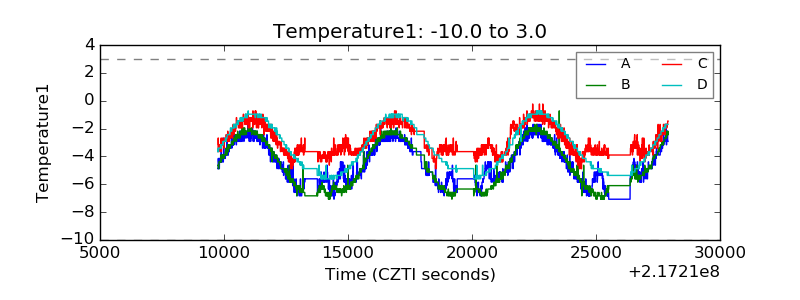 |
| Veto HV Monitor | 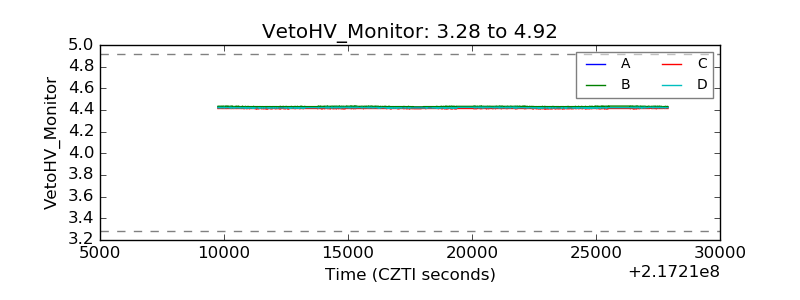 |
| Veto LLD | 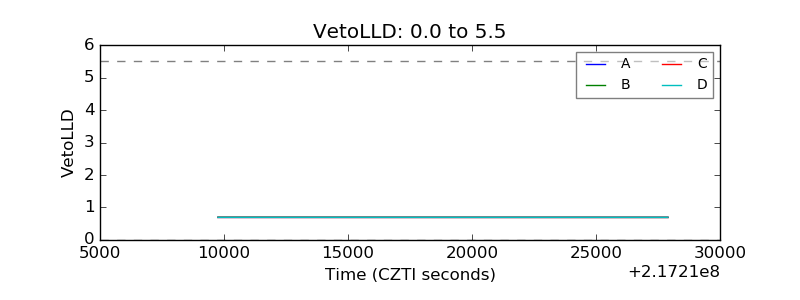 |
| Alpha Counter | 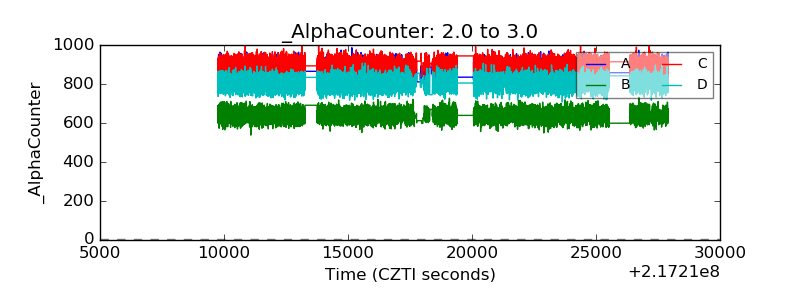 |
| _CPM_Rate | 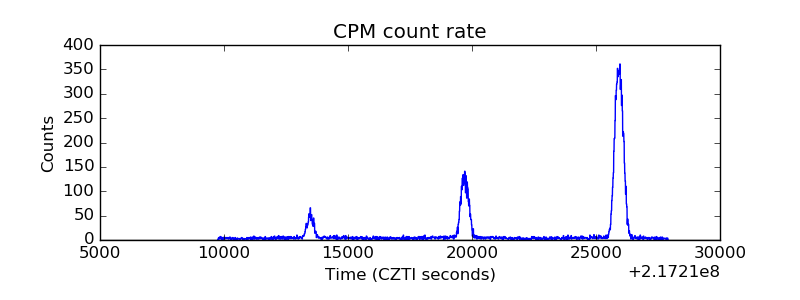 |
| CZT Counter | 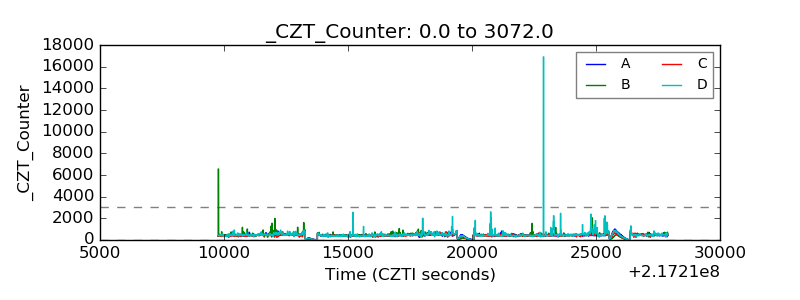 |
| +2.5 Volts monitor |  |
| +5 Volts monitor |  |
| _ROLL_ROT | 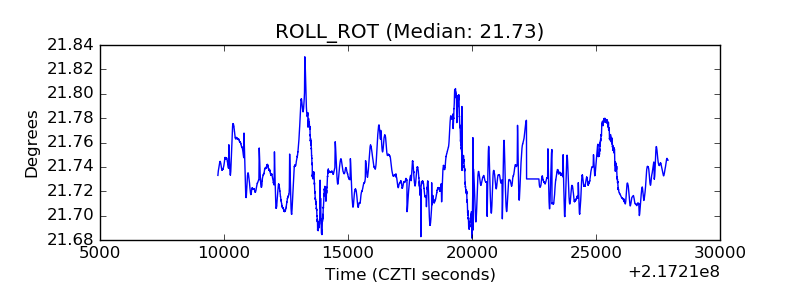 |
| _Roll_DEC | 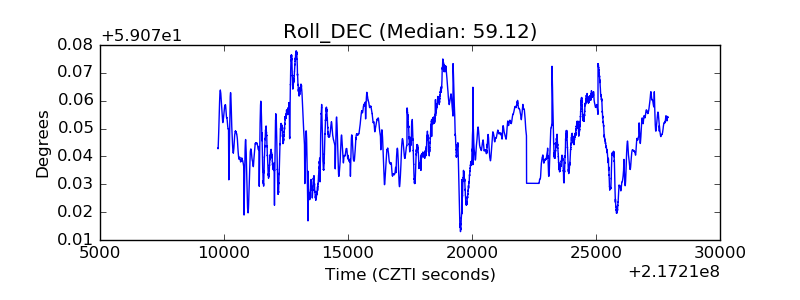 |
| _Roll_RA | 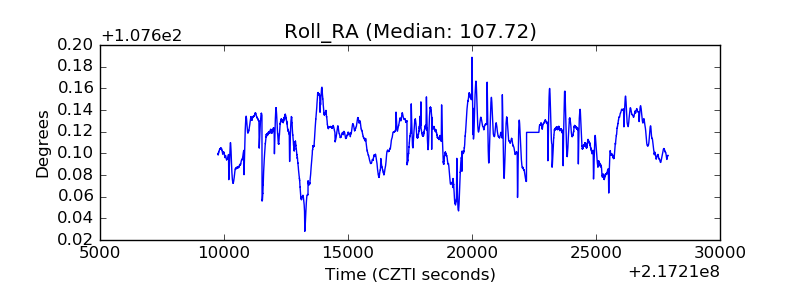 |
| Veto Counter | 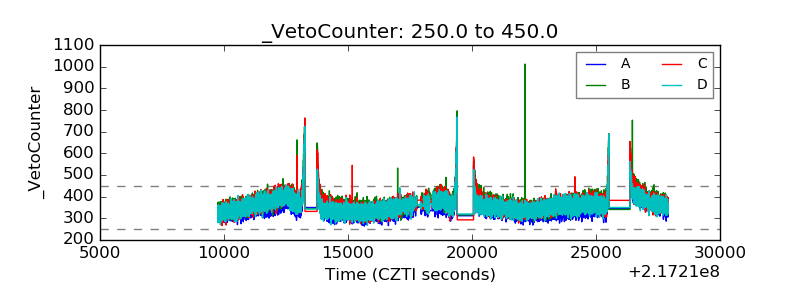 |