| Param | Original file | Final file |
|---|---|---|
| Filename | modeM0/AS1A02_085T02_9000000808_06192cztM0_level2.evt | modeM0/AS1A02_085T02_9000000808_06192cztM0_level2_quad_clean.evt |
| Size (bytes) | 473,855,040 | 78,143,040 |
| Size | 451.9 MB | 74.5 MB |
| Events in quadrant A | 3,153,136 | 484,072 |
| Events in quadrant B | 4,168,711 | 473,183 |
| Events in quadrant C | 3,117,852 | 482,823 |
| Events in quadrant D | 3,462,236 | 465,404 |
| Mode SS | |||
|---|---|---|---|
| Quadrant | BADHDUFLAG | Total packets | Discarded packets |
| A | 0 | 136 | 0 |
| B | 0 | 136 | 0 |
| C | 0 | 136 | 0 |
| D | 0 | 136 | 0 |
| Mode M9 | |||
|---|---|---|---|
| Quadrant | BADHDUFLAG | Total packets | Discarded packets |
| A | 0 | 14 | 0 |
| B | 0 | 14 | 0 |
| C | 0 | 14 | 0 |
| D | 0 | 15 | 0 |
| Mode M0 | |||
|---|---|---|---|
| Quadrant | BADHDUFLAG | Total packets | Discarded packets |
| A | 0 | 13656 | 3 |
| B | 0 | 16572 | 2 |
| C | 0 | 13601 | 2 |
| D | 0 | 14549 | 2 |
| Quadrant | Total seconds | Saturated seconds | Saturation percentage |
|---|---|---|---|
| A | 6601 | 63 | 0.954401% |
| B | 6601 | 277 | 4.196334% |
| C | 6601 | 51 | 0.772610% |
| D | 6601 | 65 | 0.984699% |
Noise dominated data is calculated using 1-second bins in cleaned event files. If a bin has >2000 counts, and if more than 50% of those come from <1% of pixels, then it is considered to be noise-dominated and hence unusable.
| Quadrant | # 1 sec bins | Bins with >0 counts | Bins with >2000 counts | High rate bins dominated by noise | Noise dominated (total time) | Noise dominated (detector-on time) | Marked lightcurve |
|---|---|---|---|---|---|---|---|
| A | 7726 | 6601 | 1 | 1 | 0.01% | 0.02% | 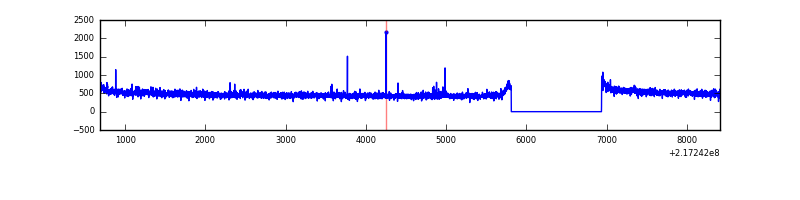 |
| B | 7726 | 6601 | 160 | 160 | 2.07% | 2.42% | 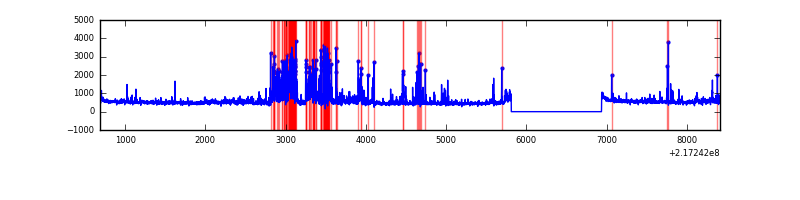 |
| C | 7726 | 6602 | 0 | 0 | 0.00% | 0.00% | 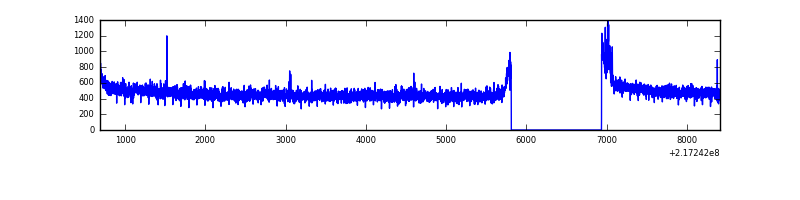 |
| D | 7726 | 6601 | 11 | 11 | 0.14% | 0.17% | 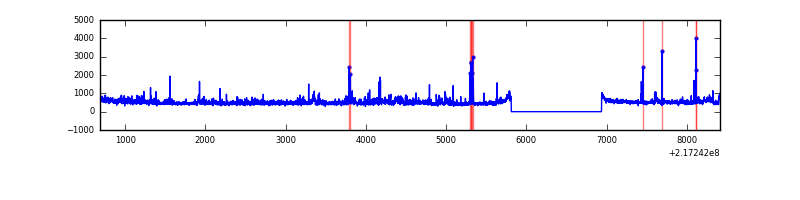 |
Top three noisy pixels from each quadrant. If the there are fewer than three noisy pixels in the level2.evt file, extra rows are filled as -1
| Pixel properties | Quadrant properties | ||||||
|---|---|---|---|---|---|---|---|
| Quadrant | DetID | PixID | Counts | Sigma | Mean | Median | Sigma |
| A | 8 | 15 | 48520 | 292.82 | 800 | 784 | 163.0 |
| A | 15 | 239 | 26026 | 154.84 | 800 | 784 | 163.0 |
| A | 0 | 226 | 7720 | 42.55 | 800 | 784 | 163.0 |
| B | 3 | 64 | 824833 | 5544.81 | 789 | 771 | 148.6 |
| B | 4 | 81 | 71750 | 477.59 | 789 | 771 | 148.6 |
| B | 0 | 214 | 67092 | 446.25 | 789 | 771 | 148.6 |
| C | 1 | 16 | 75432 | 421.34 | 769 | 773 | 177.2 |
| C | 7 | 159 | 31224 | 171.85 | 769 | 773 | 177.2 |
| C | 9 | 16 | 8382 | 42.94 | 769 | 773 | 177.2 |
| D | 2 | 63 | 127747 | 674.53 | 773 | 749 | 188.3 |
| D | 12 | 110 | 86798 | 457.04 | 773 | 749 | 188.3 |
| D | 5 | 97 | 85307 | 449.12 | 773 | 749 | 188.3 |
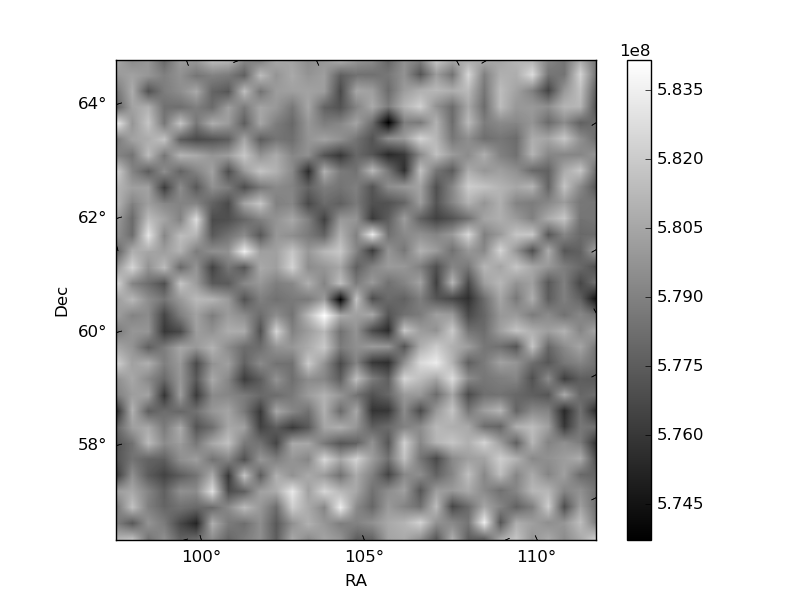
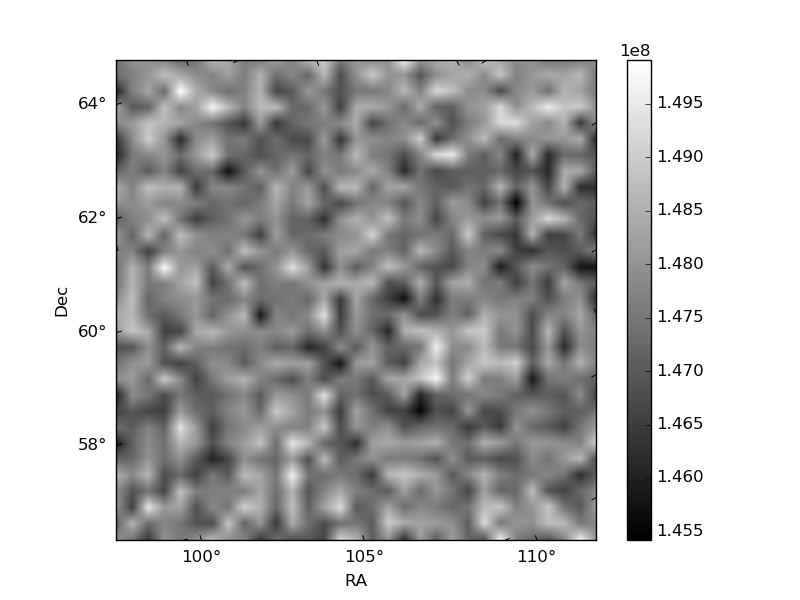
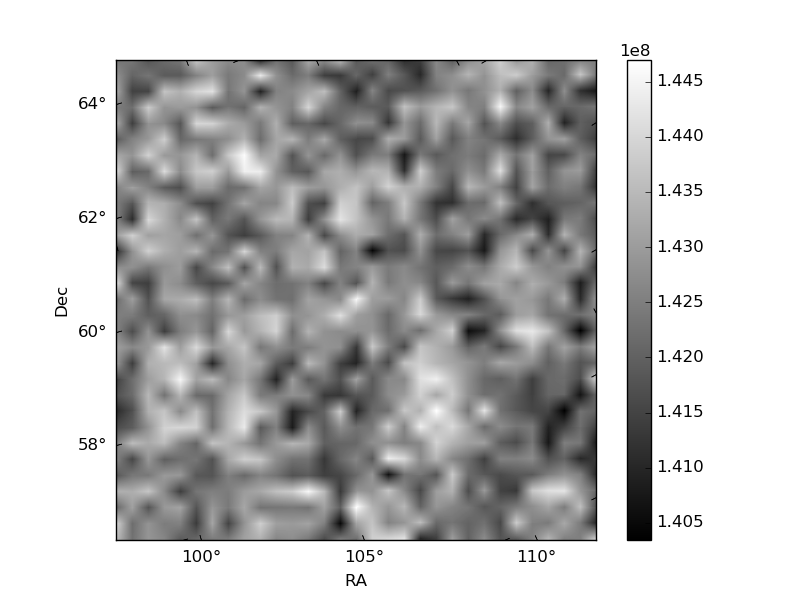
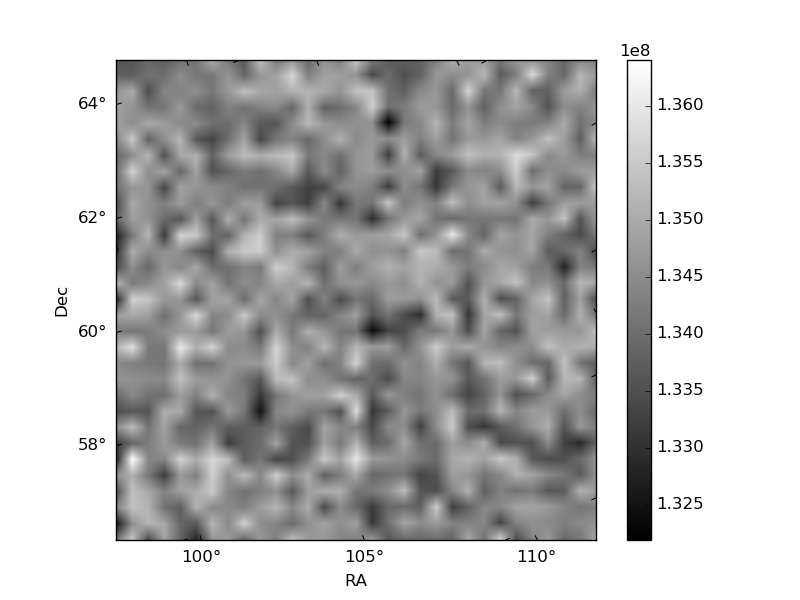
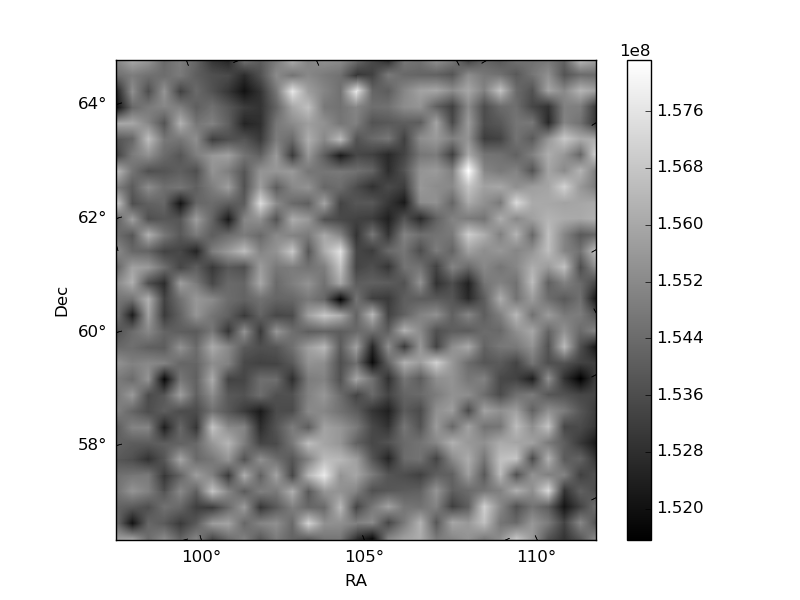
Histogram calculated using DETX and DETY for each event in the final _common_clean file
| Quadrant A | 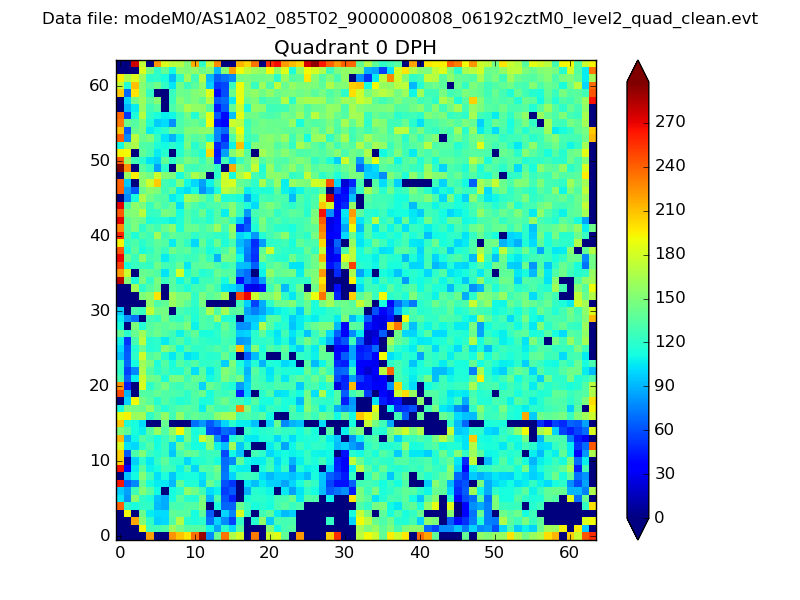 |
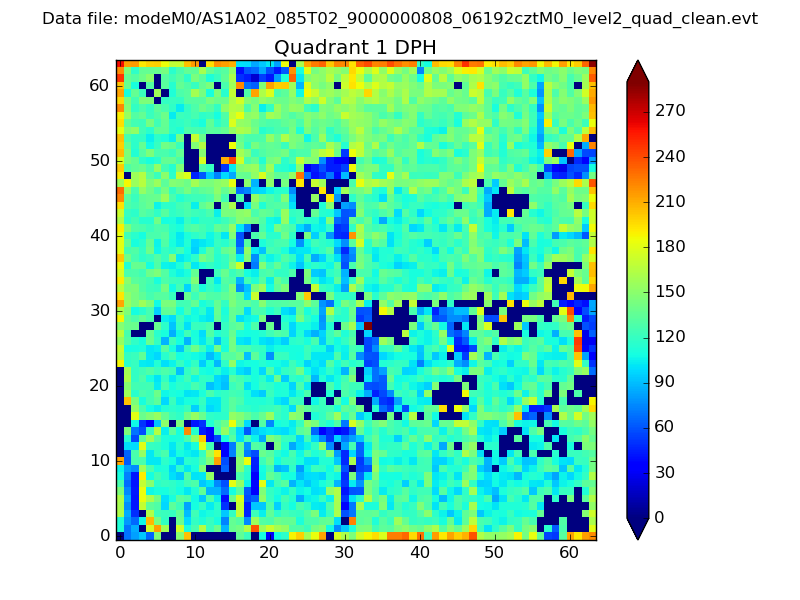 |
Quadrant B |
|---|---|---|---|
| Quadrant D | 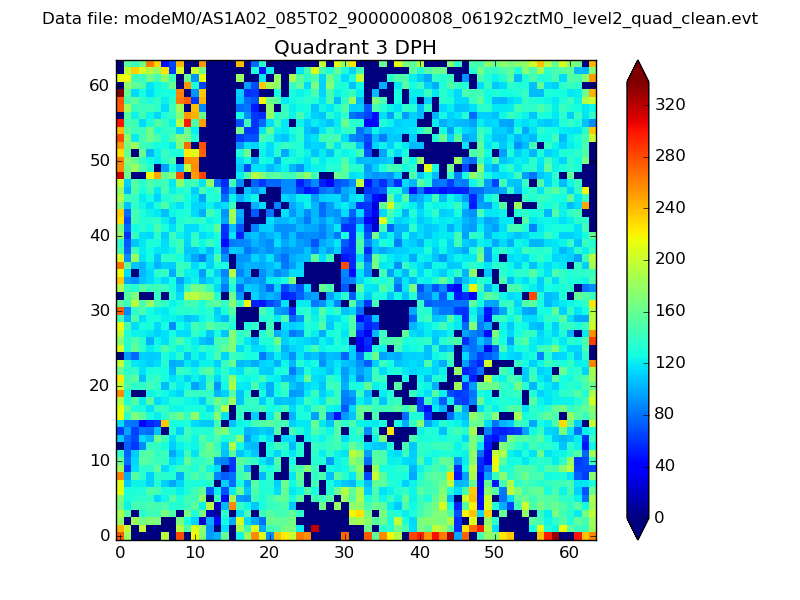 |
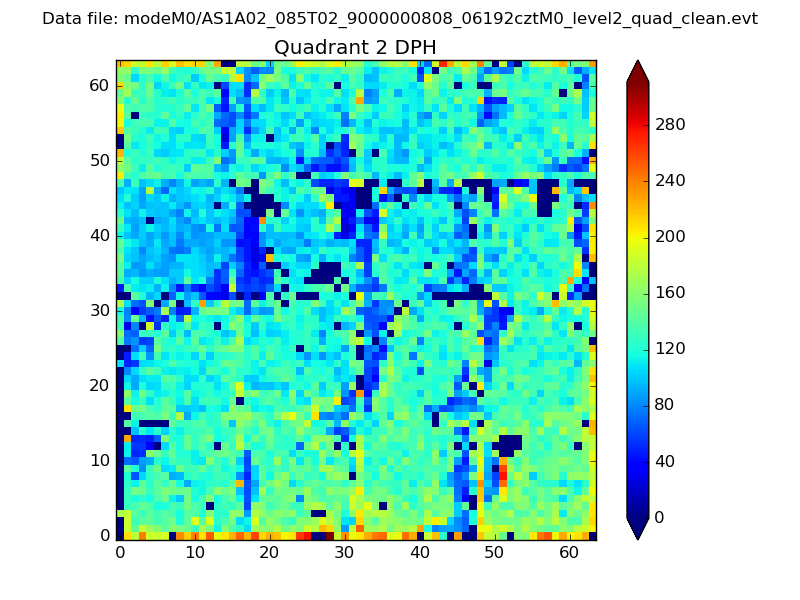 |
Quadrant C |
| Plot type | Count rate plots | Images |
|---|---|---|
| Comparison with Poisson distribution Blue bars denote a histogram of data divided into 1 sec bins. Red curve is a Poisson curve with rate = median count rate of data. |
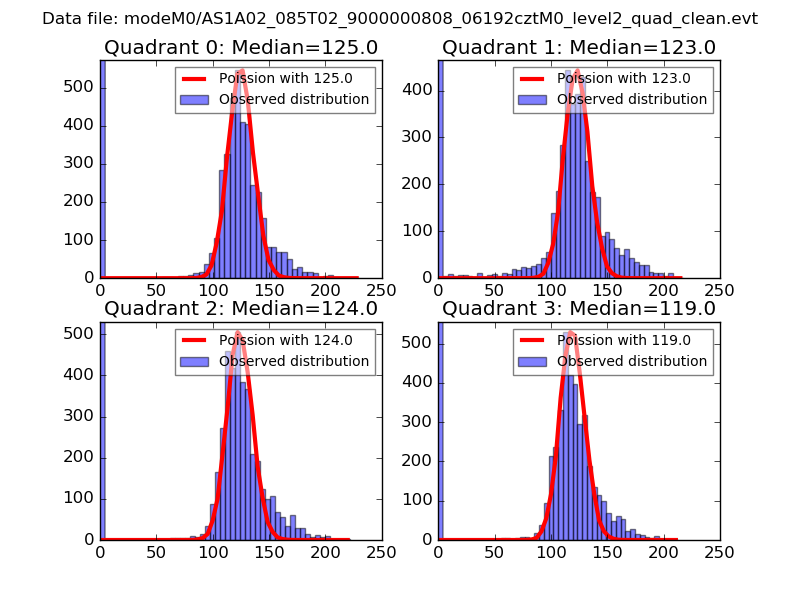 |
 |
| Quadrant-wise count rates Data is divided into 100 sec bins |
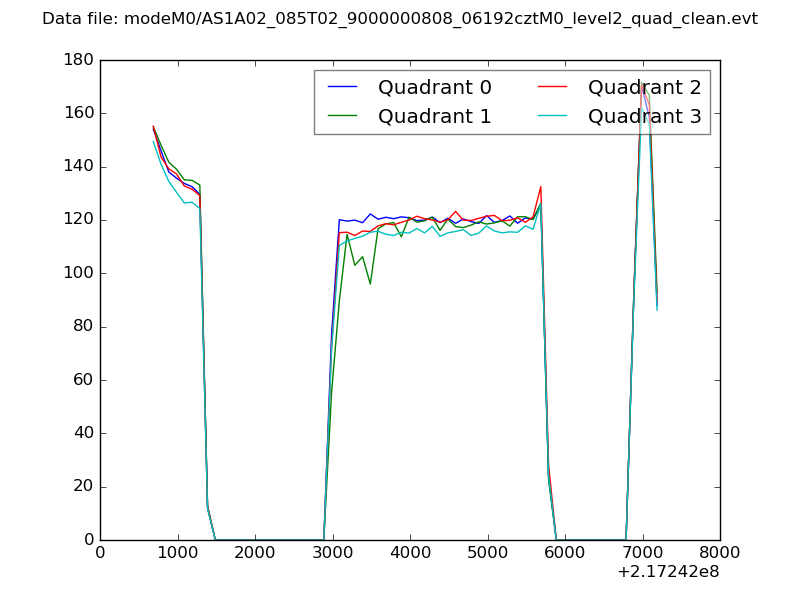 |
|
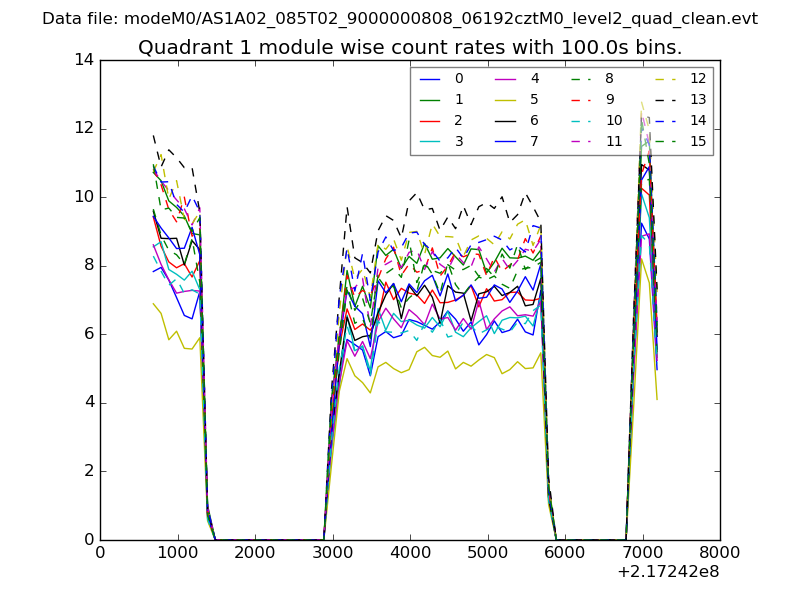
| Module-wise count rates for Quadrant A Data is divided into 100 sec bins |
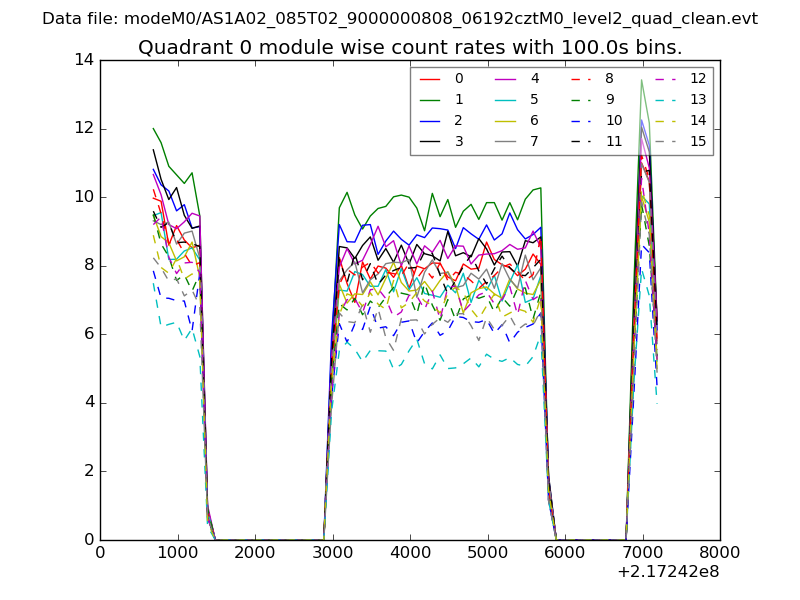 |
 |
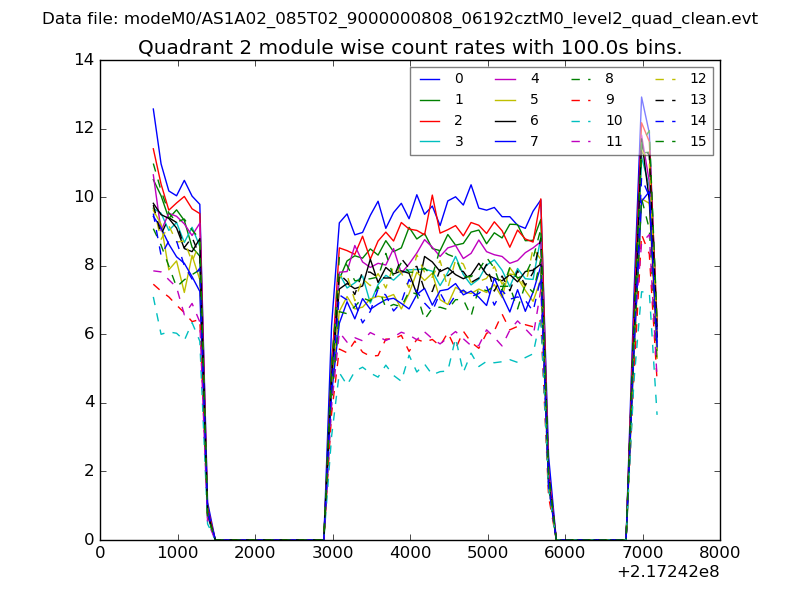
| Module-wise count rates for Quadrant B Data is divided into 100 sec bins |
 |
 |
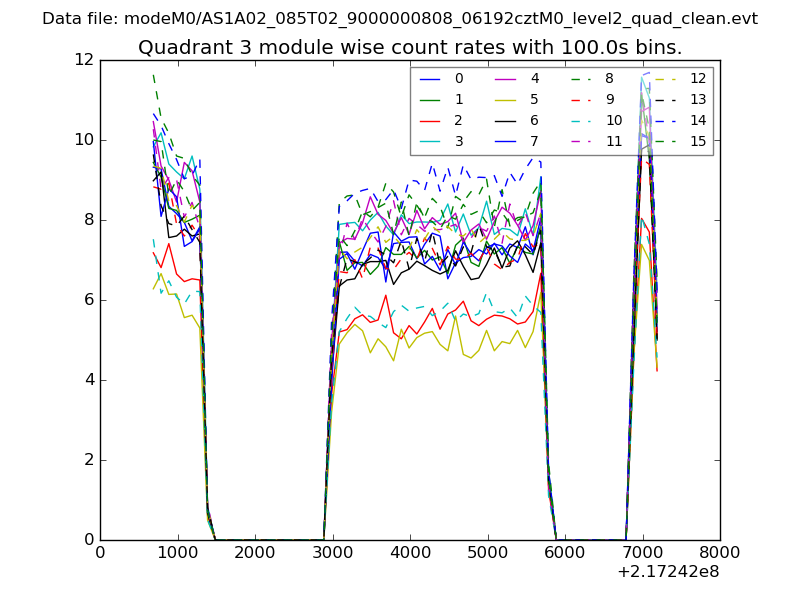
| Module-wise count rates for Quadrant C Data is divided into 100 sec bins |
 |
 |
| Module-wise count rates for Quadrant D Data is divided into 100 sec bins |
 |
 |
| Parameter | Plot |
|---|---|
| CZT HV Monitor | 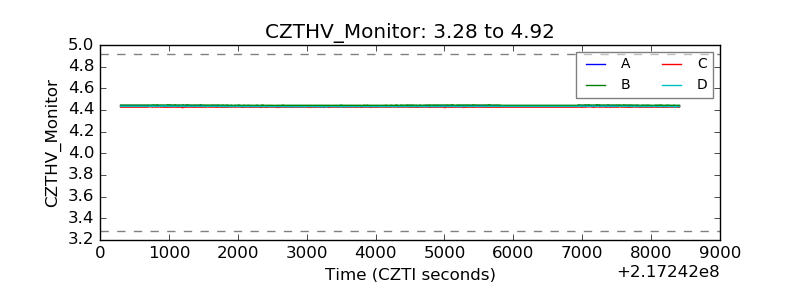 |
| D_VDD | 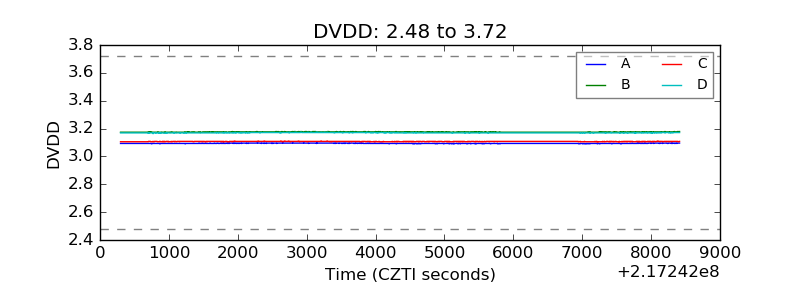 |
| Temperature 1 | 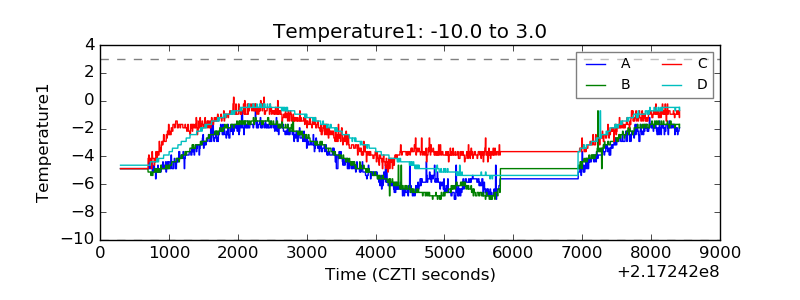 |
| Veto HV Monitor | 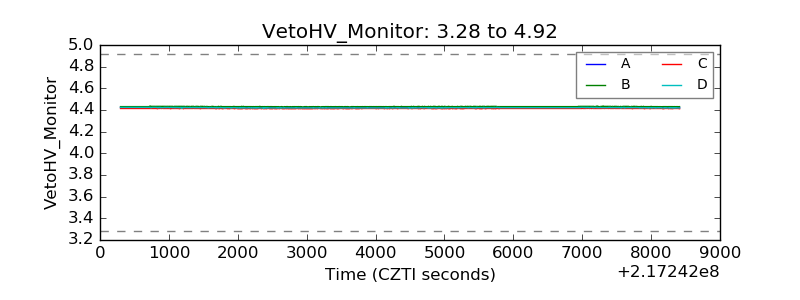 |
| Veto LLD | 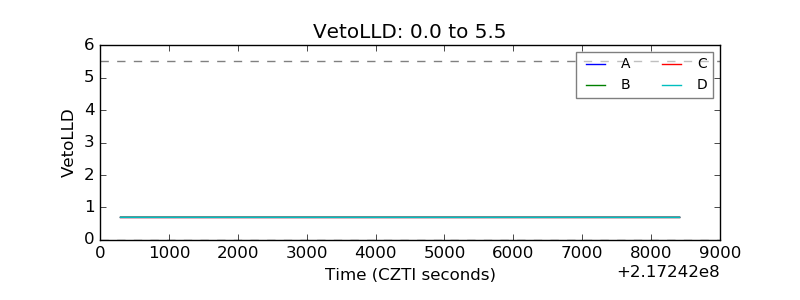 |
| Alpha Counter | 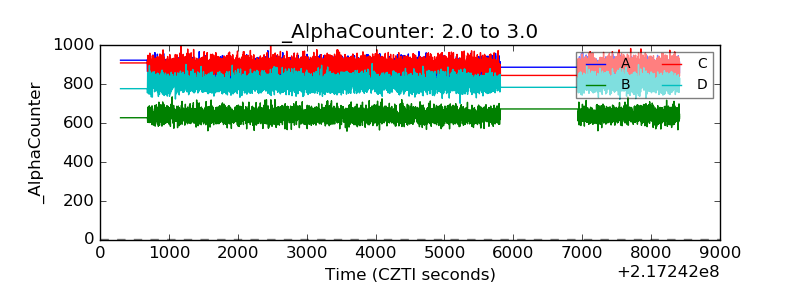 |
| _CPM_Rate |  |
| CZT Counter | 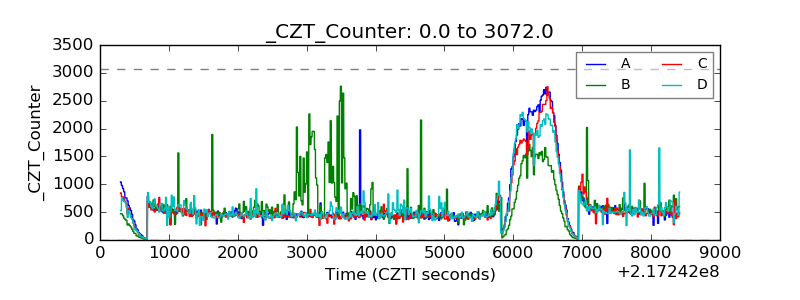 |
| +2.5 Volts monitor |  |
| +5 Volts monitor | 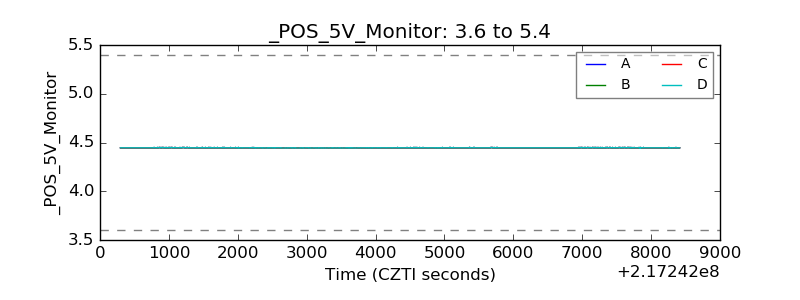 |
| _ROLL_ROT | 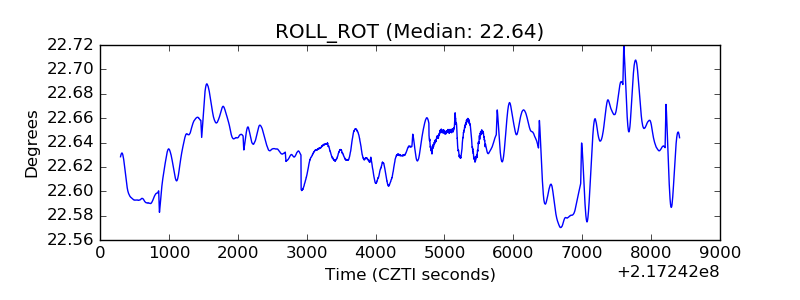 |
| _Roll_DEC | 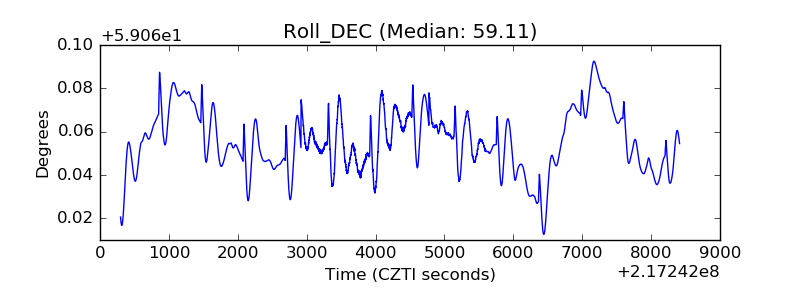 |
| _Roll_RA | 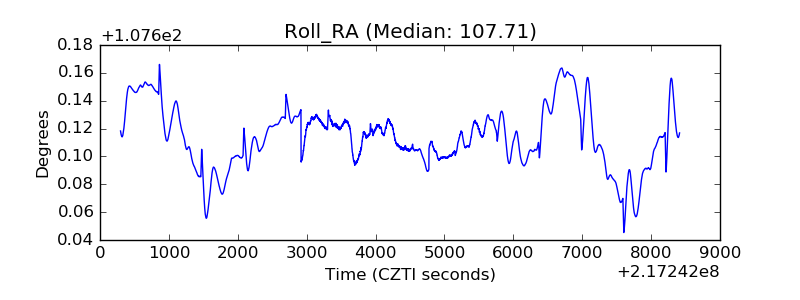 |
| Veto Counter | 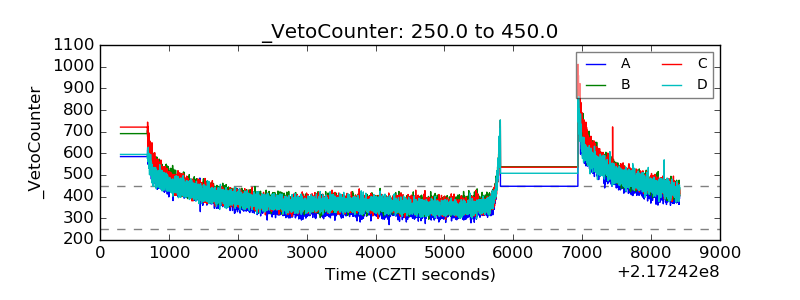 |