| Param | Original file | Final file |
|---|---|---|
| Filename | modeM0/AS1A02_085T02_9000000808_06193cztM0_level2.evt | modeM0/AS1A02_085T02_9000000808_06193cztM0_level2_quad_clean.evt |
| Size (bytes) | 497,332,800 | 71,884,800 |
| Size | 474.3 MB | 68.6 MB |
| Events in quadrant A | 3,275,280 | 435,800 |
| Events in quadrant B | 4,302,691 | 426,289 |
| Events in quadrant C | 3,194,832 | 435,161 |
| Events in quadrant D | 3,844,852 | 422,899 |
| Mode SS | |||
|---|---|---|---|
| Quadrant | BADHDUFLAG | Total packets | Discarded packets |
| A | 0 | 132 | 0 |
| B | 0 | 132 | 0 |
| C | 0 | 132 | 0 |
| D | 0 | 132 | 0 |
| Mode M9 | |||
|---|---|---|---|
| Quadrant | BADHDUFLAG | Total packets | Discarded packets |
| A | 0 | 16 | 0 |
| B | 0 | 16 | 0 |
| C | 0 | 16 | 0 |
| D | 0 | 17 | 0 |
| Mode M0 | |||
|---|---|---|---|
| Quadrant | BADHDUFLAG | Total packets | Discarded packets |
| A | 0 | 13901 | 3 |
| B | 0 | 17123 | 2 |
| C | 0 | 13783 | 2 |
| D | 0 | 15854 | 2 |
| Quadrant | Total seconds | Saturated seconds | Saturation percentage |
|---|---|---|---|
| A | 6546 | 92 | 1.405438% |
| B | 6546 | 319 | 4.873205% |
| C | 6546 | 78 | 1.191567% |
| D | 6546 | 96 | 1.466544% |
Noise dominated data is calculated using 1-second bins in cleaned event files. If a bin has >2000 counts, and if more than 50% of those come from <1% of pixels, then it is considered to be noise-dominated and hence unusable.
| Quadrant | # 1 sec bins | Bins with >0 counts | Bins with >2000 counts | High rate bins dominated by noise | Noise dominated (total time) | Noise dominated (detector-on time) | Marked lightcurve |
|---|---|---|---|---|---|---|---|
| A | 7766 | 6546 | 0 | 0 | 0.00% | 0.00% | 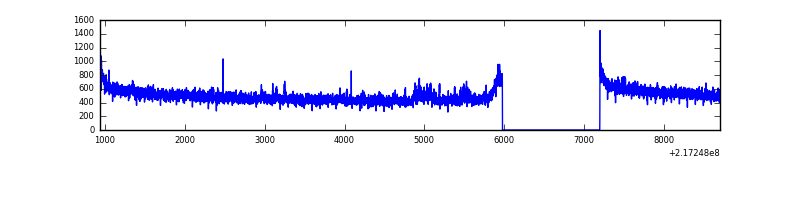 |
| B | 7766 | 6546 | 165 | 165 | 2.12% | 2.52% | 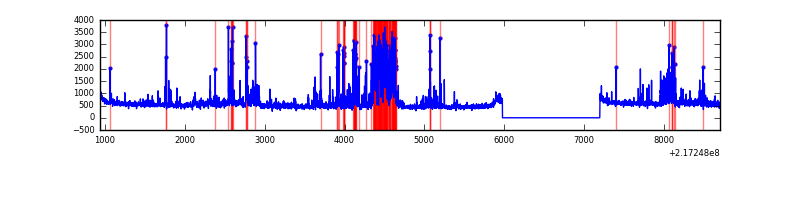 |
| C | 7766 | 6546 | 0 | 0 | 0.00% | 0.00% | 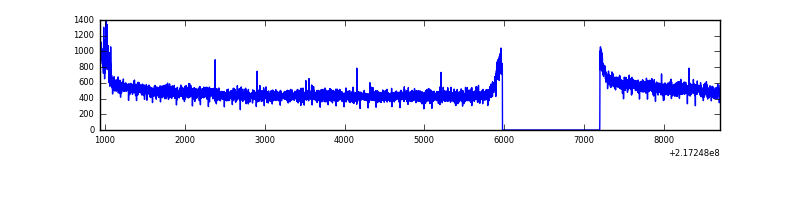 |
| D | 7766 | 6546 | 7 | 7 | 0.09% | 0.11% | 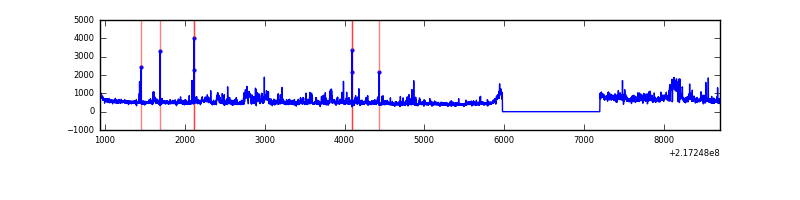 |
Top three noisy pixels from each quadrant. If the there are fewer than three noisy pixels in the level2.evt file, extra rows are filled as -1
| Pixel properties | Quadrant properties | ||||||
|---|---|---|---|---|---|---|---|
| Quadrant | DetID | PixID | Counts | Sigma | Mean | Median | Sigma |
| A | 15 | 236 | 43951 | 254.94 | 828 | 813 | 169.2 |
| A | 8 | 15 | 43210 | 250.56 | 828 | 813 | 169.2 |
| A | 0 | 226 | 7959 | 42.23 | 828 | 813 | 169.2 |
| B | 3 | 64 | 772415 | 5032.54 | 818 | 799 | 153.3 |
| B | 0 | 214 | 104845 | 678.6 | 818 | 799 | 153.3 |
| B | 4 | 81 | 88409 | 571.4 | 818 | 799 | 153.3 |
| C | 1 | 16 | 42191 | 226.71 | 799 | 802 | 182.6 |
| C | 7 | 159 | 31285 | 166.97 | 799 | 802 | 182.6 |
| C | 13 | 61 | 6408 | 30.71 | 799 | 802 | 182.6 |
| D | 2 | 63 | 534189 | 2726.39 | 803 | 777 | 195.6 |
| D | 2 | 136 | 63378 | 319.97 | 803 | 777 | 195.6 |
| D | 5 | 97 | 58118 | 293.08 | 803 | 777 | 195.6 |
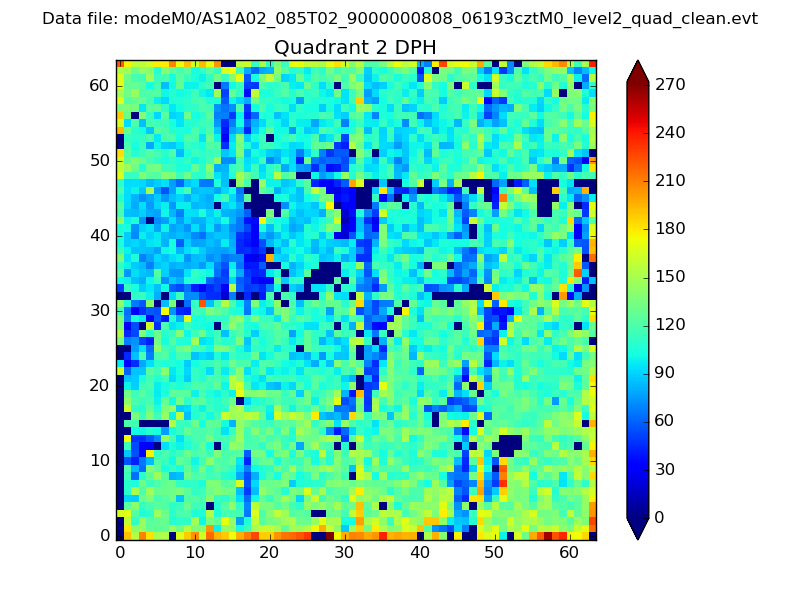
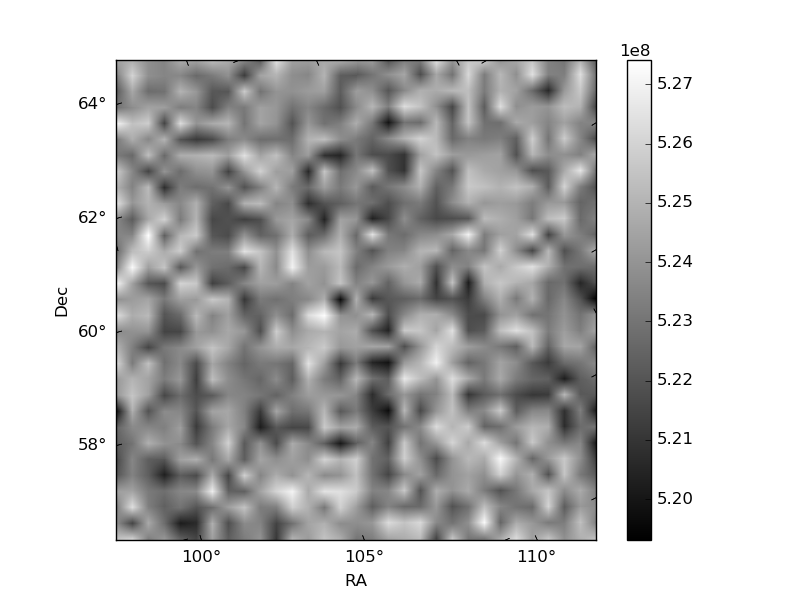
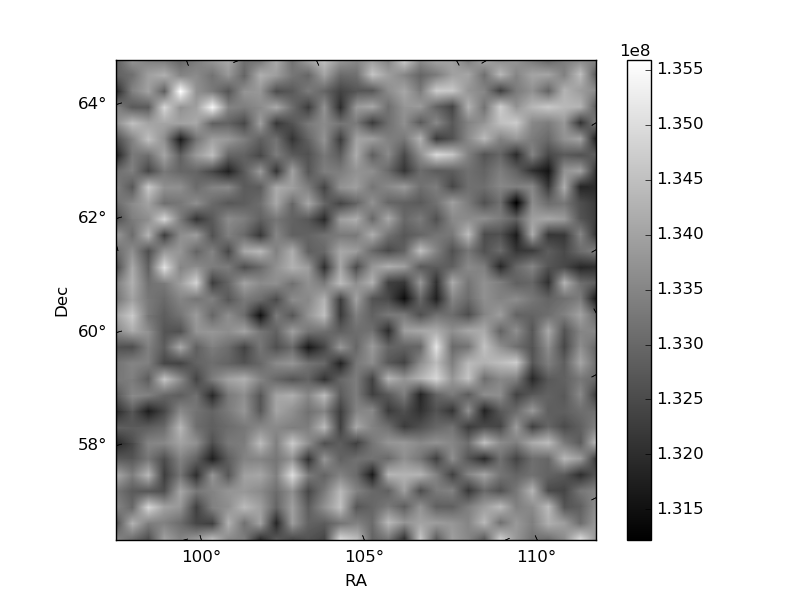
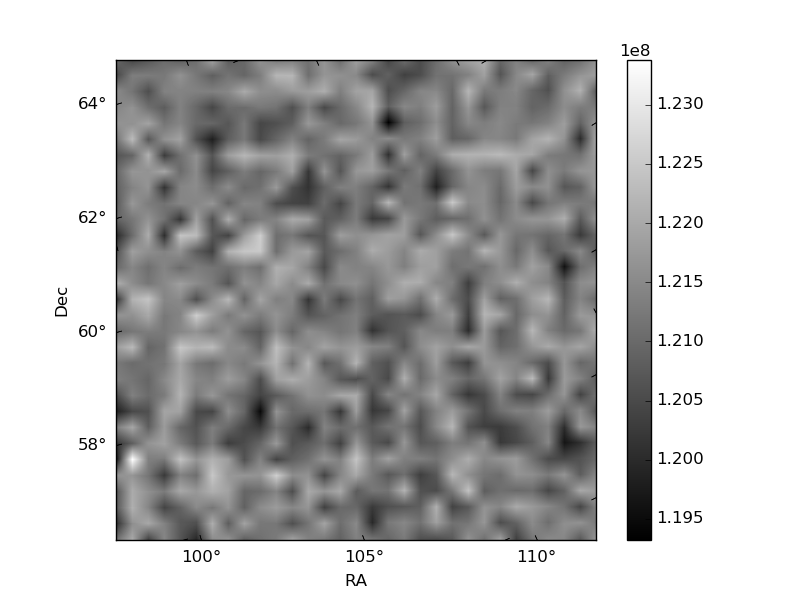
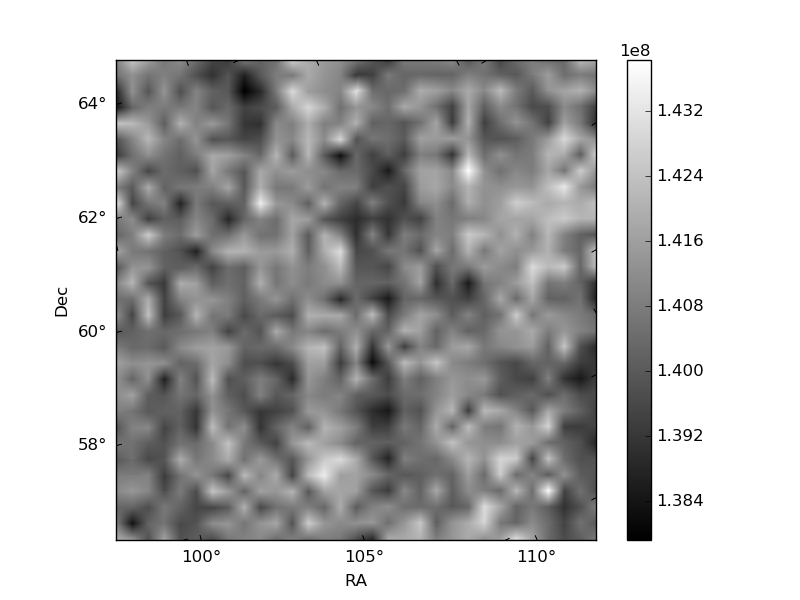
Histogram calculated using DETX and DETY for each event in the final _common_clean file
| Quadrant A | 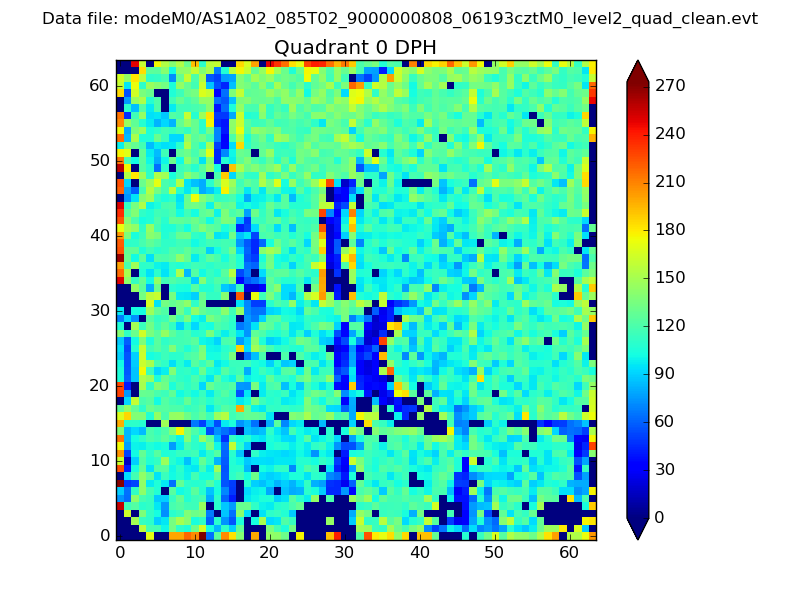 |
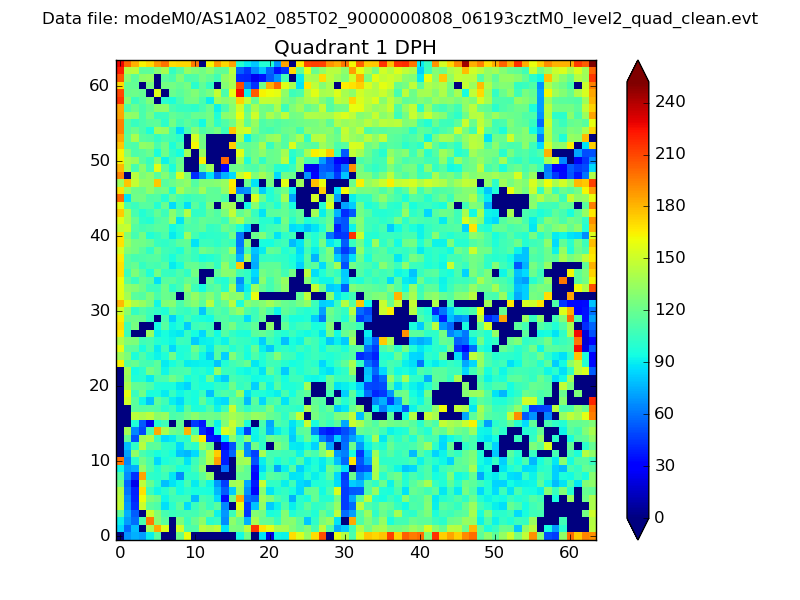 |
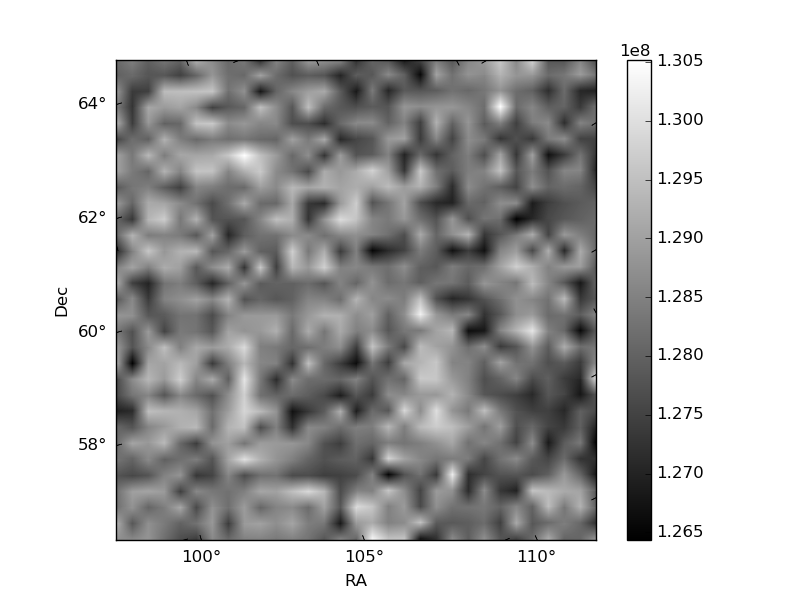
Quadrant B |
|---|---|---|---|
| Quadrant D | 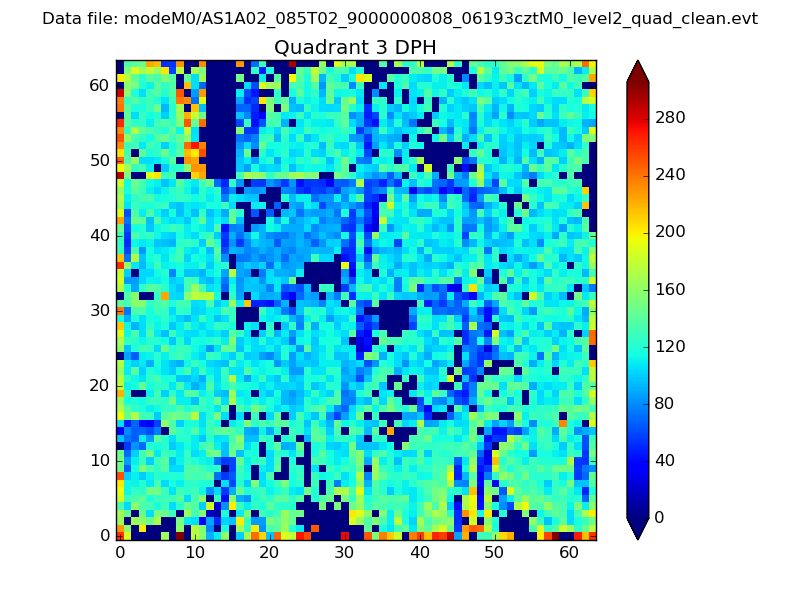 |
 |
Quadrant C |
| Plot type | Count rate plots | Images |
|---|---|---|
| Comparison with Poisson distribution Blue bars denote a histogram of data divided into 1 sec bins. Red curve is a Poisson curve with rate = median count rate of data. |
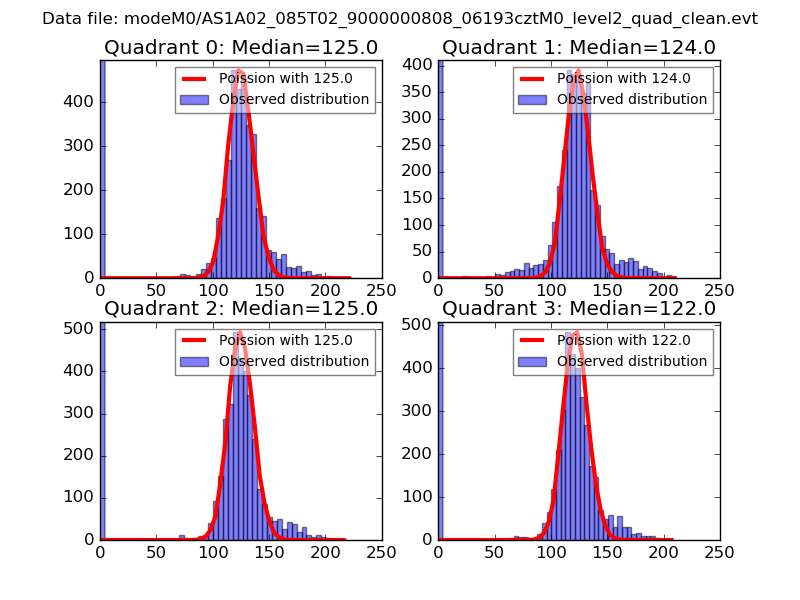 |
 |
| Quadrant-wise count rates Data is divided into 100 sec bins |
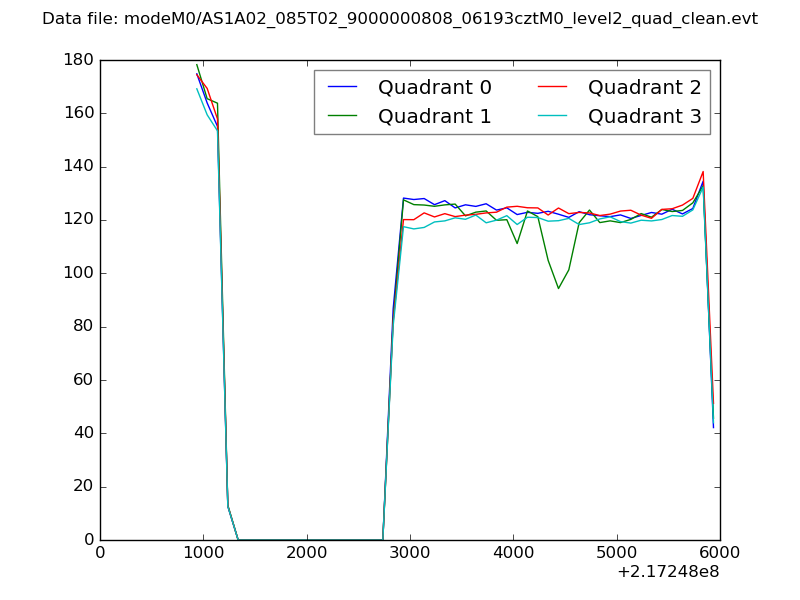 |
|
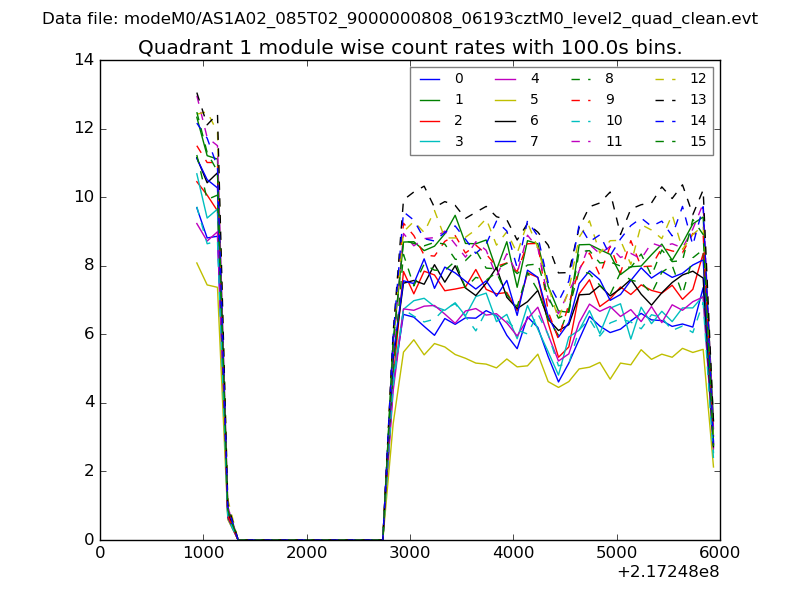
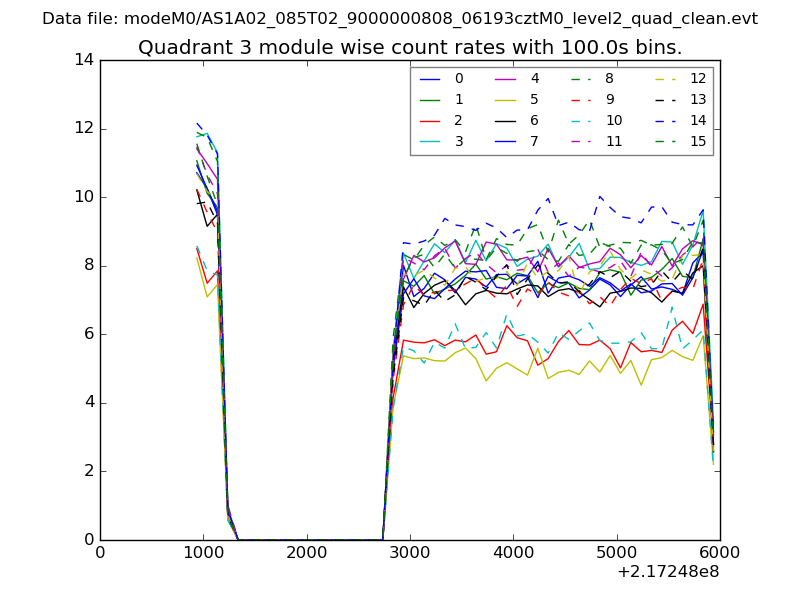
| Module-wise count rates for Quadrant A Data is divided into 100 sec bins |
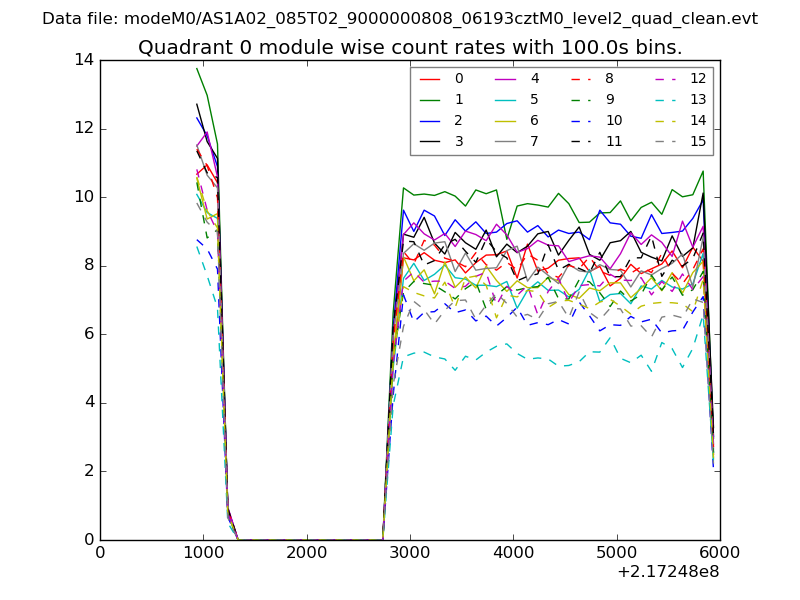 |
 |
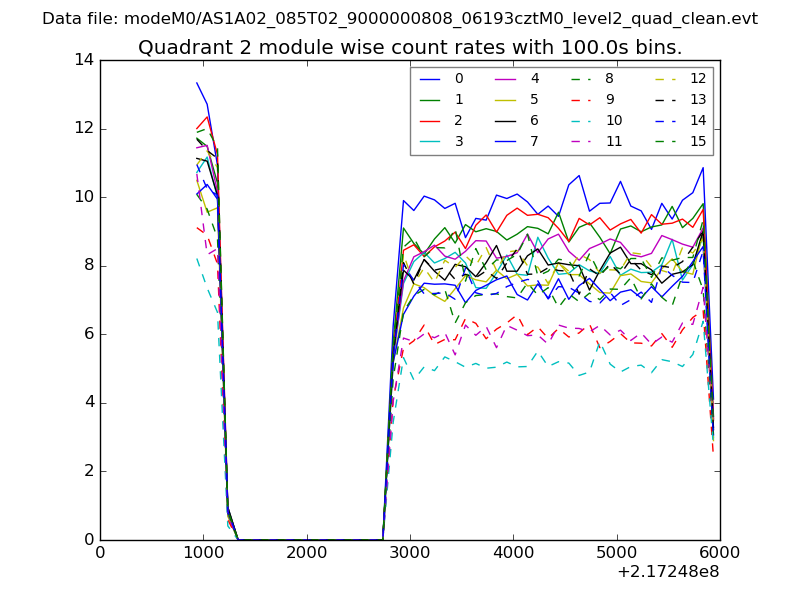
| Module-wise count rates for Quadrant B Data is divided into 100 sec bins |
 |
 |
| Module-wise count rates for Quadrant C Data is divided into 100 sec bins |
 |
 |
| Module-wise count rates for Quadrant D Data is divided into 100 sec bins |
 |
 |
| Parameter | Plot |
|---|---|
| CZT HV Monitor | 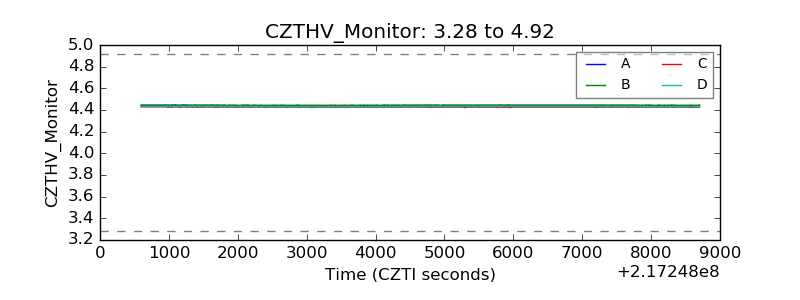 |
| D_VDD | 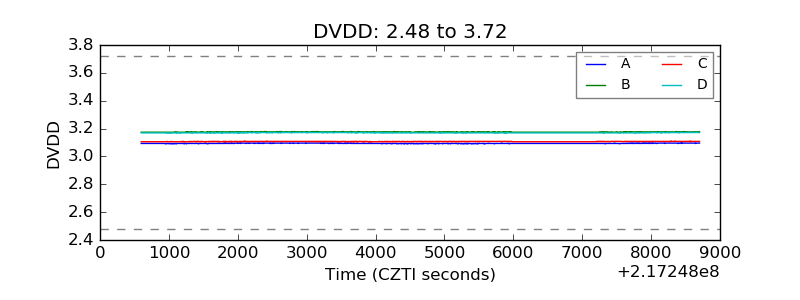 |
| Temperature 1 | 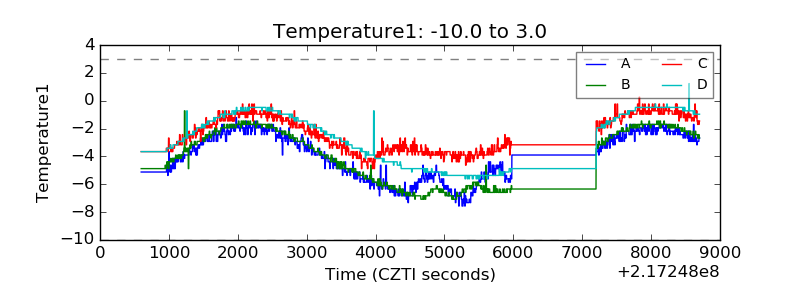 |
| Veto HV Monitor | 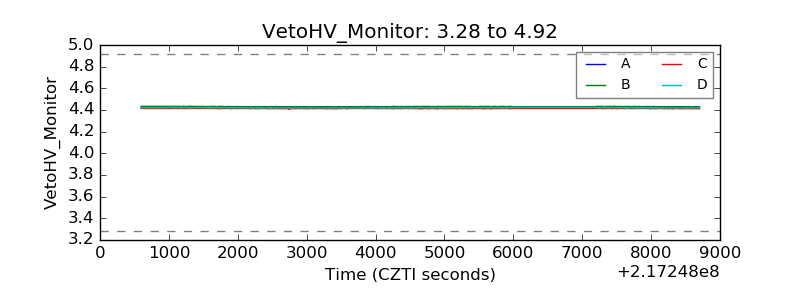 |
| Veto LLD | 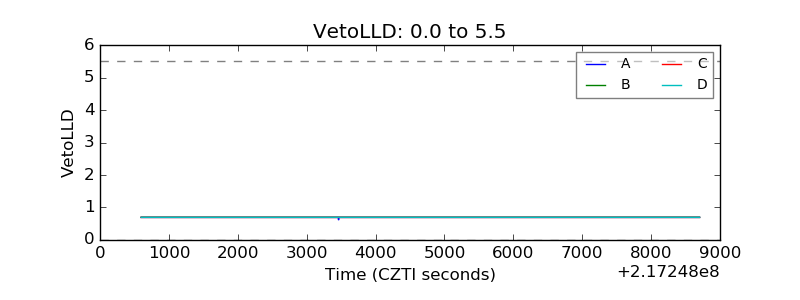 |
| Alpha Counter | 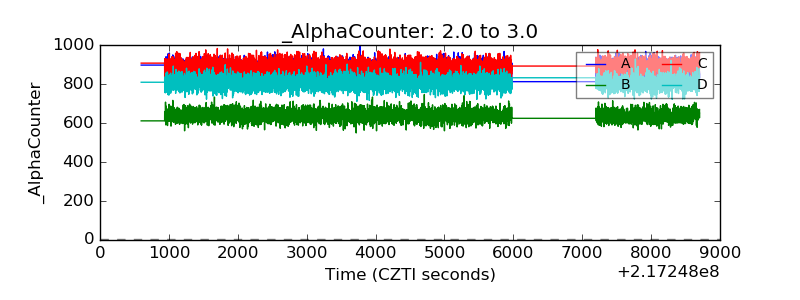 |
| _CPM_Rate | 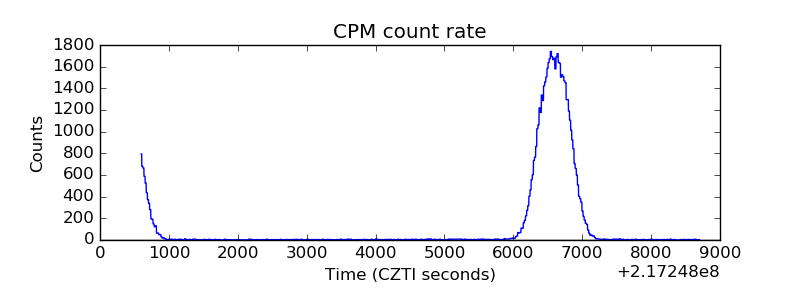 |
| CZT Counter | 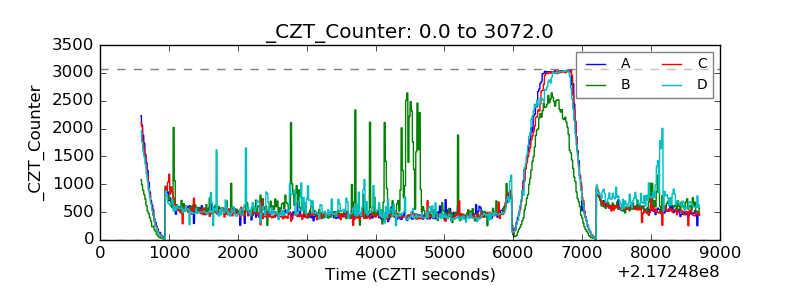 |
| +2.5 Volts monitor | 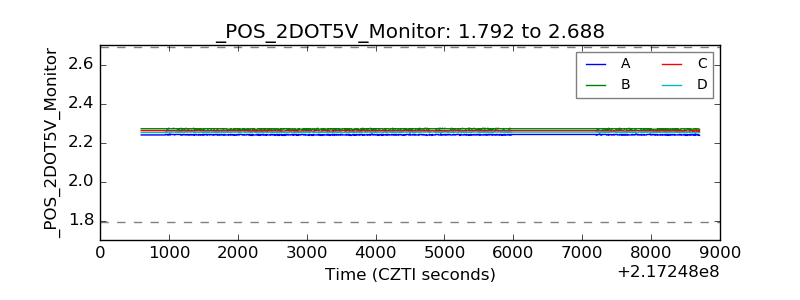 |
| +5 Volts monitor | 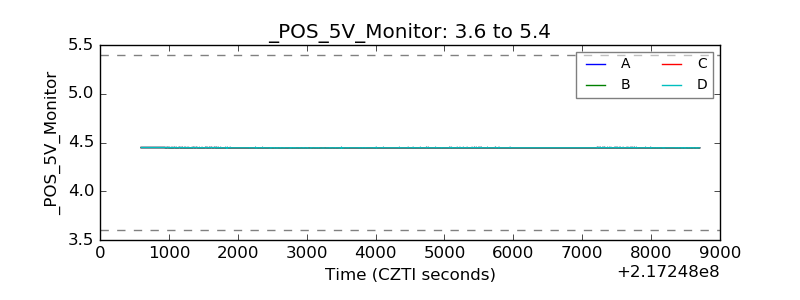 |
| _ROLL_ROT | 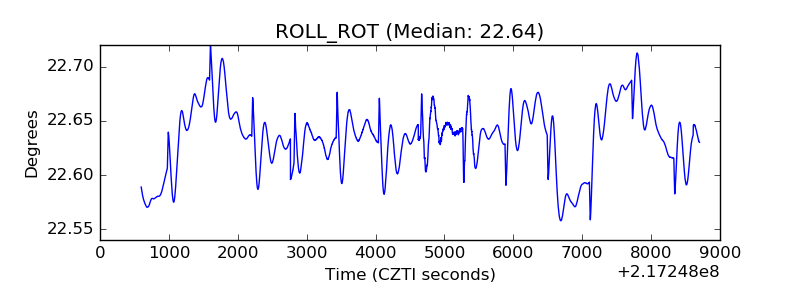 |
| _Roll_DEC | 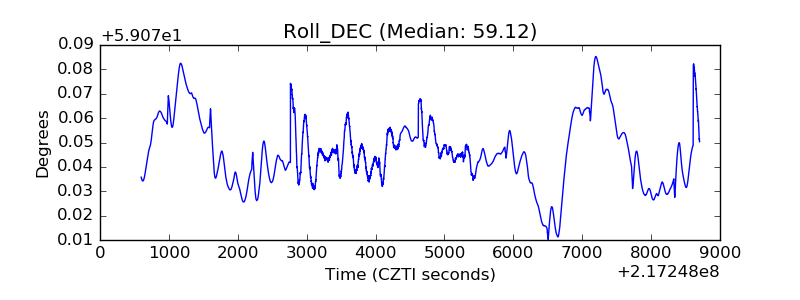 |
| _Roll_RA | 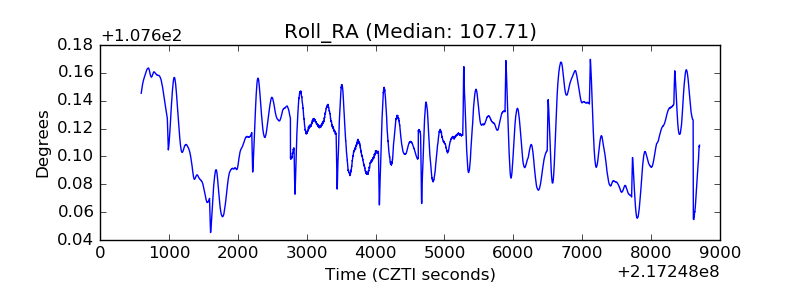 |
| Veto Counter | 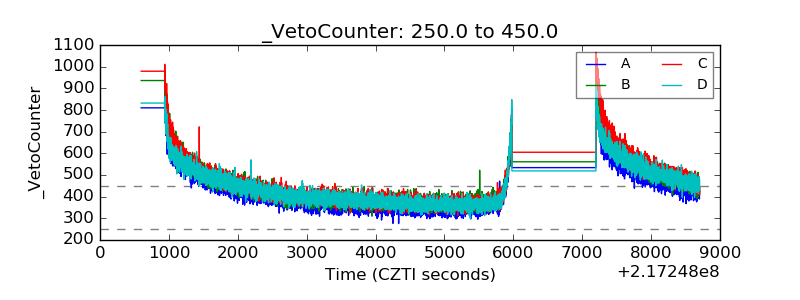 |