| Param | Original file | Final file |
|---|---|---|
| Filename | modeM0/AS1A02_085T02_9000000808_06194cztM0_level2.evt | modeM0/AS1A02_085T02_9000000808_06194cztM0_level2_quad_clean.evt |
| Size (bytes) | 481,098,240 | 78,128,640 |
| Size | 458.8 MB | 74.5 MB |
| Events in quadrant A | 3,253,636 | 486,631 |
| Events in quadrant B | 3,730,164 | 485,202 |
| Events in quadrant C | 3,157,765 | 485,164 |
| Events in quadrant D | 3,998,228 | 466,534 |
| Mode SS | |||
|---|---|---|---|
| Quadrant | BADHDUFLAG | Total packets | Discarded packets |
| A | 0 | 128 | 0 |
| B | 0 | 128 | 0 |
| C | 0 | 128 | 0 |
| D | 0 | 128 | 0 |
| Mode M9 | |||
|---|---|---|---|
| Quadrant | BADHDUFLAG | Total packets | Discarded packets |
| A | 0 | 15 | 0 |
| B | 0 | 15 | 0 |
| C | 0 | 15 | 0 |
| D | 0 | 16 | 0 |
| Mode M0 | |||
|---|---|---|---|
| Quadrant | BADHDUFLAG | Total packets | Discarded packets |
| A | 0 | 13909 | 3 |
| B | 0 | 15454 | 2 |
| C | 0 | 13461 | 2 |
| D | 0 | 16361 | 2 |
| Quadrant | Total seconds | Saturated seconds | Saturation percentage |
|---|---|---|---|
| A | 6341 | 93 | 1.466646% |
| B | 6341 | 162 | 2.554802% |
| C | 6341 | 80 | 1.261631% |
| D | 6341 | 118 | 1.860905% |
Noise dominated data is calculated using 1-second bins in cleaned event files. If a bin has >2000 counts, and if more than 50% of those come from <1% of pixels, then it is considered to be noise-dominated and hence unusable.
| Quadrant | # 1 sec bins | Bins with >0 counts | Bins with >2000 counts | High rate bins dominated by noise | Noise dominated (total time) | Noise dominated (detector-on time) | Marked lightcurve |
|---|---|---|---|---|---|---|---|
| A | 7636 | 6341 | 1 | 1 | 0.01% | 0.02% | 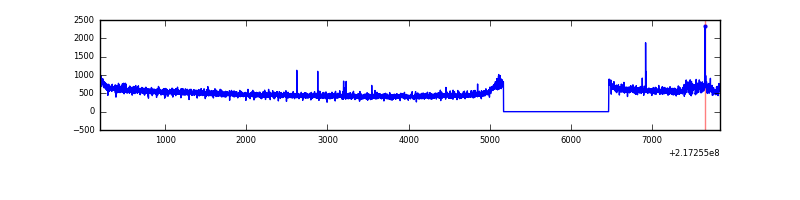 |
| B | 7636 | 6341 | 29 | 29 | 0.38% | 0.46% | 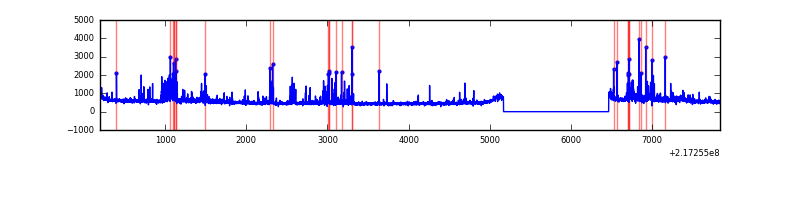 |
| C | 7636 | 6341 | 0 | 0 | 0.00% | 0.00% | 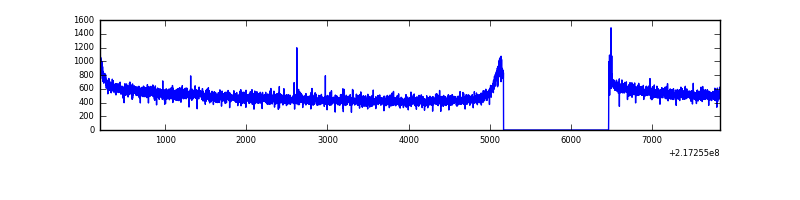 |
| D | 7636 | 6341 | 12 | 12 | 0.16% | 0.19% | 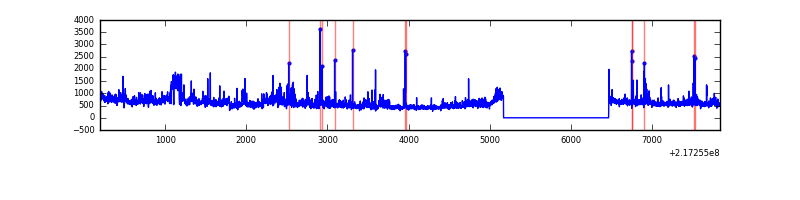 |
Top three noisy pixels from each quadrant. If the there are fewer than three noisy pixels in the level2.evt file, extra rows are filled as -1
| Pixel properties | Quadrant properties | ||||||
|---|---|---|---|---|---|---|---|
| Quadrant | DetID | PixID | Counts | Sigma | Mean | Median | Sigma |
| A | 14 | 111 | 55914 | 336.02 | 817 | 801 | 164.0 |
| A | 8 | 15 | 44398 | 265.81 | 817 | 801 | 164.0 |
| A | 0 | 226 | 8102 | 44.51 | 817 | 801 | 164.0 |
| B | 3 | 64 | 283680 | 1866.75 | 816 | 799 | 151.5 |
| B | 0 | 214 | 110084 | 721.18 | 816 | 799 | 151.5 |
| B | 0 | 219 | 42818 | 277.29 | 816 | 799 | 151.5 |
| C | 1 | 16 | 42944 | 234.38 | 796 | 800 | 179.8 |
| C | 9 | 16 | 6691 | 32.76 | 796 | 800 | 179.8 |
| C | 13 | 61 | 6438 | 31.36 | 796 | 800 | 179.8 |
| D | 2 | 63 | 648990 | 3339.07 | 798 | 769 | 194.1 |
| D | 12 | 110 | 101204 | 517.35 | 798 | 769 | 194.1 |
| D | 5 | 97 | 80281 | 409.58 | 798 | 769 | 194.1 |
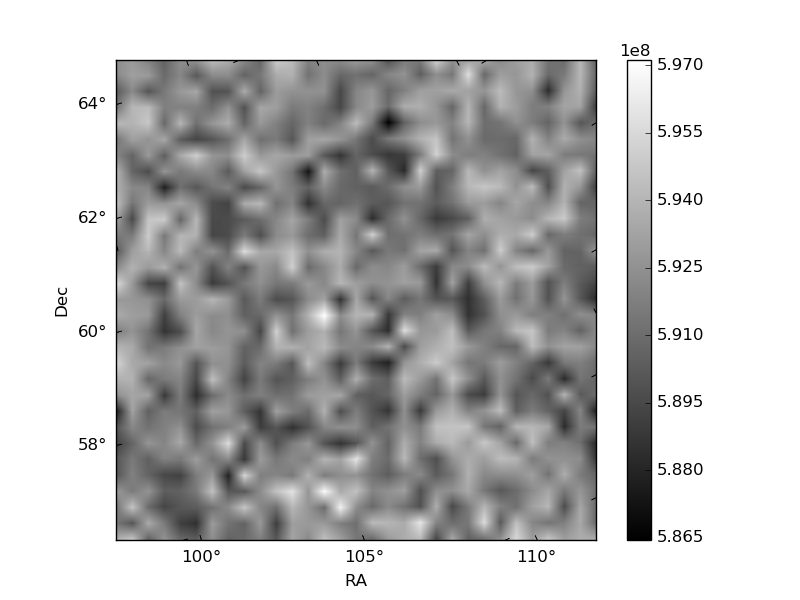
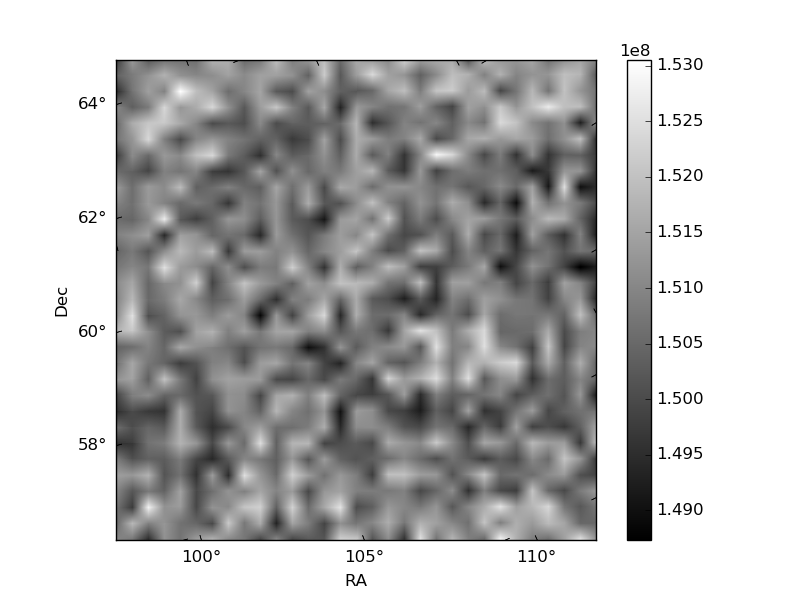
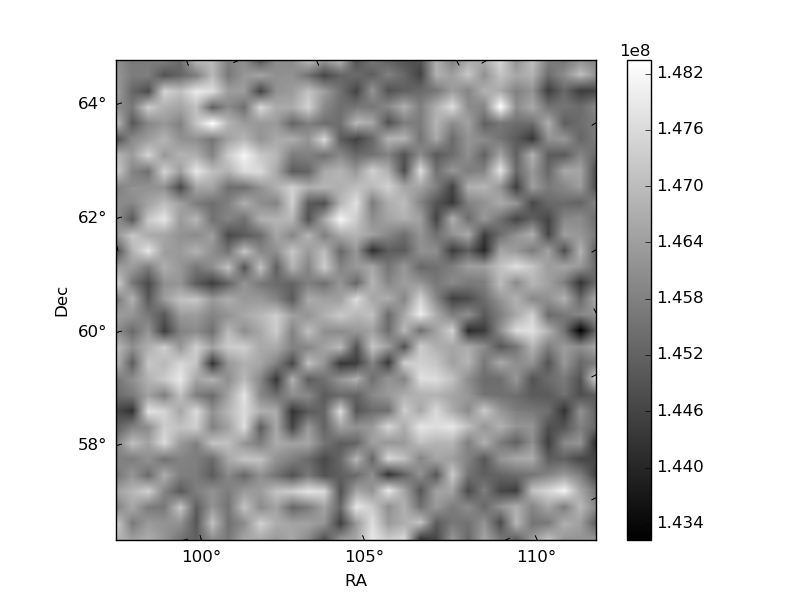
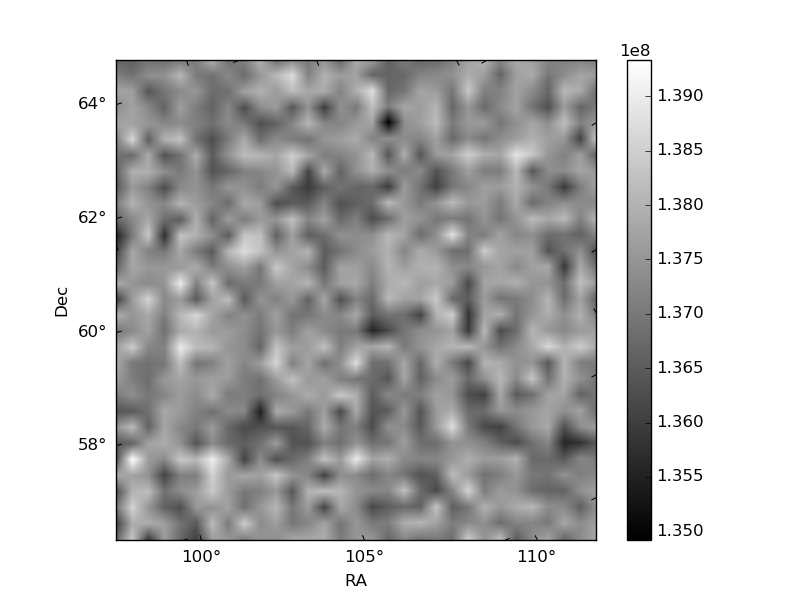
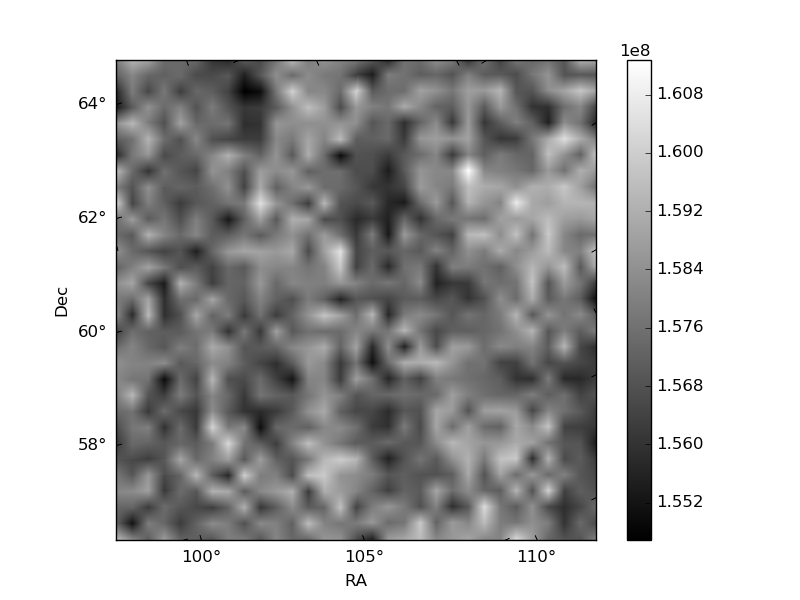
Histogram calculated using DETX and DETY for each event in the final _common_clean file
| Quadrant A | 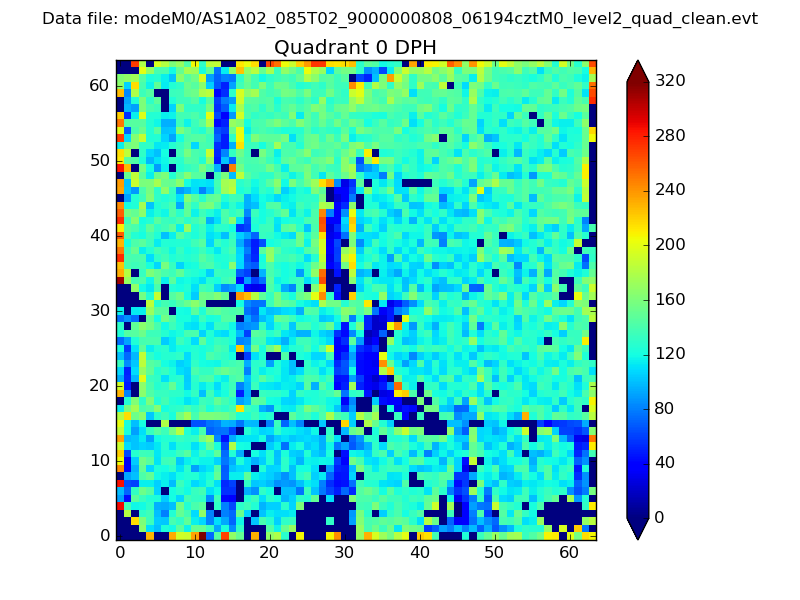 |
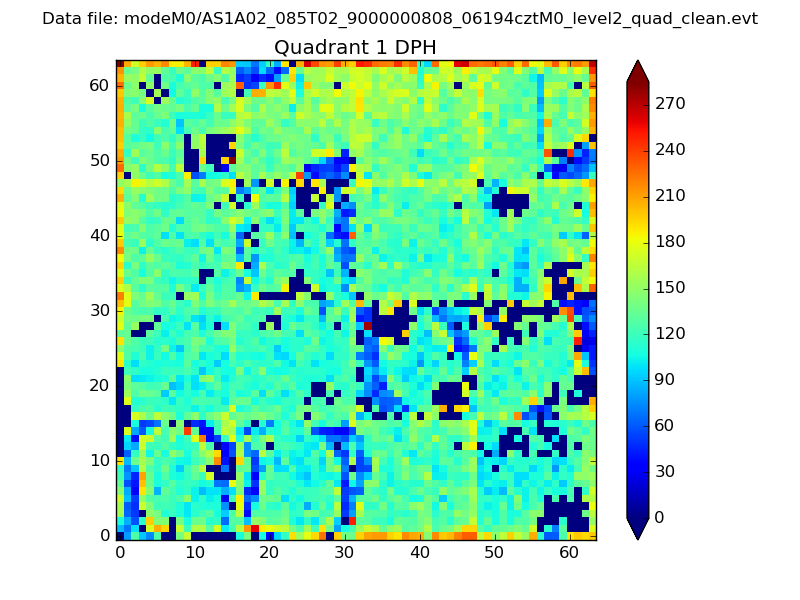 |
Quadrant B |
|---|---|---|---|
| Quadrant D | 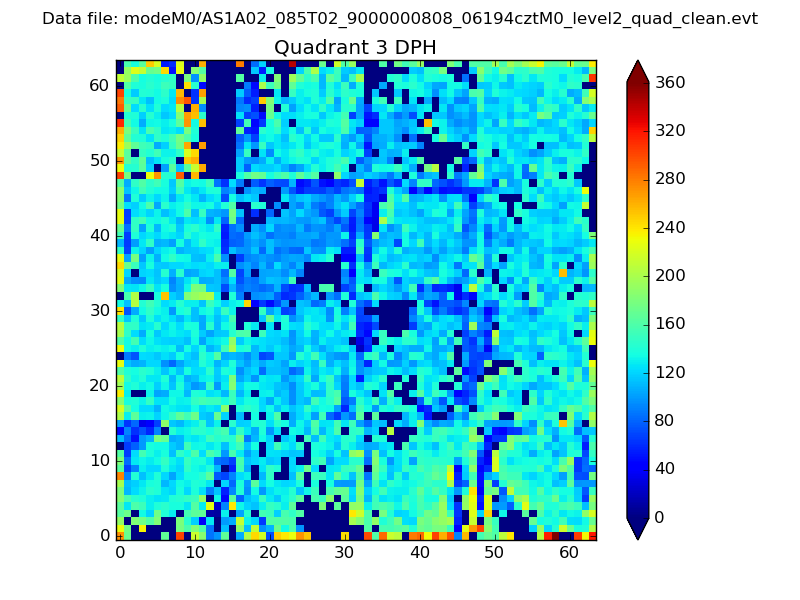 |
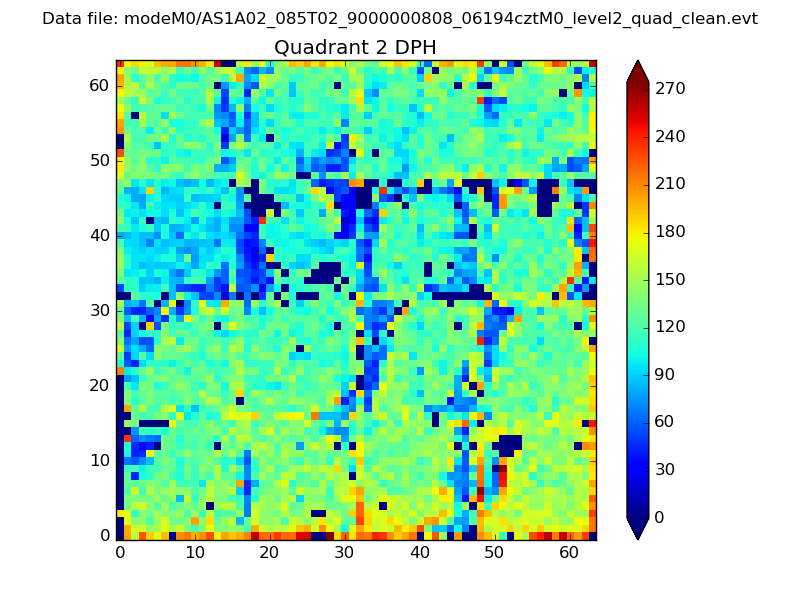 |
Quadrant C |
| Plot type | Count rate plots | Images |
|---|---|---|
| Comparison with Poisson distribution Blue bars denote a histogram of data divided into 1 sec bins. Red curve is a Poisson curve with rate = median count rate of data. |
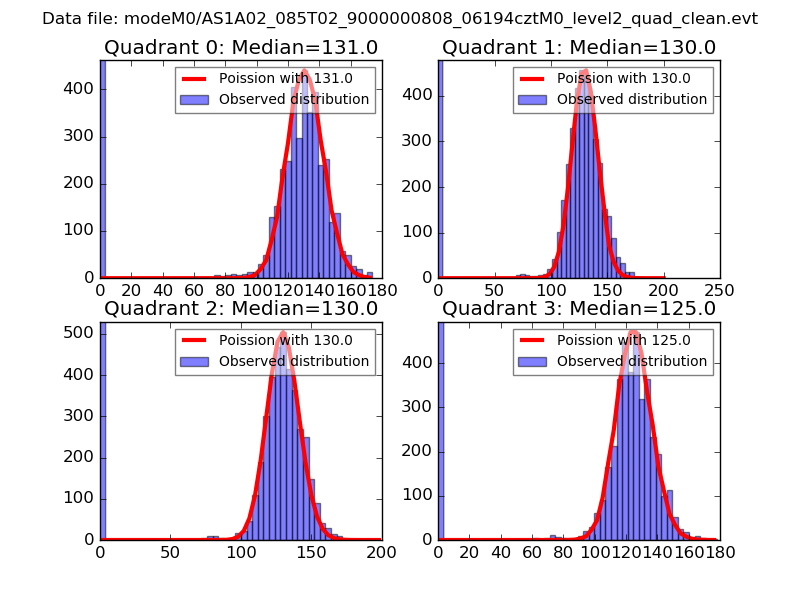 |
 |
| Quadrant-wise count rates Data is divided into 100 sec bins |
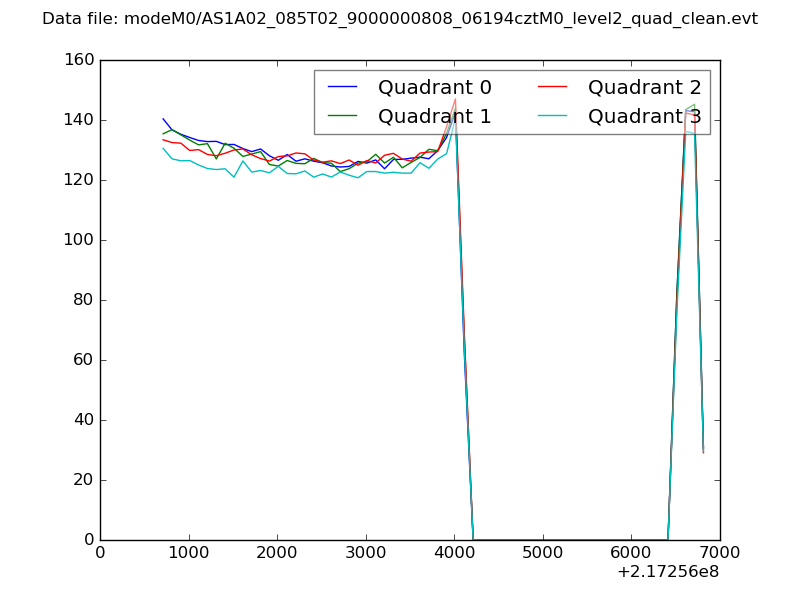 |
|
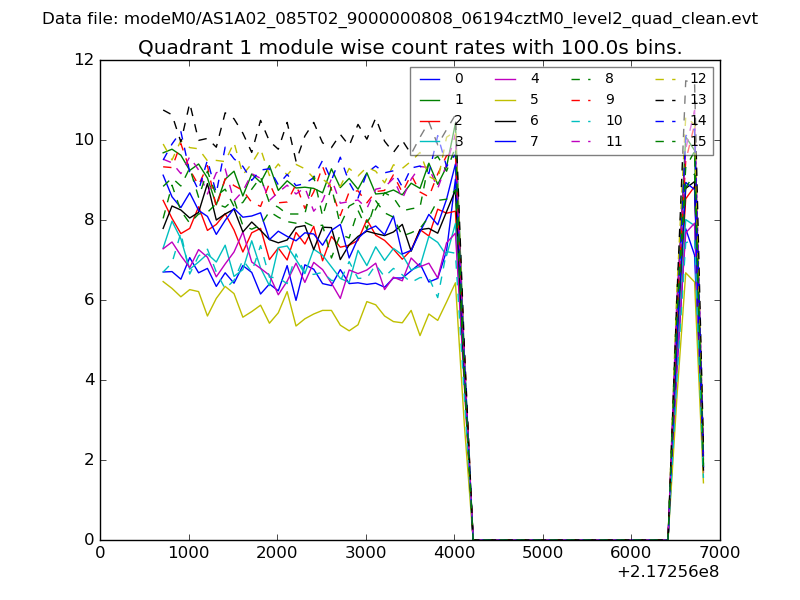
| Module-wise count rates for Quadrant A Data is divided into 100 sec bins |
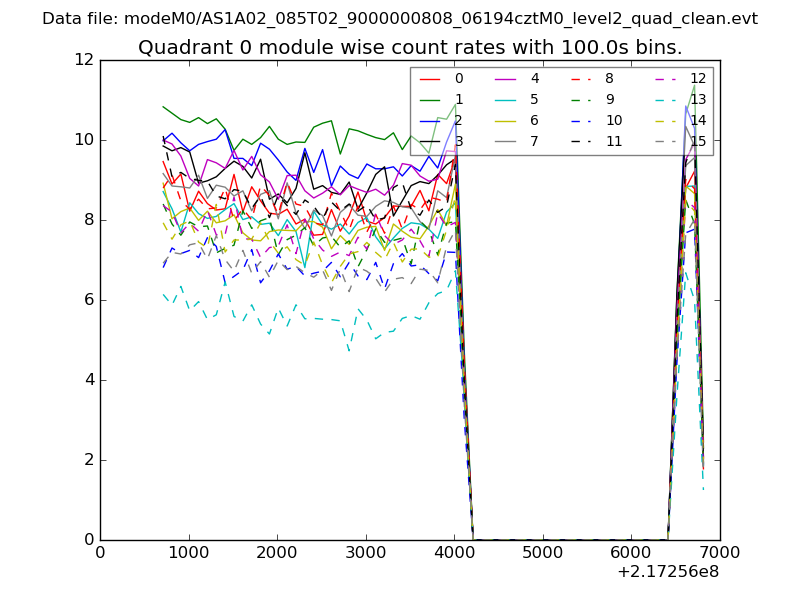 |
 |
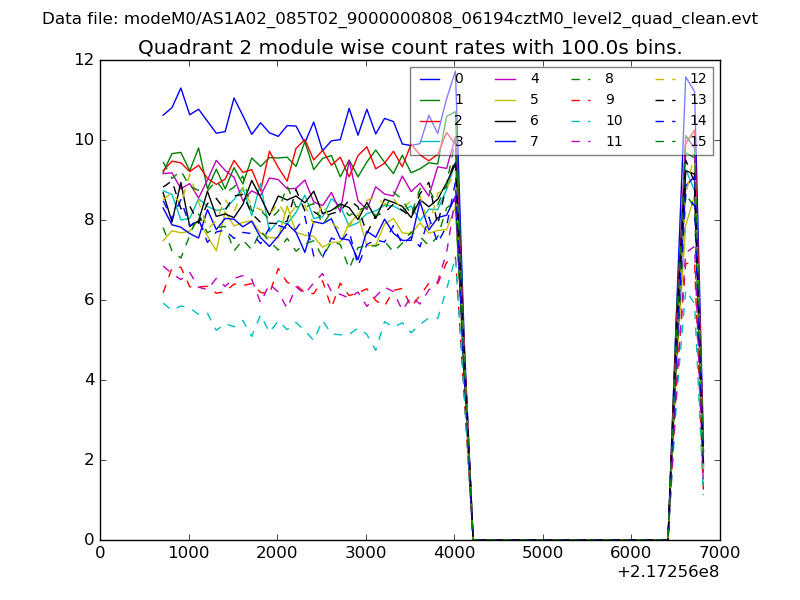
| Module-wise count rates for Quadrant B Data is divided into 100 sec bins |
 |
 |
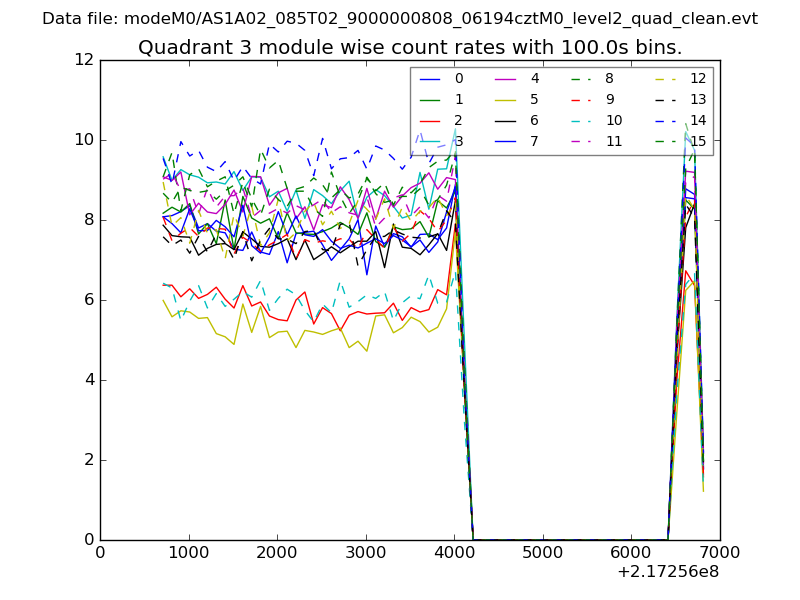
| Module-wise count rates for Quadrant C Data is divided into 100 sec bins |
 |
 |
| Module-wise count rates for Quadrant D Data is divided into 100 sec bins |
 |
 |
| Parameter | Plot |
|---|---|
| CZT HV Monitor | 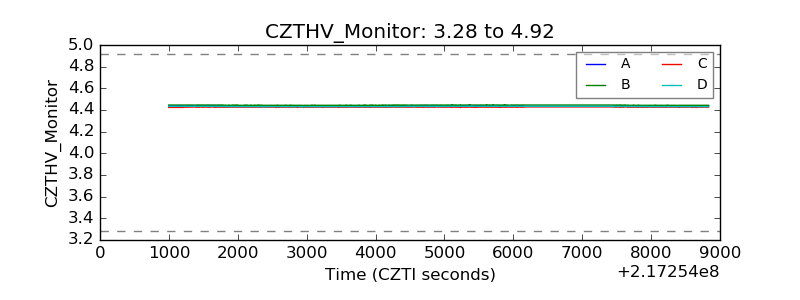 |
| D_VDD | 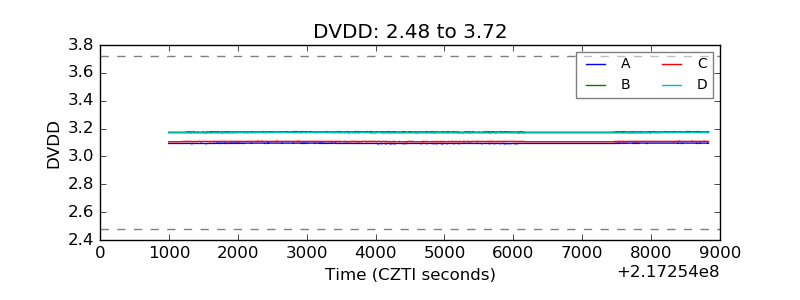 |
| Temperature 1 | 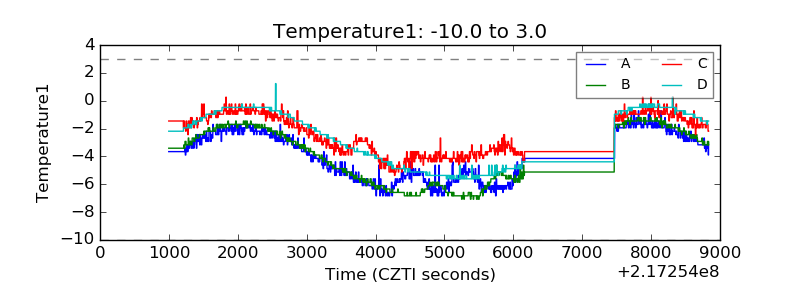 |
| Veto HV Monitor | 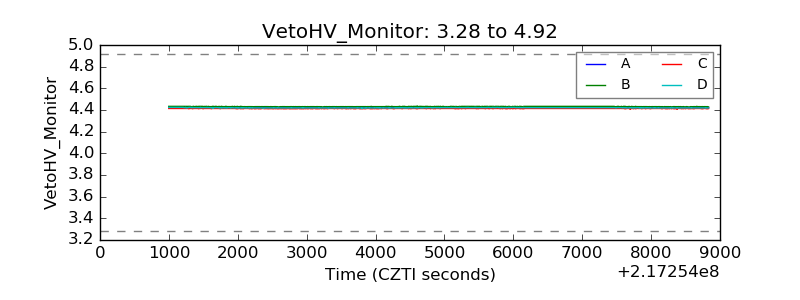 |
| Veto LLD | 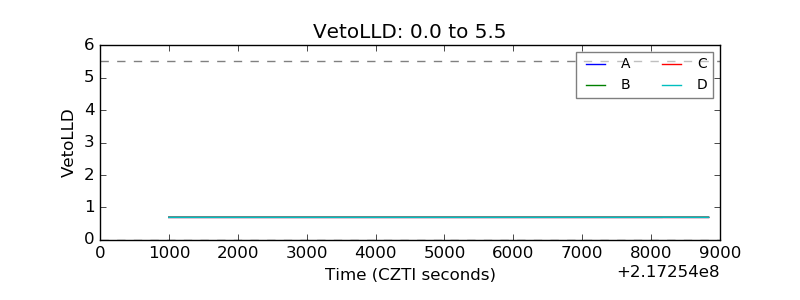 |
| Alpha Counter | 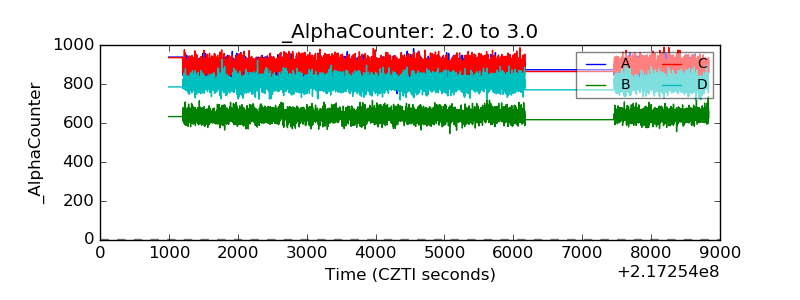 |
| _CPM_Rate | 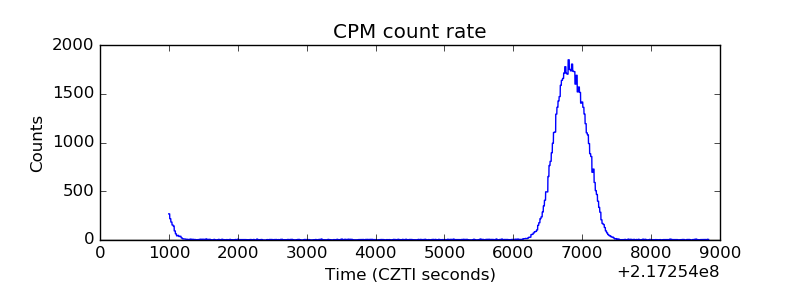 |
| CZT Counter | 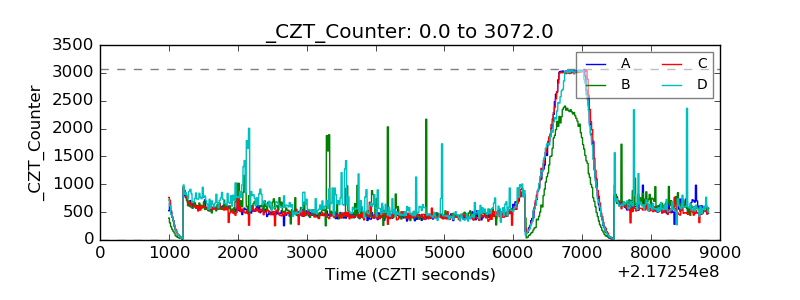 |
| +2.5 Volts monitor |  |
| +5 Volts monitor |  |
| _ROLL_ROT | 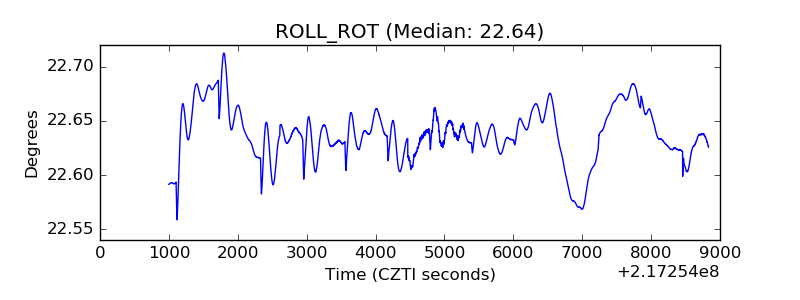 |
| _Roll_DEC | 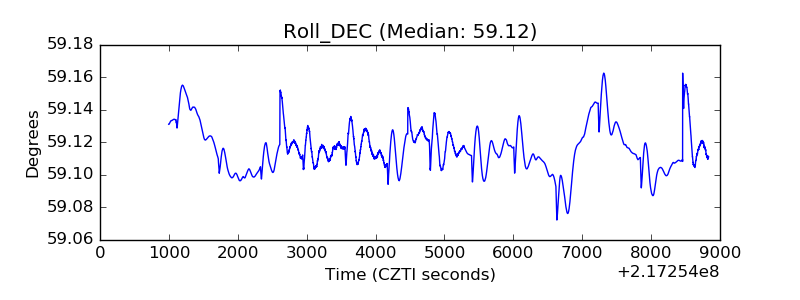 |
| _Roll_RA | 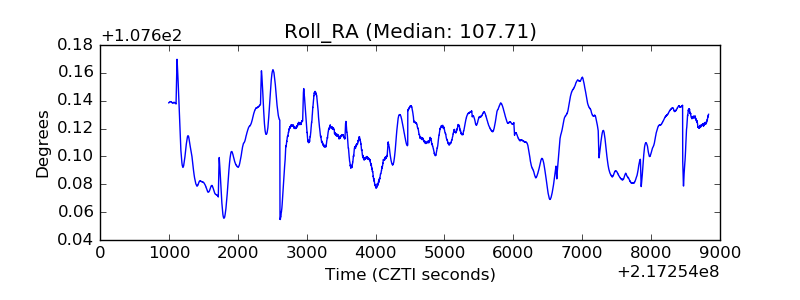 |
| Veto Counter | 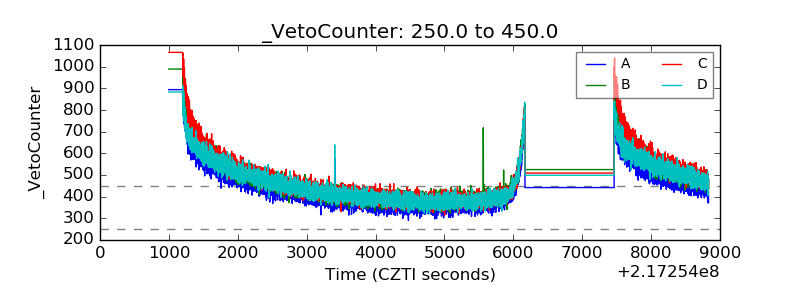 |