| Param | Original file | Final file |
|---|---|---|
| Filename | modeM0/AS1A02_085T02_9000000808_06196cztM0_level2.evt | modeM0/AS1A02_085T02_9000000808_06196cztM0_level2_quad_clean.evt |
| Size (bytes) | 467,660,160 | 103,737,600 |
| Size | 446.0 MB | 98.9 MB |
| Events in quadrant A | 3,106,744 | 677,228 |
| Events in quadrant B | 3,665,560 | 676,805 |
| Events in quadrant C | 3,082,909 | 688,040 |
| Events in quadrant D | 3,877,134 | 657,139 |
| Mode SS | |||
|---|---|---|---|
| Quadrant | BADHDUFLAG | Total packets | Discarded packets |
| A | 0 | 130 | 0 |
| B | 0 | 130 | 0 |
| C | 0 | 130 | 0 |
| D | 0 | 130 | 0 |
| Mode M9 | |||
|---|---|---|---|
| Quadrant | BADHDUFLAG | Total packets | Discarded packets |
| A | 0 | 24 | 0 |
| B | 0 | 24 | 0 |
| C | 0 | 24 | 0 |
| D | 0 | 24 | 0 |
| Mode M0 | |||
|---|---|---|---|
| Quadrant | BADHDUFLAG | Total packets | Discarded packets |
| A | 0 | 13482 | 3 |
| B | 0 | 15270 | 2 |
| C | 0 | 13507 | 2 |
| D | 0 | 15813 | 2 |
| Quadrant | Total seconds | Saturated seconds | Saturation percentage |
|---|---|---|---|
| A | 6339 | 86 | 1.356681% |
| B | 6339 | 200 | 3.155072% |
| C | 6339 | 68 | 1.072724% |
| D | 6339 | 110 | 1.735289% |
Noise dominated data is calculated using 1-second bins in cleaned event files. If a bin has >2000 counts, and if more than 50% of those come from <1% of pixels, then it is considered to be noise-dominated and hence unusable.
| Quadrant | # 1 sec bins | Bins with >0 counts | Bins with >2000 counts | High rate bins dominated by noise | Noise dominated (total time) | Noise dominated (detector-on time) | Marked lightcurve |
|---|---|---|---|---|---|---|---|
| A | 7594 | 6340 | 3 | 3 | 0.04% | 0.05% | 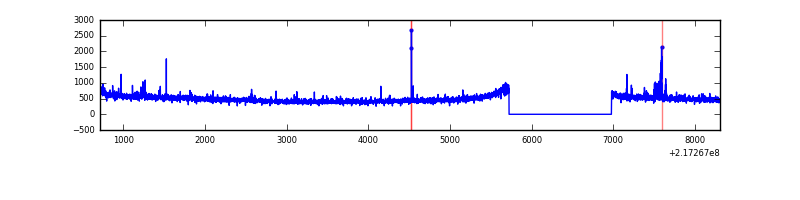 |
| B | 7594 | 6340 | 96 | 96 | 1.26% | 1.51% | 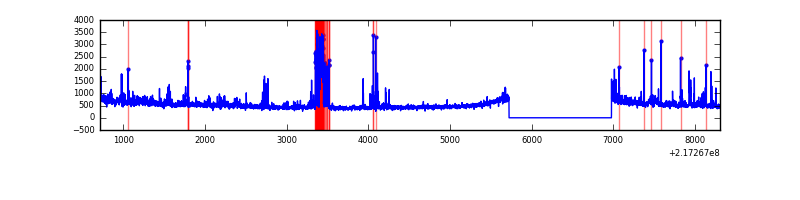 |
| C | 7594 | 6340 | 0 | 0 | 0.00% | 0.00% | 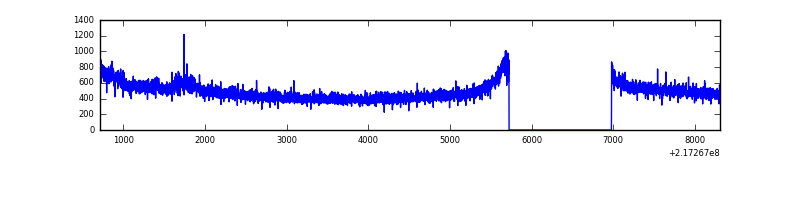 |
| D | 7594 | 6340 | 17 | 17 | 0.22% | 0.27% | 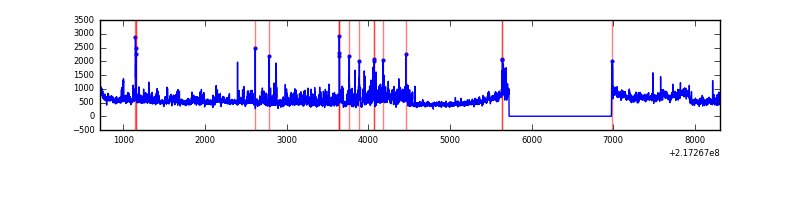 |
Top three noisy pixels from each quadrant. If the there are fewer than three noisy pixels in the level2.evt file, extra rows are filled as -1
| Pixel properties | Quadrant properties | ||||||
|---|---|---|---|---|---|---|---|
| Quadrant | DetID | PixID | Counts | Sigma | Mean | Median | Sigma |
| A | 8 | 15 | 88940 | 568.75 | 771 | 753 | 155.1 |
| A | 15 | 236 | 31070 | 195.52 | 771 | 753 | 155.1 |
| A | 14 | 111 | 7928 | 46.27 | 771 | 753 | 155.1 |
| B | 15 | 35 | 268620 | 1835.19 | 776 | 759 | 146.0 |
| B | 3 | 64 | 103956 | 707.03 | 776 | 759 | 146.0 |
| B | 15 | 204 | 97689 | 664.09 | 776 | 759 | 146.0 |
| C | 1 | 16 | 104600 | 592.37 | 763 | 768 | 175.3 |
| C | 13 | 61 | 6034 | 30.04 | 763 | 768 | 175.3 |
| C | 3 | 202 | 1937 | 6.67 | 763 | 768 | 175.3 |
| D | 2 | 63 | 788463 | 4311.32 | 757 | 733 | 182.7 |
| D | 5 | 97 | 62046 | 335.57 | 757 | 733 | 182.7 |
| D | 2 | 14 | 47569 | 256.34 | 757 | 733 | 182.7 |
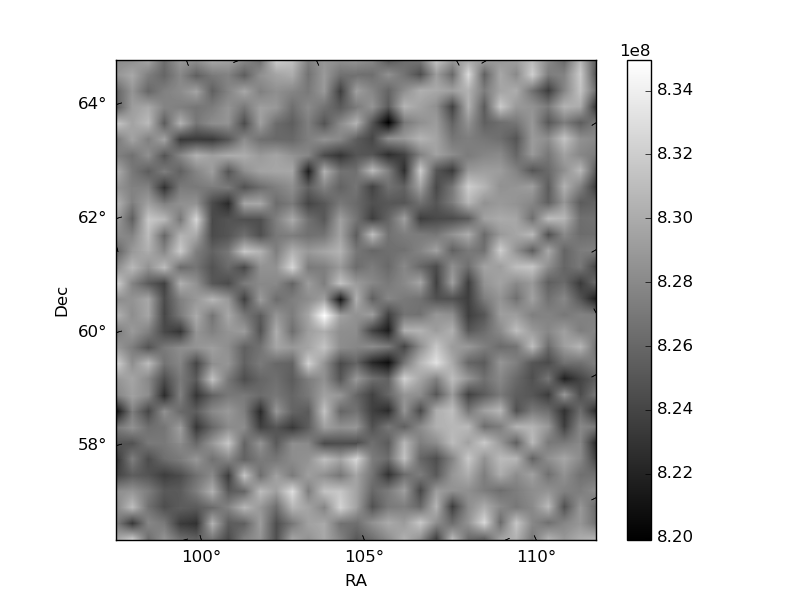
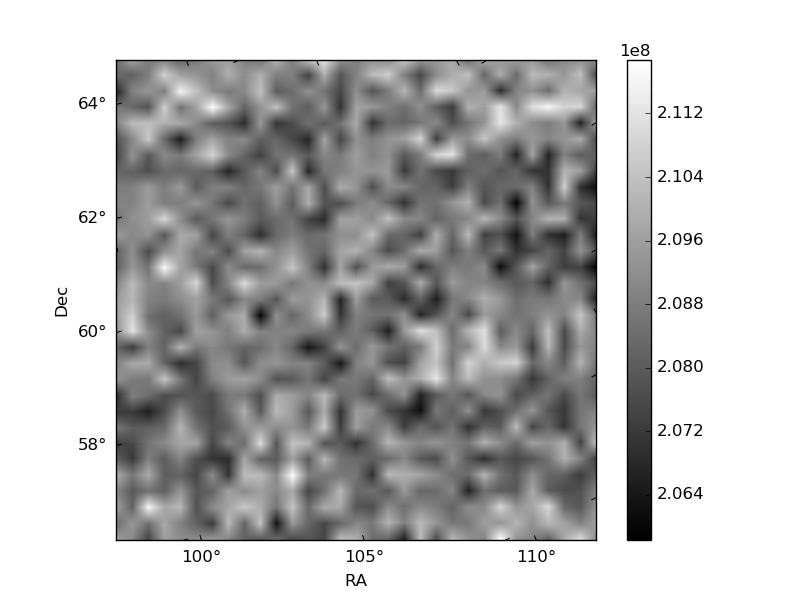
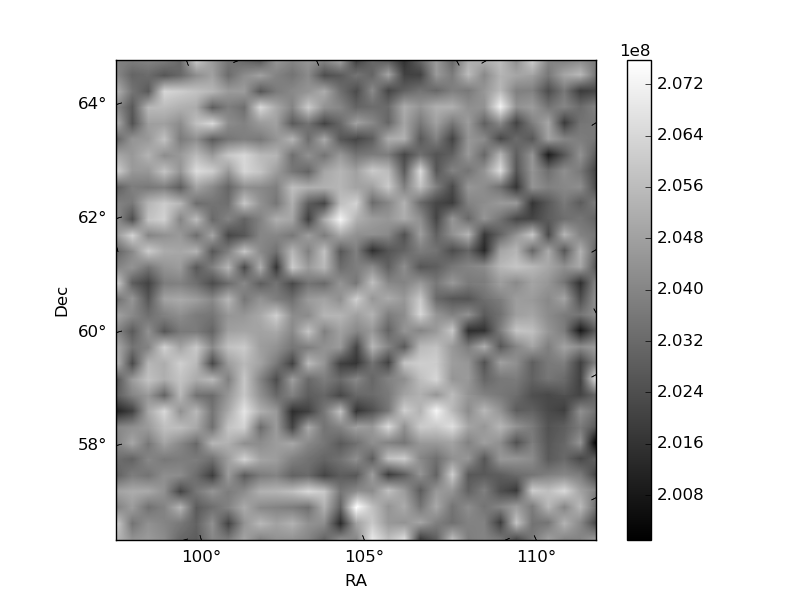
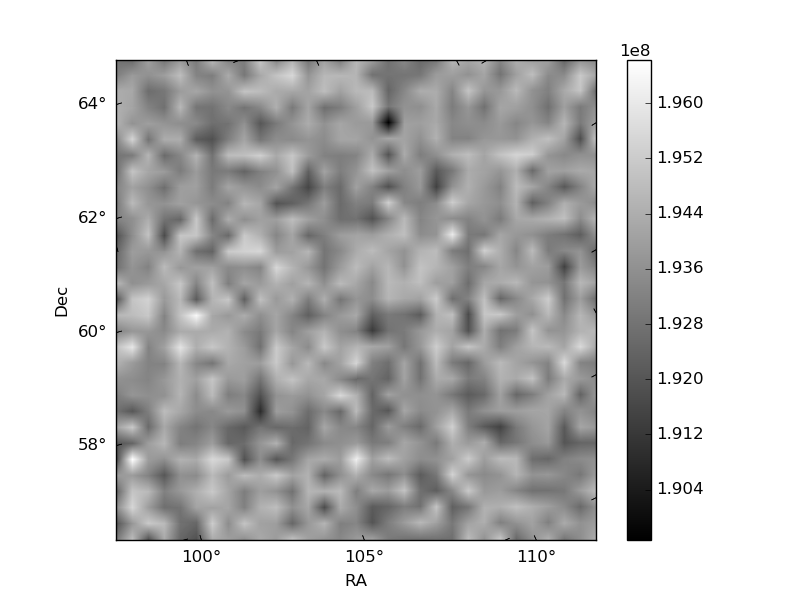
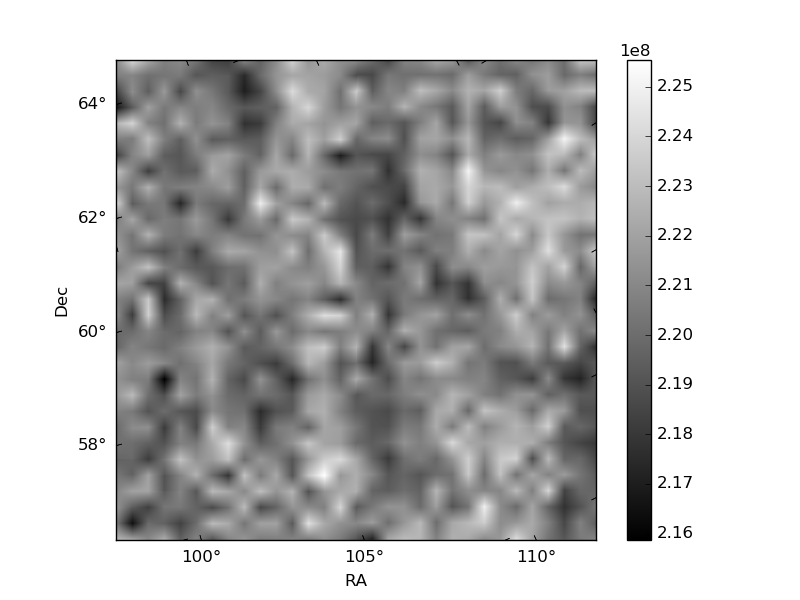
Histogram calculated using DETX and DETY for each event in the final _common_clean file
| Quadrant A | 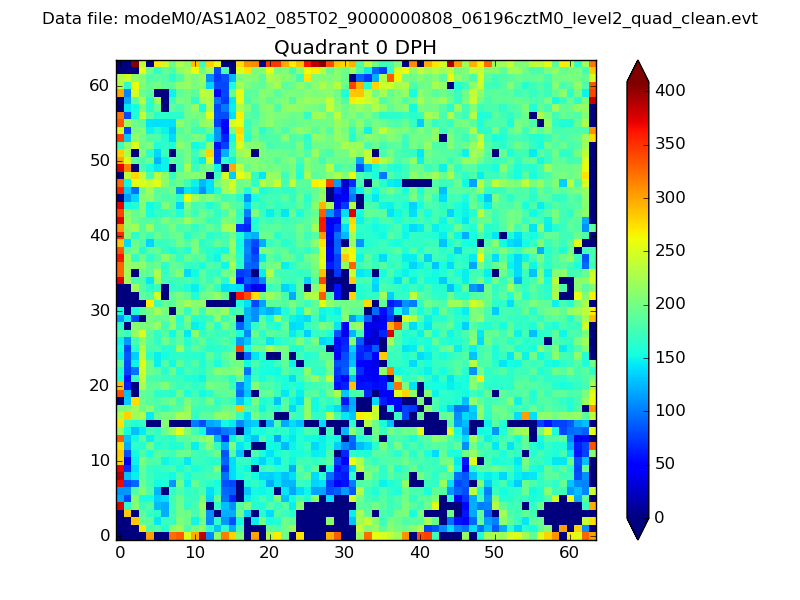 |
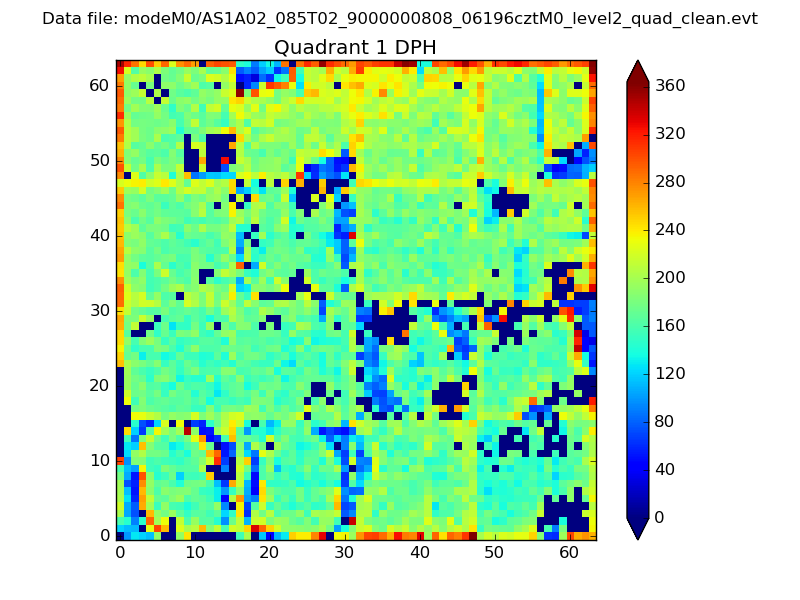 |
Quadrant B |
|---|---|---|---|
| Quadrant D | 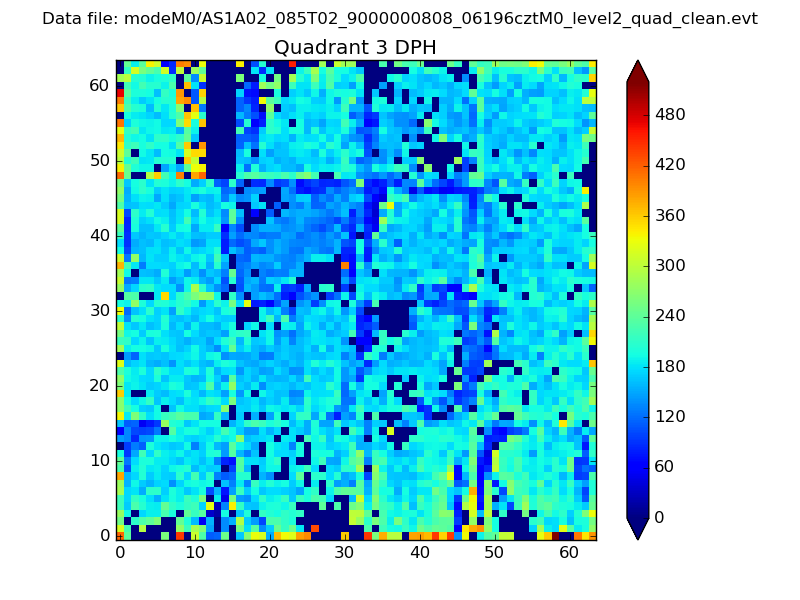 |
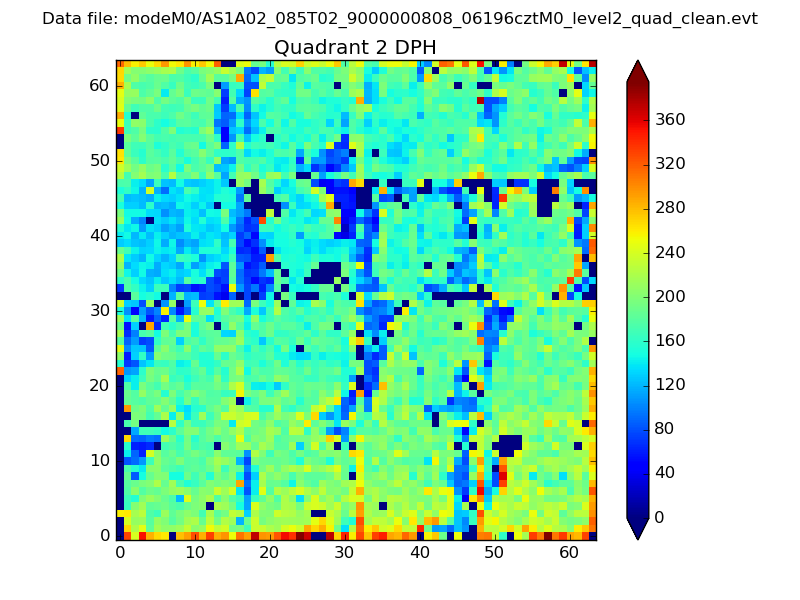 |
Quadrant C |
| Plot type | Count rate plots | Images |
|---|---|---|
| Comparison with Poisson distribution Blue bars denote a histogram of data divided into 1 sec bins. Red curve is a Poisson curve with rate = median count rate of data. |
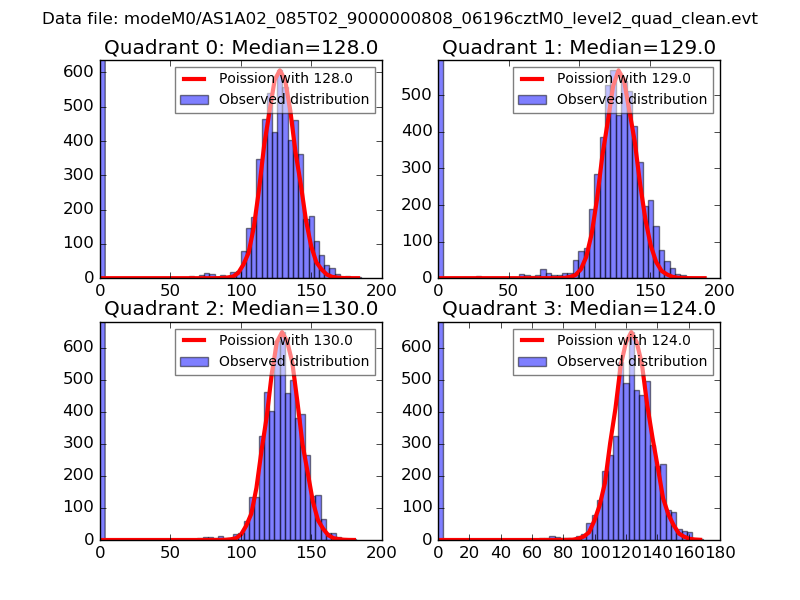 |
 |
| Quadrant-wise count rates Data is divided into 100 sec bins |
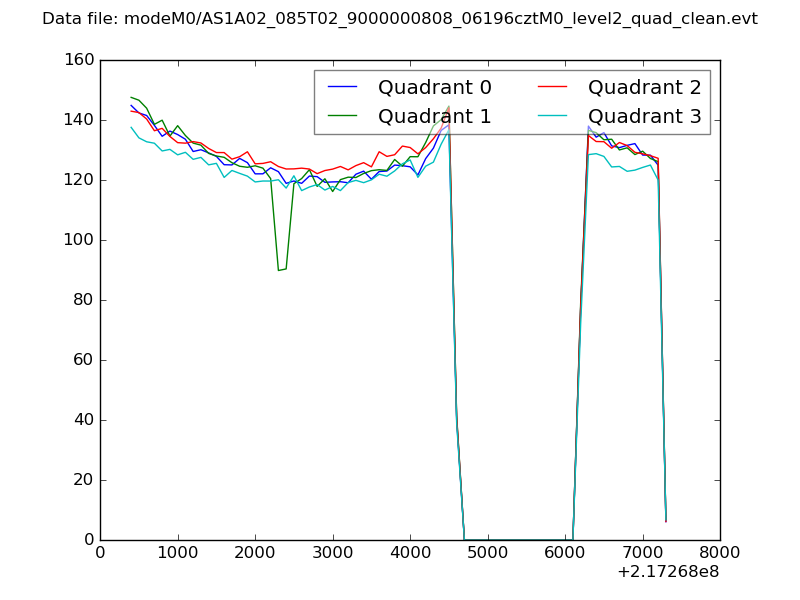 |
|
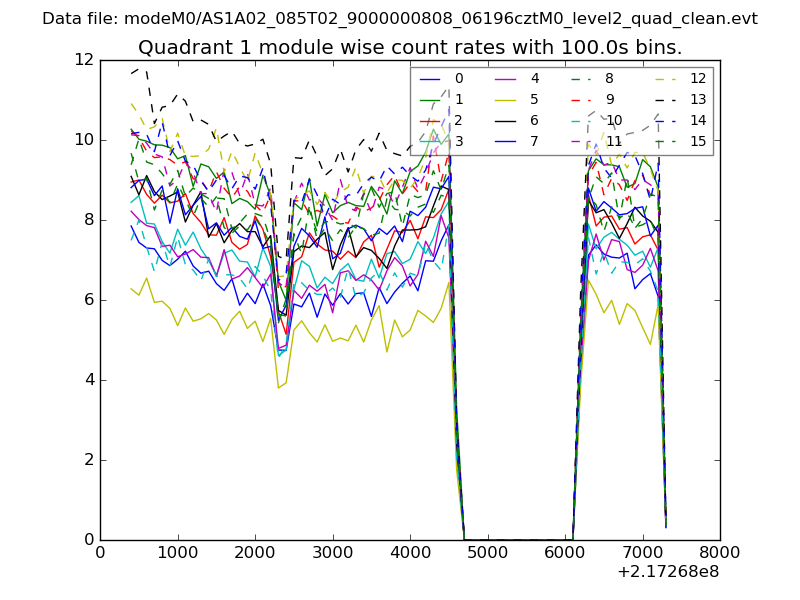
| Module-wise count rates for Quadrant A Data is divided into 100 sec bins |
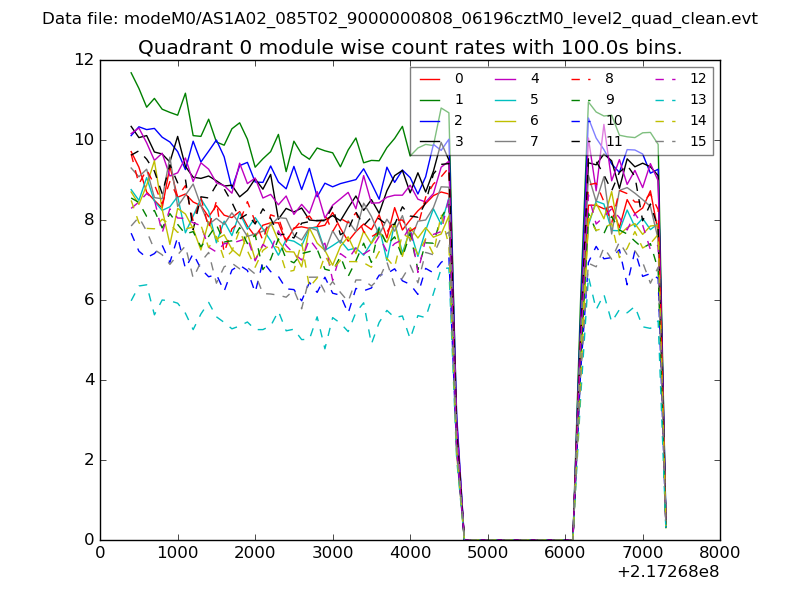 |
 |
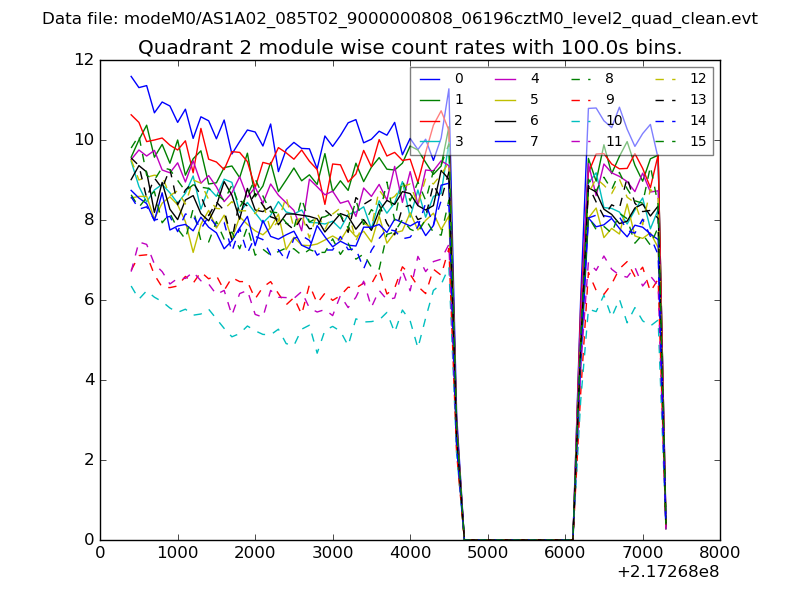
| Module-wise count rates for Quadrant B Data is divided into 100 sec bins |
 |
 |
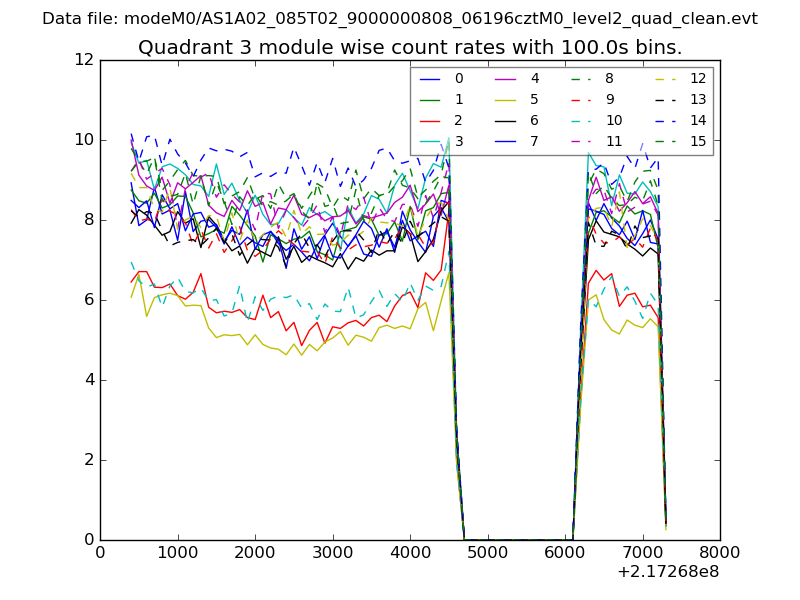
| Module-wise count rates for Quadrant C Data is divided into 100 sec bins |
 |
 |
| Module-wise count rates for Quadrant D Data is divided into 100 sec bins |
 |
 |
| Parameter | Plot |
|---|---|
| CZT HV Monitor | 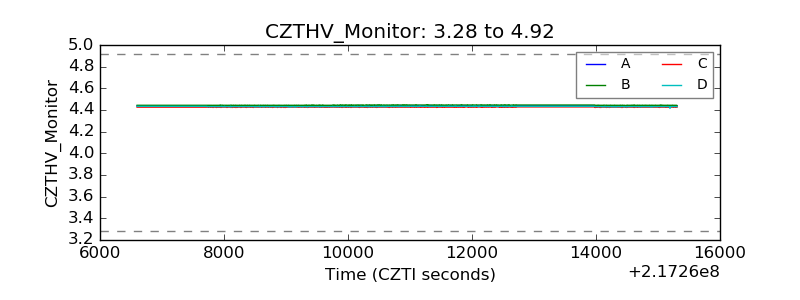 |
| D_VDD | 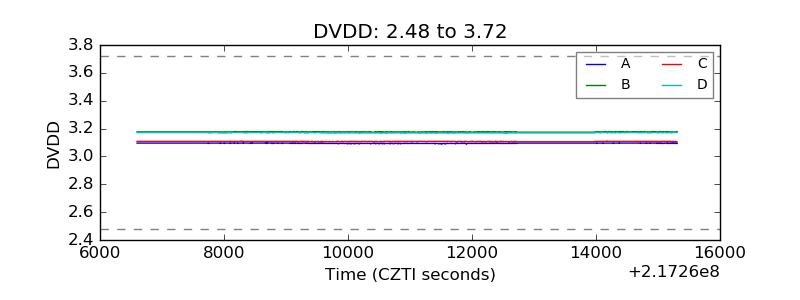 |
| Temperature 1 | 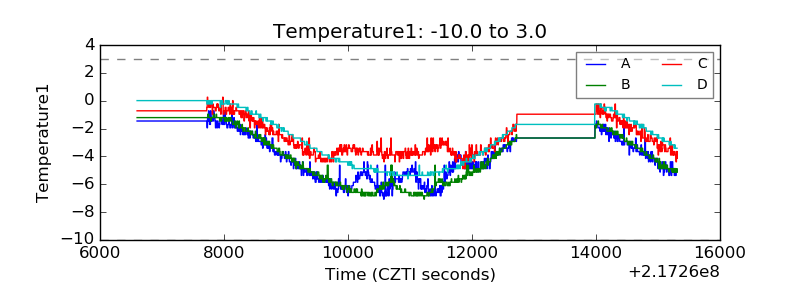 |
| Veto HV Monitor | 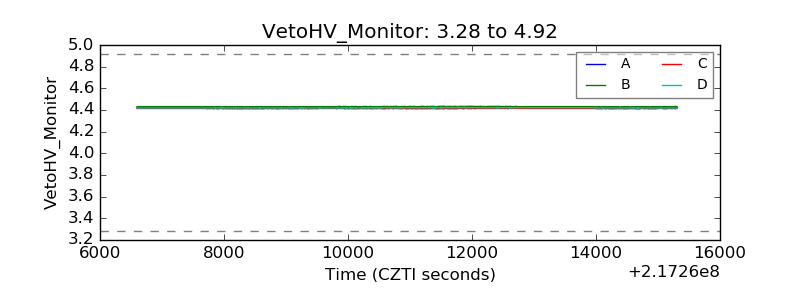 |
| Veto LLD | 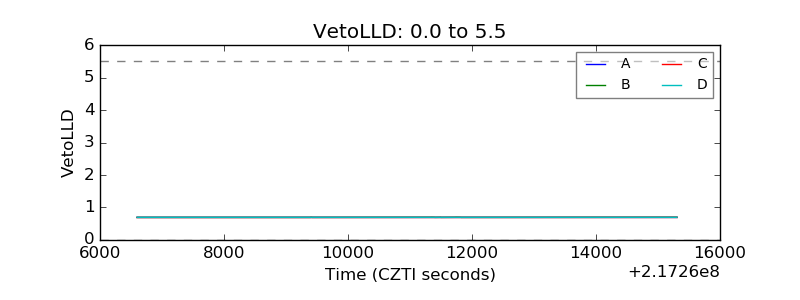 |
| Alpha Counter | 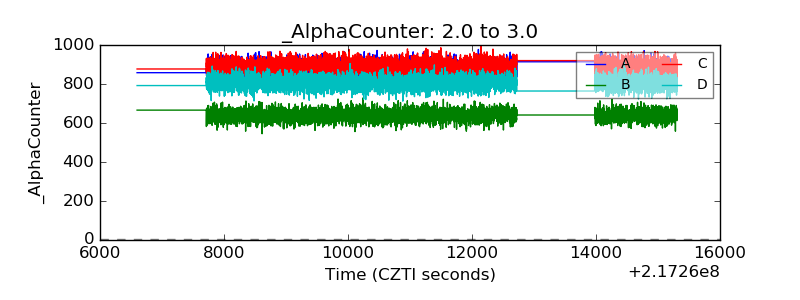 |
| _CPM_Rate | 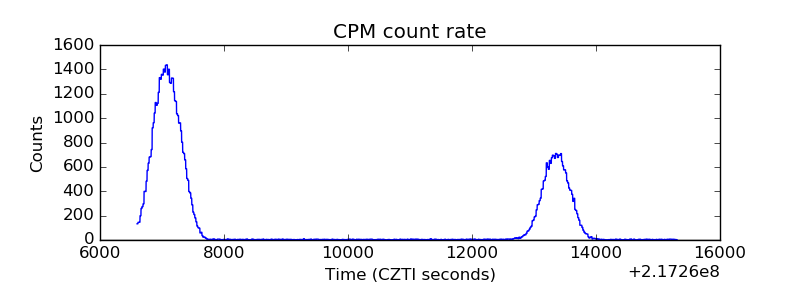 |
| CZT Counter | 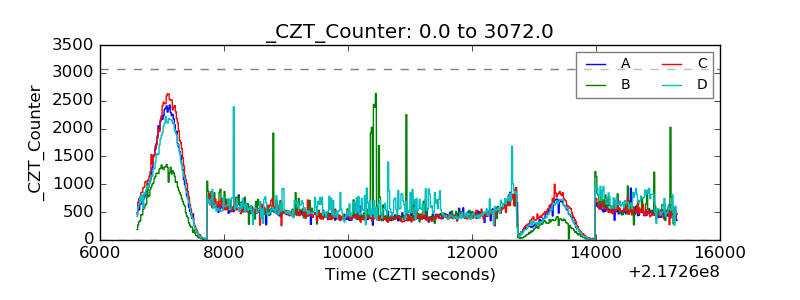 |
| +2.5 Volts monitor |  |
| +5 Volts monitor | 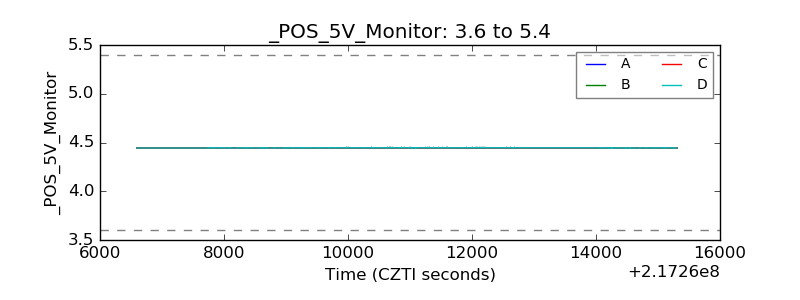 |
| _ROLL_ROT | 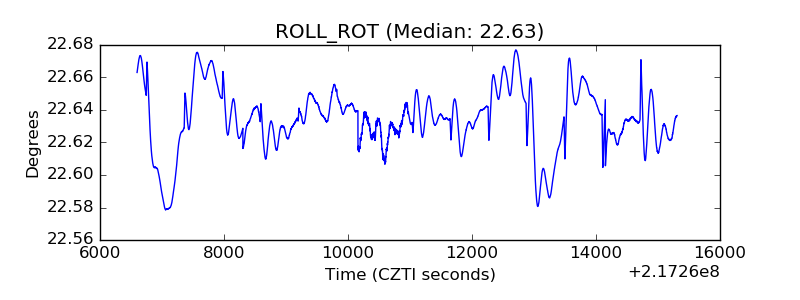 |
| _Roll_DEC | 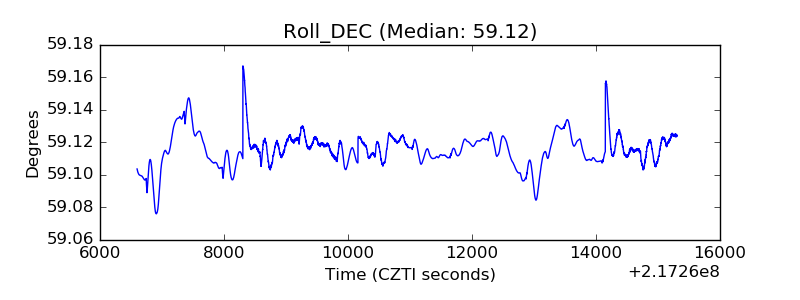 |
| _Roll_RA | 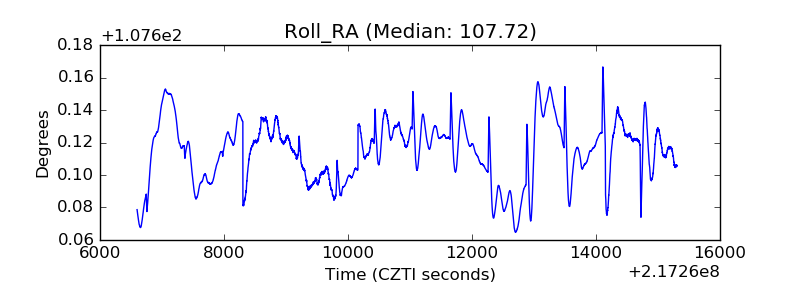 |
| Veto Counter | 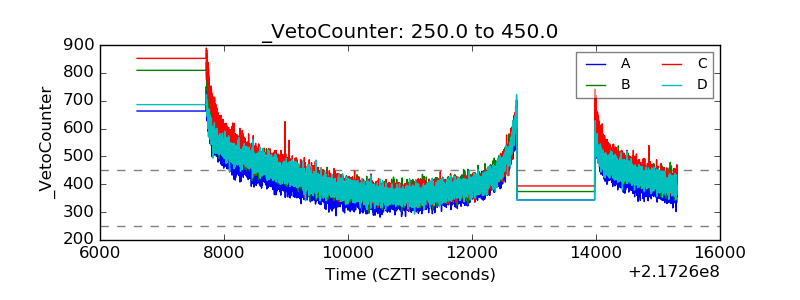 |