| Param | Original file | Final file |
|---|---|---|
| Filename | modeM0/AS1A02_085T02_9000000808_06197cztM0_level2.evt | modeM0/AS1A02_085T02_9000000808_06197cztM0_level2_quad_clean.evt |
| Size (bytes) | 469,134,720 | 105,396,480 |
| Size | 447.4 MB | 100.5 MB |
| Events in quadrant A | 3,196,374 | 685,399 |
| Events in quadrant B | 3,470,708 | 689,028 |
| Events in quadrant C | 3,013,997 | 695,094 |
| Events in quadrant D | 4,078,047 | 661,918 |
| Mode SS | |||
|---|---|---|---|
| Quadrant | BADHDUFLAG | Total packets | Discarded packets |
| A | 0 | 136 | 0 |
| B | 0 | 136 | 0 |
| C | 0 | 136 | 0 |
| D | 0 | 136 | 0 |
| Mode M9 | |||
|---|---|---|---|
| Quadrant | BADHDUFLAG | Total packets | Discarded packets |
| A | 0 | 16 | 0 |
| B | 0 | 16 | 0 |
| C | 0 | 16 | 0 |
| D | 0 | 17 | 0 |
| Mode M0 | |||
|---|---|---|---|
| Quadrant | BADHDUFLAG | Total packets | Discarded packets |
| A | 0 | 14034 | 3 |
| B | 0 | 14923 | 2 |
| C | 0 | 13604 | 2 |
| D | 0 | 16633 | 2 |
| Quadrant | Total seconds | Saturated seconds | Saturation percentage |
|---|---|---|---|
| A | 6599 | 77 | 1.166843% |
| B | 6599 | 100 | 1.515381% |
| C | 6599 | 38 | 0.575845% |
| D | 6599 | 55 | 0.833460% |
Noise dominated data is calculated using 1-second bins in cleaned event files. If a bin has >2000 counts, and if more than 50% of those come from <1% of pixels, then it is considered to be noise-dominated and hence unusable.
| Quadrant | # 1 sec bins | Bins with >0 counts | Bins with >2000 counts | High rate bins dominated by noise | Noise dominated (total time) | Noise dominated (detector-on time) | Marked lightcurve |
|---|---|---|---|---|---|---|---|
| A | 7539 | 6600 | 1 | 1 | 0.01% | 0.02% | 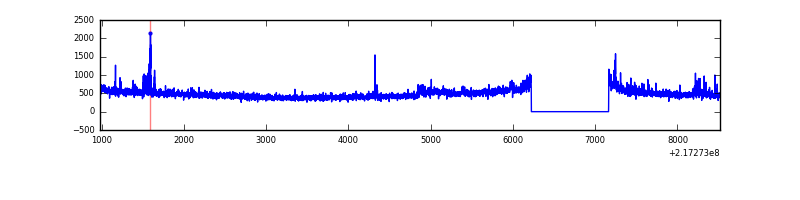 |
| B | 7539 | 6600 | 30 | 30 | 0.40% | 0.45% | 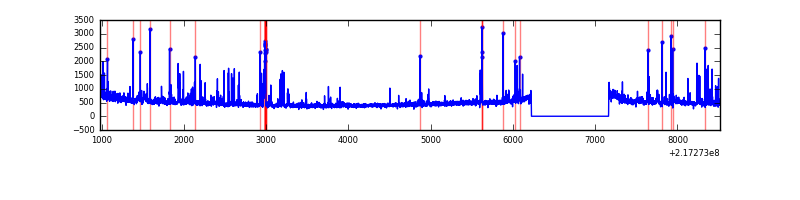 |
| C | 7539 | 6600 | 0 | 0 | 0.00% | 0.00% | 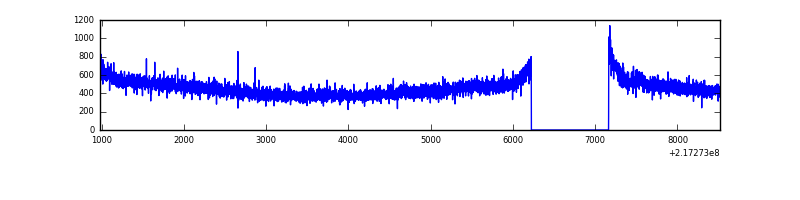 |
| D | 7539 | 6600 | 10 | 10 | 0.13% | 0.15% | 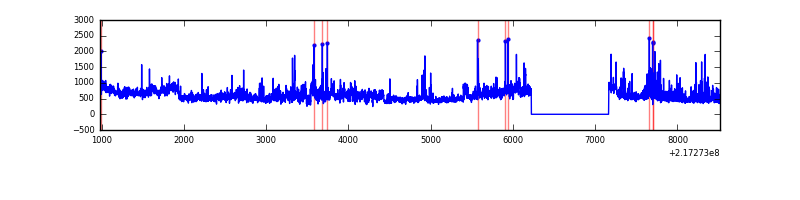 |
Top three noisy pixels from each quadrant. If the there are fewer than three noisy pixels in the level2.evt file, extra rows are filled as -1
| Pixel properties | Quadrant properties | ||||||
|---|---|---|---|---|---|---|---|
| Quadrant | DetID | PixID | Counts | Sigma | Mean | Median | Sigma |
| A | 8 | 15 | 85768 | 549.12 | 768 | 751 | 154.8 |
| A | 14 | 111 | 68665 | 438.65 | 768 | 751 | 154.8 |
| A | 4 | 2 | 55154 | 351.38 | 768 | 751 | 154.8 |
| B | 3 | 64 | 240671 | 1627.01 | 776 | 757 | 147.5 |
| B | 15 | 204 | 56097 | 375.3 | 776 | 757 | 147.5 |
| B | 4 | 80 | 41919 | 279.15 | 776 | 757 | 147.5 |
| C | 1 | 16 | 53717 | 302.92 | 758 | 760 | 174.8 |
| C | 13 | 61 | 6005 | 30.0 | 758 | 760 | 174.8 |
| C | 3 | 202 | 1952 | 6.82 | 758 | 760 | 174.8 |
| D | 2 | 63 | 1027001 | 5539.53 | 755 | 732 | 185.3 |
| D | 2 | 136 | 53625 | 285.5 | 755 | 732 | 185.3 |
| D | 5 | 97 | 43083 | 228.6 | 755 | 732 | 185.3 |
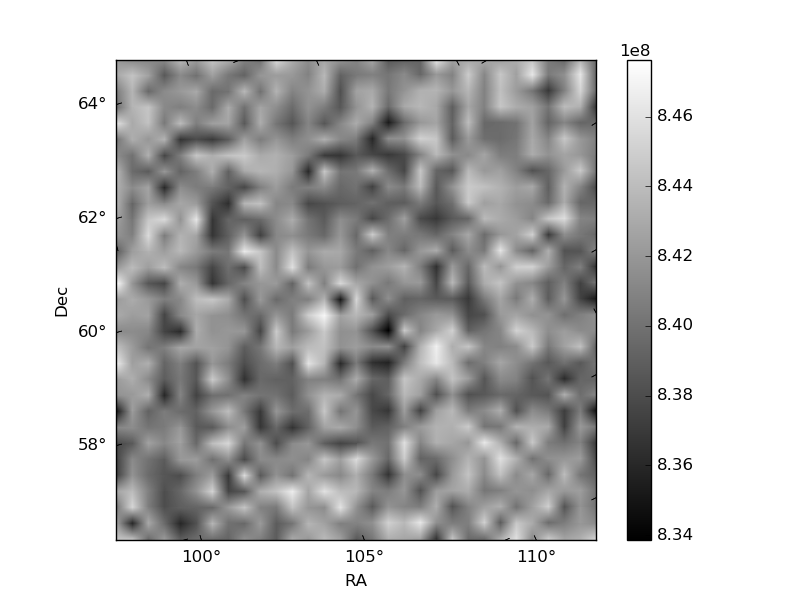
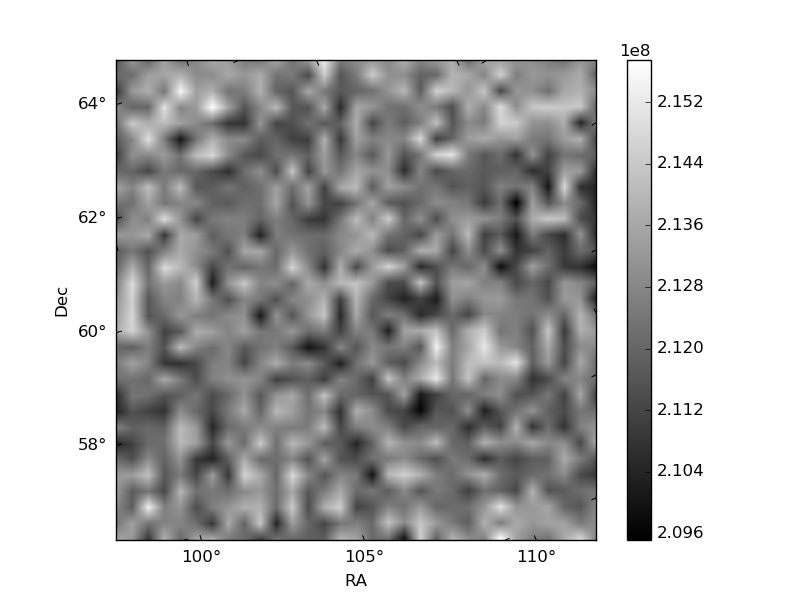
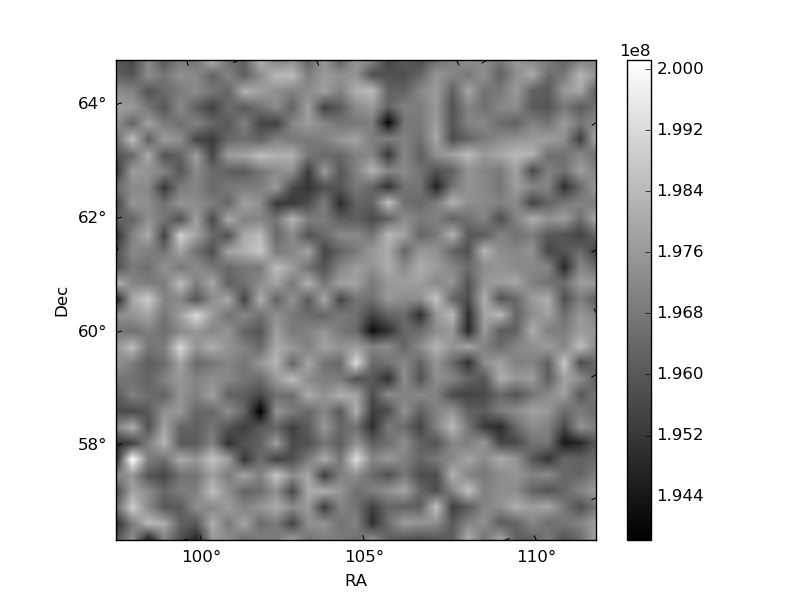
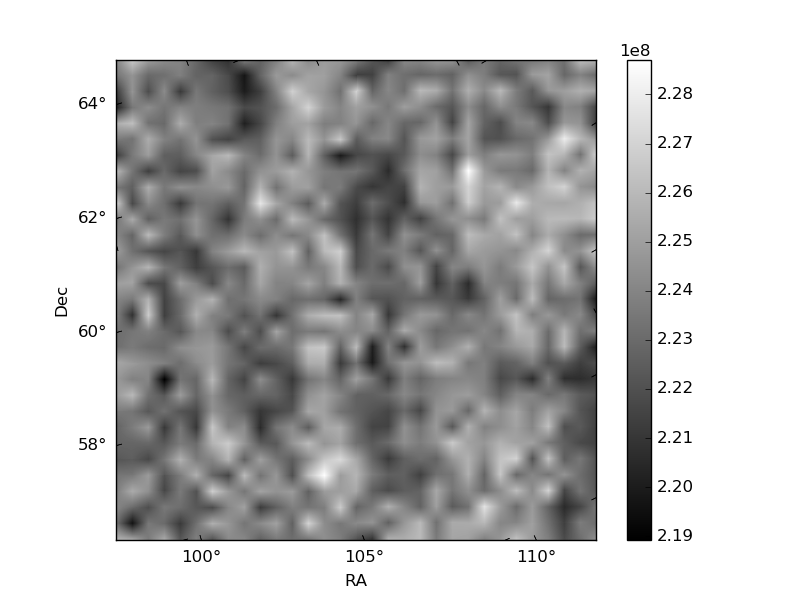
Histogram calculated using DETX and DETY for each event in the final _common_clean file
| Quadrant A | 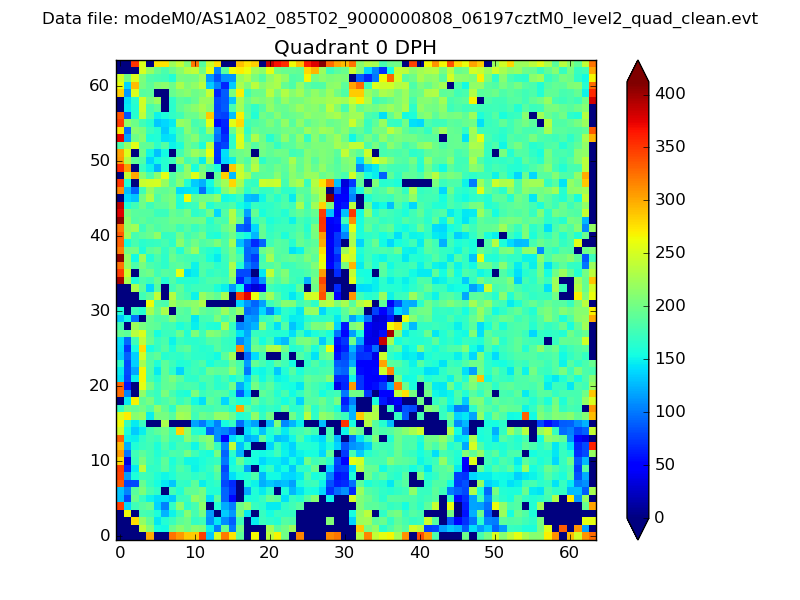 |
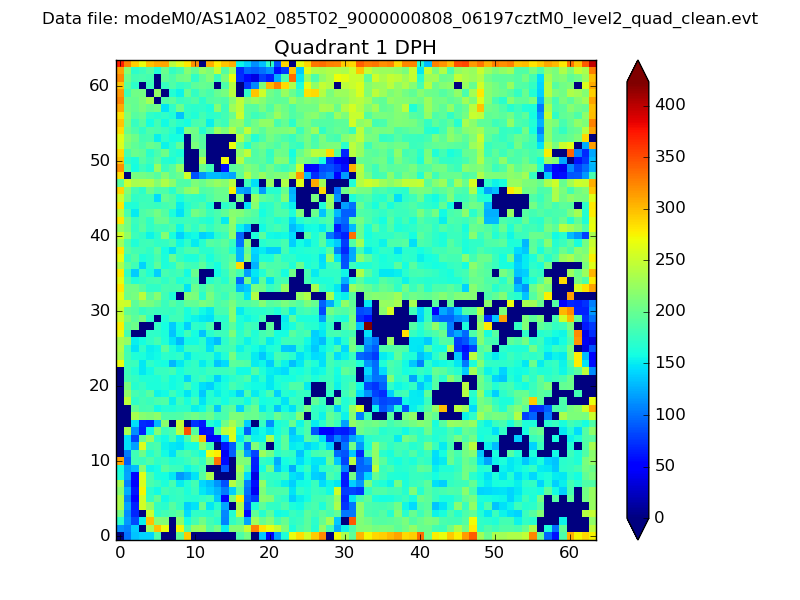 |
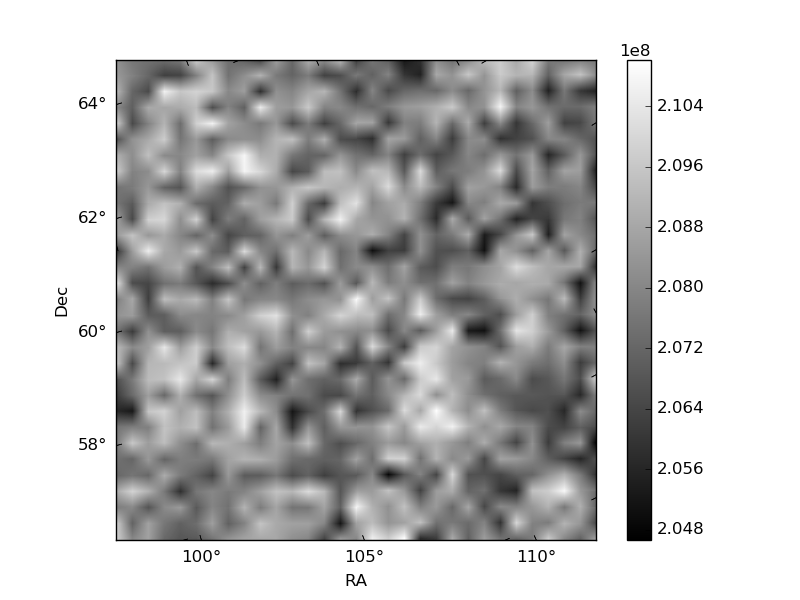
Quadrant B |
|---|---|---|---|
| Quadrant D | 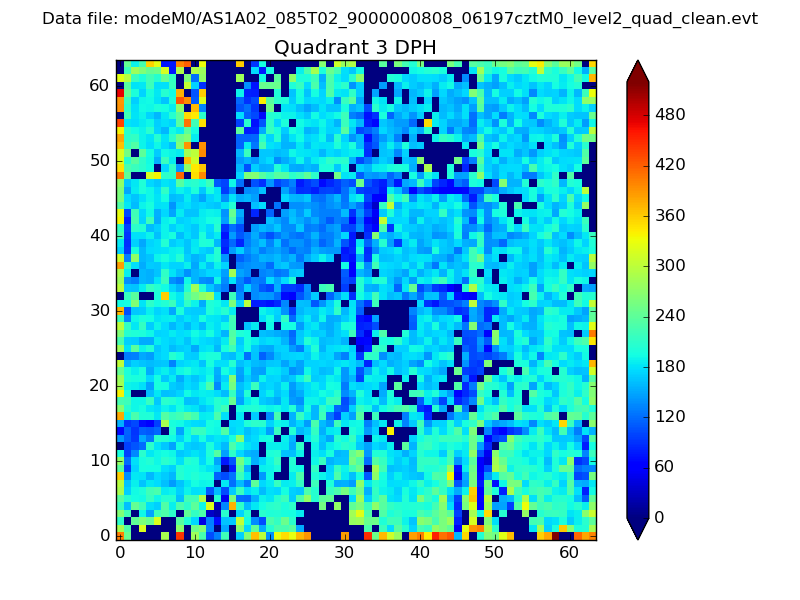 |
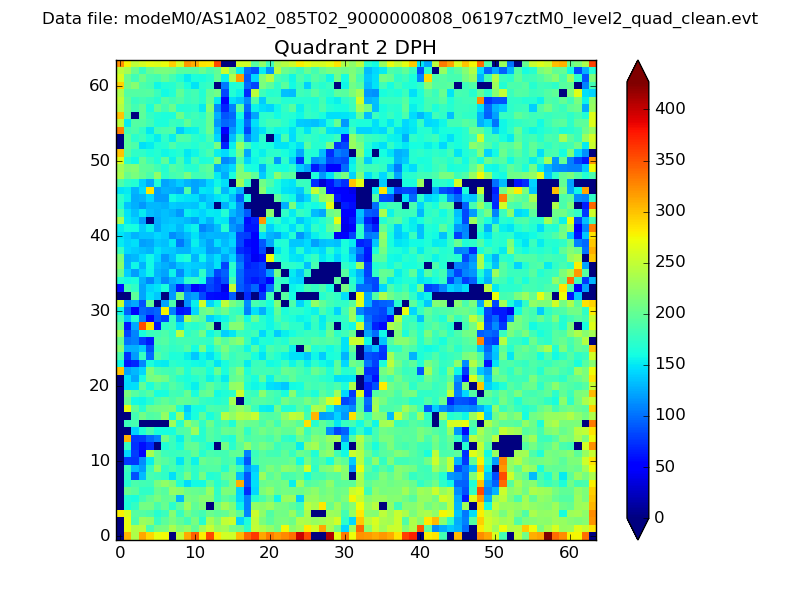 |
Quadrant C |
| Plot type | Count rate plots | Images |
|---|---|---|
| Comparison with Poisson distribution Blue bars denote a histogram of data divided into 1 sec bins. Red curve is a Poisson curve with rate = median count rate of data. |
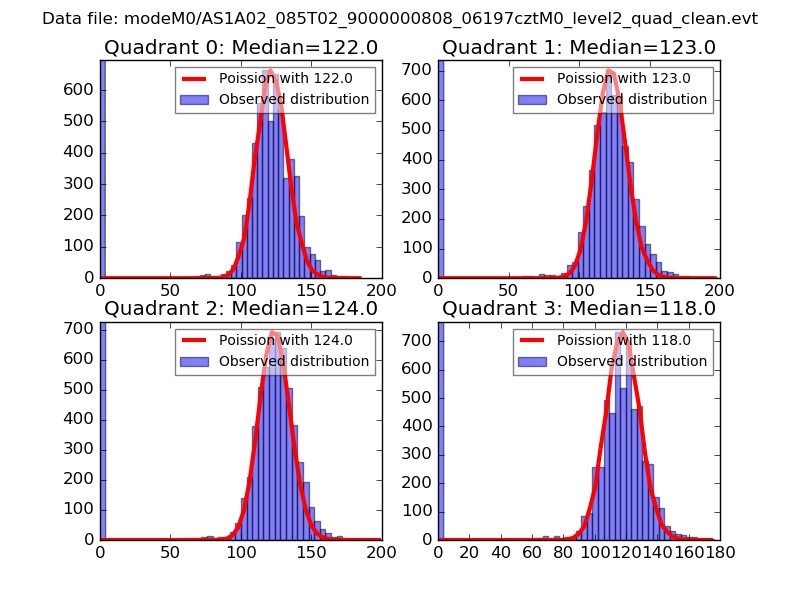 |
 |
| Quadrant-wise count rates Data is divided into 100 sec bins |
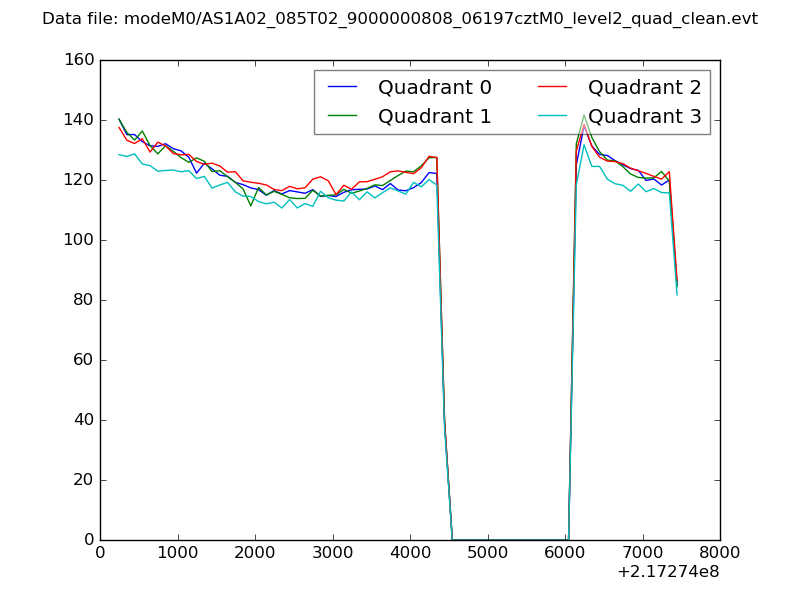 |
|
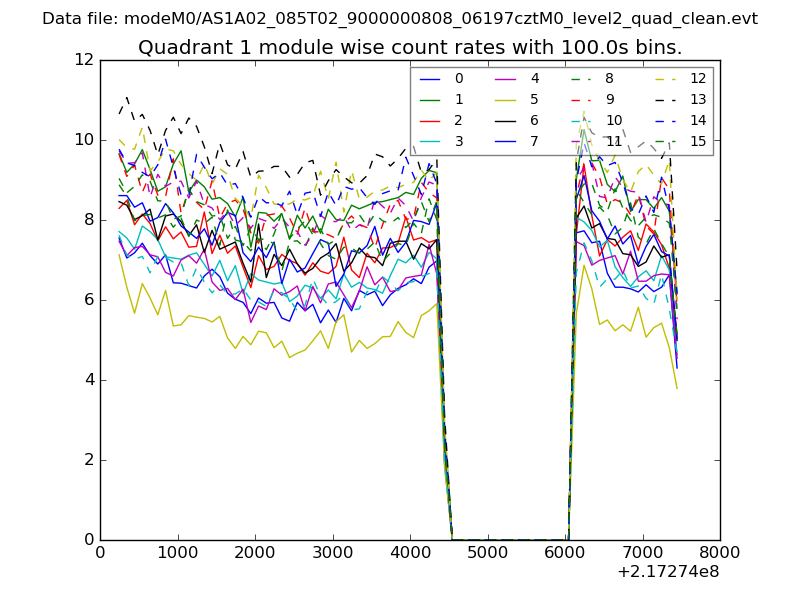
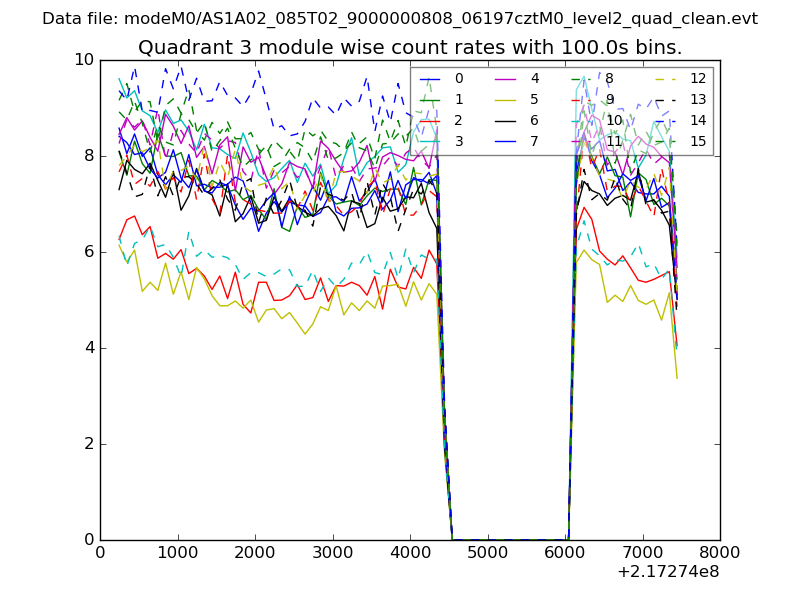
| Module-wise count rates for Quadrant A Data is divided into 100 sec bins |
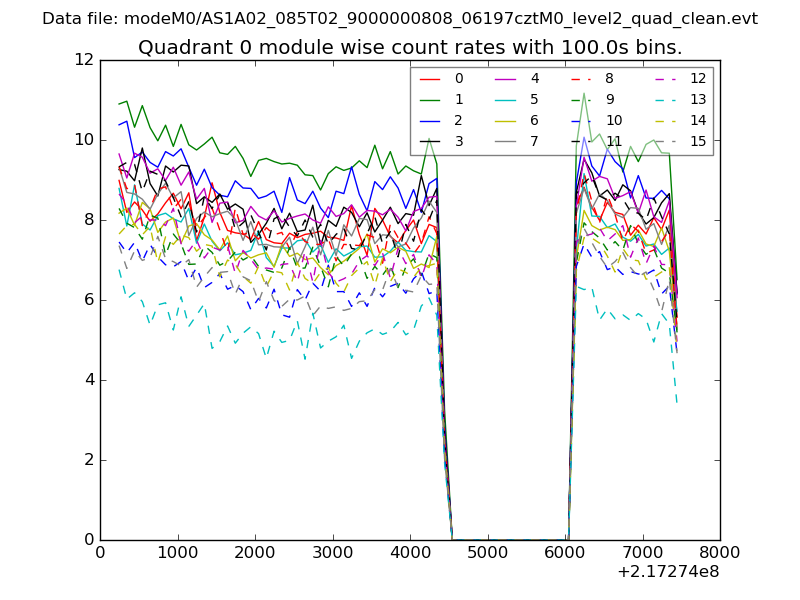 |
 |
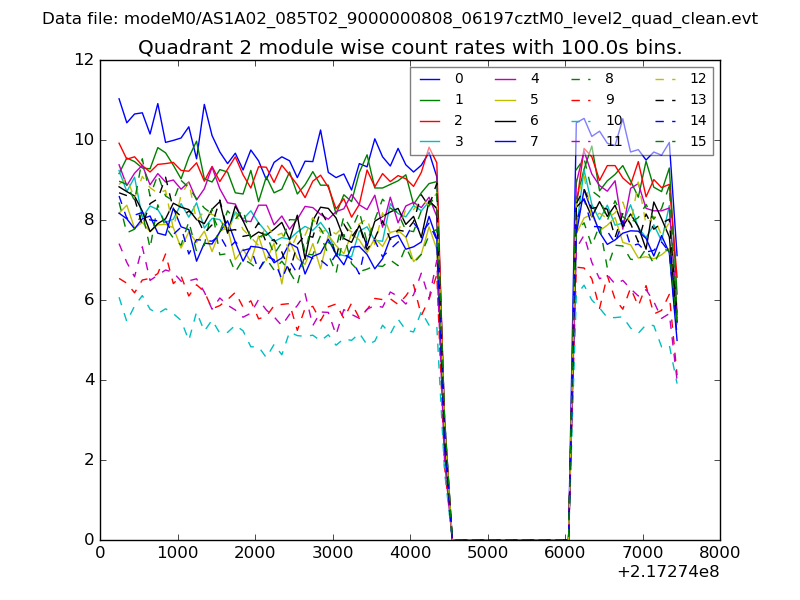
| Module-wise count rates for Quadrant B Data is divided into 100 sec bins |
 |
 |
| Module-wise count rates for Quadrant C Data is divided into 100 sec bins |
 |
 |
| Module-wise count rates for Quadrant D Data is divided into 100 sec bins |
 |
 |
| Parameter | Plot |
|---|---|
| CZT HV Monitor | 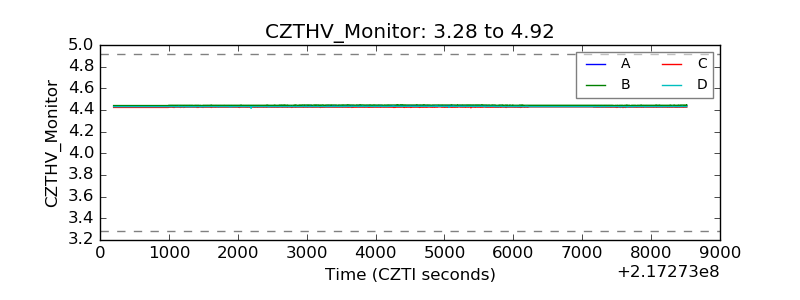 |
| D_VDD | 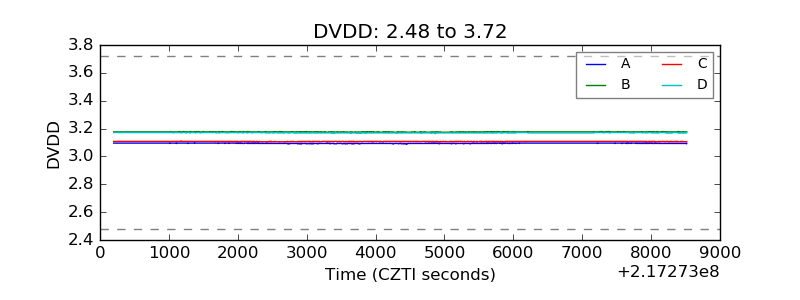 |
| Temperature 1 | 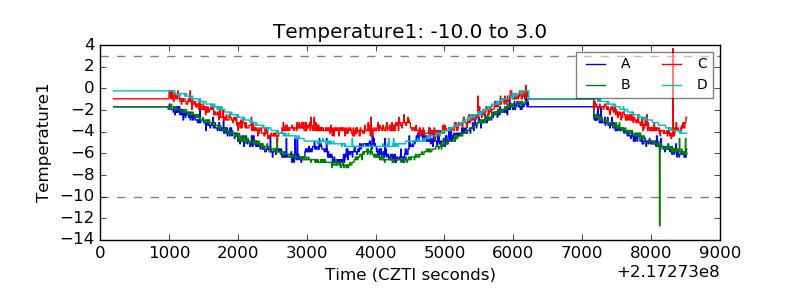 |
| Veto HV Monitor | 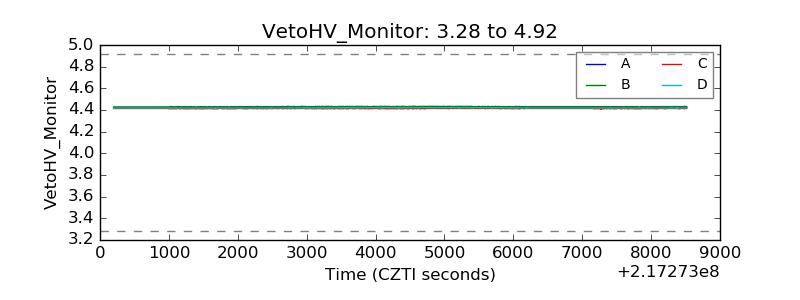 |
| Veto LLD | 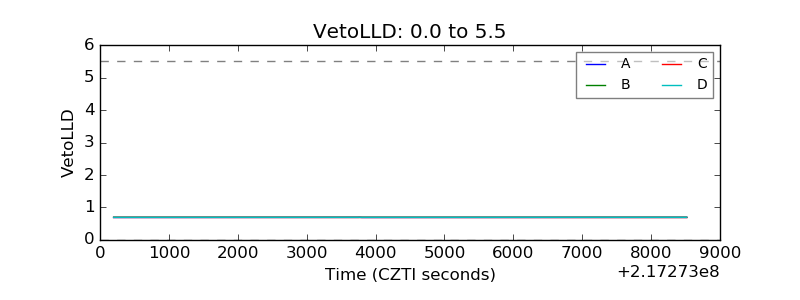 |
| Alpha Counter | 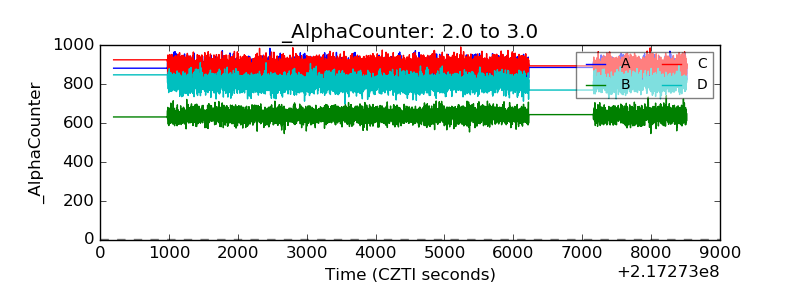 |
| _CPM_Rate | 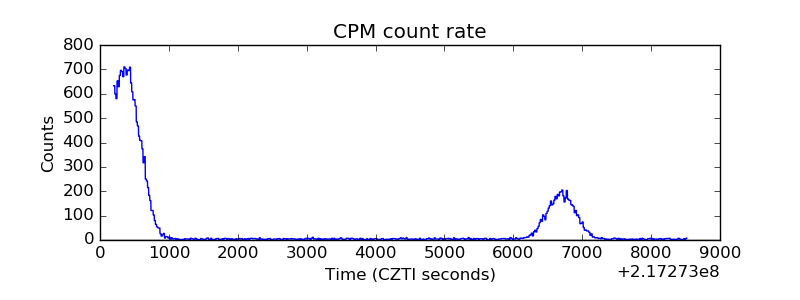 |
| CZT Counter | 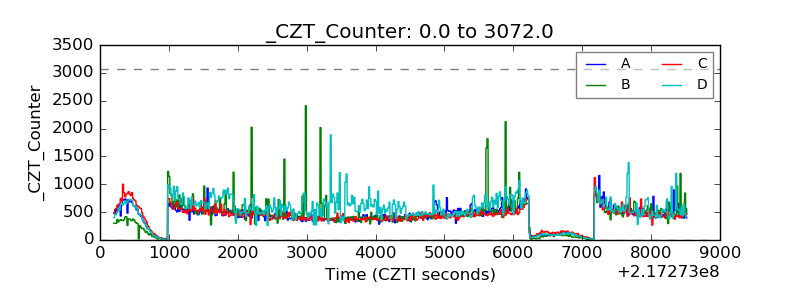 |
| +2.5 Volts monitor |  |
| +5 Volts monitor |  |
| _ROLL_ROT | 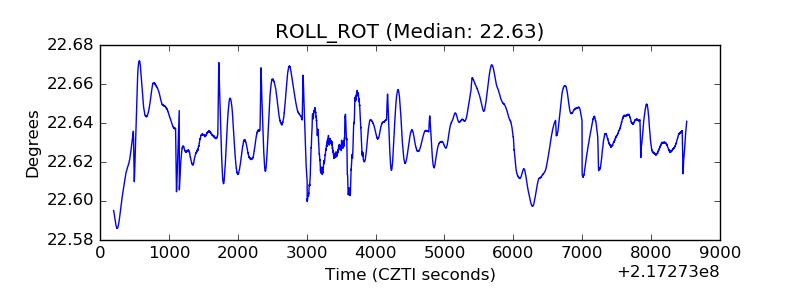 |
| _Roll_DEC | 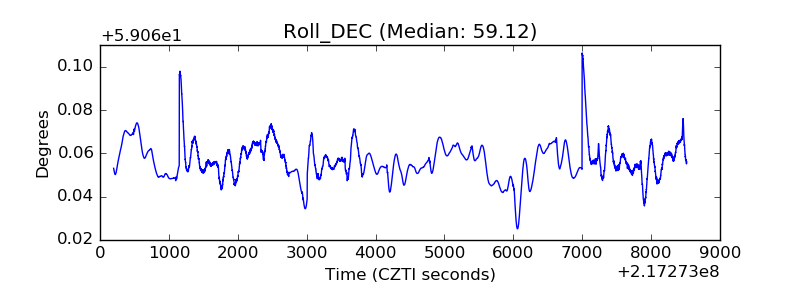 |
| _Roll_RA | 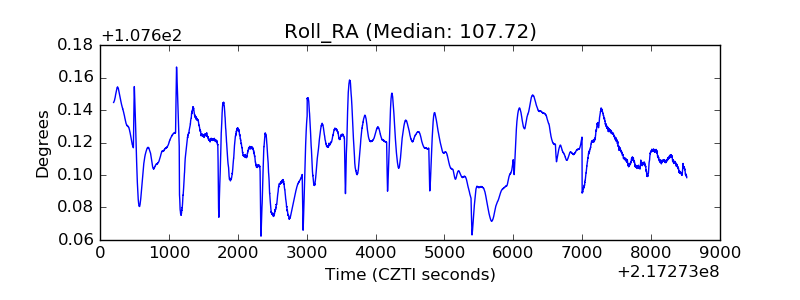 |
| Veto Counter | 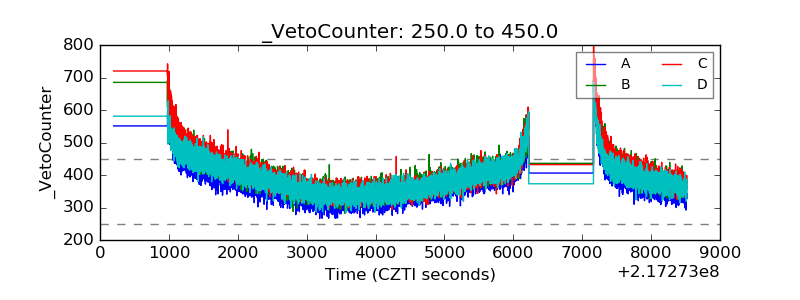 |