| Param | Original file | Final file |
|---|---|---|
| Filename | modeM0/AS1A02_085T02_9000000808_06198cztM0_level2.evt | modeM0/AS1A02_085T02_9000000808_06198cztM0_level2_quad_clean.evt |
| Size (bytes) | 568,607,040 | 107,311,680 |
| Size | 542.3 MB | 102.3 MB |
| Events in quadrant A | 3,842,115 | 675,351 |
| Events in quadrant B | 4,214,062 | 681,107 |
| Events in quadrant C | 3,689,836 | 685,249 |
| Events in quadrant D | 4,932,188 | 652,911 |
| Mode SS | |||
|---|---|---|---|
| Quadrant | BADHDUFLAG | Total packets | Discarded packets |
| A | 0 | 166 | 0 |
| B | 0 | 166 | 2 |
| C | 0 | 166 | 0 |
| D | 0 | 166 | 0 |
| Mode M9 | |||
|---|---|---|---|
| Quadrant | BADHDUFLAG | Total packets | Discarded packets |
| A | 0 | 14 | 0 |
| B | 0 | 14 | 0 |
| C | 0 | 14 | 0 |
| D | 0 | 14 | 1 |
| Mode M0 | |||
|---|---|---|---|
| Quadrant | BADHDUFLAG | Total packets | Discarded packets |
| A | 0 | 17044 | 30 |
| B | 0 | 18099 | 27 |
| C | 0 | 16666 | 27 |
| D | 0 | 20451 | 37 |
| Quadrant | Total seconds | Saturated seconds | Saturation percentage |
|---|---|---|---|
| A | 7982 | 111 | 1.390629% |
| B | 7984 | 151 | 1.891283% |
| C | 7983 | 61 | 0.764124% |
| D | 7982 | 172 | 2.154848% |
Noise dominated data is calculated using 1-second bins in cleaned event files. If a bin has >2000 counts, and if more than 50% of those come from <1% of pixels, then it is considered to be noise-dominated and hence unusable.
| Quadrant | # 1 sec bins | Bins with >0 counts | Bins with >2000 counts | High rate bins dominated by noise | Noise dominated (total time) | Noise dominated (detector-on time) | Marked lightcurve |
|---|---|---|---|---|---|---|---|
| A | 9444 | 7996 | 0 | 0 | 0.00% | 0.00% |  |
| B | 9444 | 7996 | 34 | 34 | 0.36% | 0.43% | 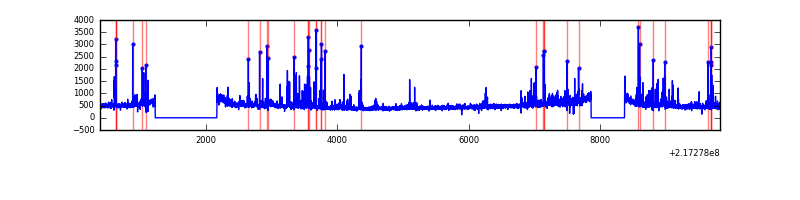 |
| C | 9444 | 7996 | 0 | 0 | 0.00% | 0.00% | 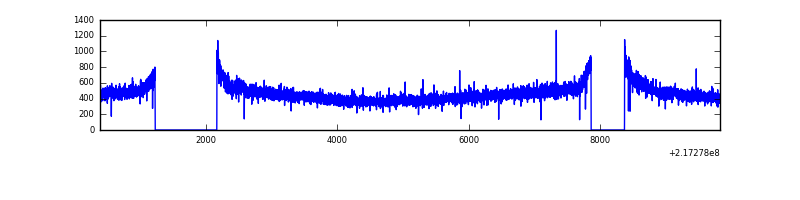 |
| D | 9444 | 7996 | 66 | 66 | 0.70% | 0.83% | 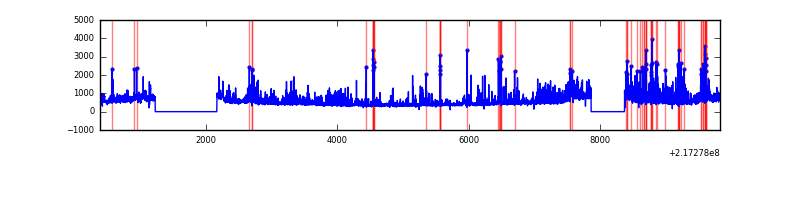 |
Top three noisy pixels from each quadrant. If the there are fewer than three noisy pixels in the level2.evt file, extra rows are filled as -1
| Pixel properties | Quadrant properties | ||||||
|---|---|---|---|---|---|---|---|
| Quadrant | DetID | PixID | Counts | Sigma | Mean | Median | Sigma |
| A | 8 | 15 | 82353 | 425.26 | 938 | 917 | 191.5 |
| A | 4 | 2 | 64833 | 333.77 | 938 | 917 | 191.5 |
| A | 14 | 111 | 44846 | 229.4 | 938 | 917 | 191.5 |
| B | 3 | 64 | 331300 | 1829.18 | 947 | 926 | 180.6 |
| B | 0 | 214 | 76570 | 418.82 | 947 | 926 | 180.6 |
| B | 4 | 81 | 29974 | 160.83 | 947 | 926 | 180.6 |
| C | 1 | 16 | 76311 | 353.99 | 923 | 928 | 213.0 |
| C | 13 | 61 | 7407 | 30.42 | 923 | 928 | 213.0 |
| C | 8 | 128 | 5261 | 20.35 | 923 | 928 | 213.0 |
| D | 2 | 63 | 1137523 | 5070.45 | 916 | 884 | 224.2 |
| D | 5 | 97 | 165569 | 734.65 | 916 | 884 | 224.2 |
| D | 8 | 195 | 70713 | 311.5 | 916 | 884 | 224.2 |
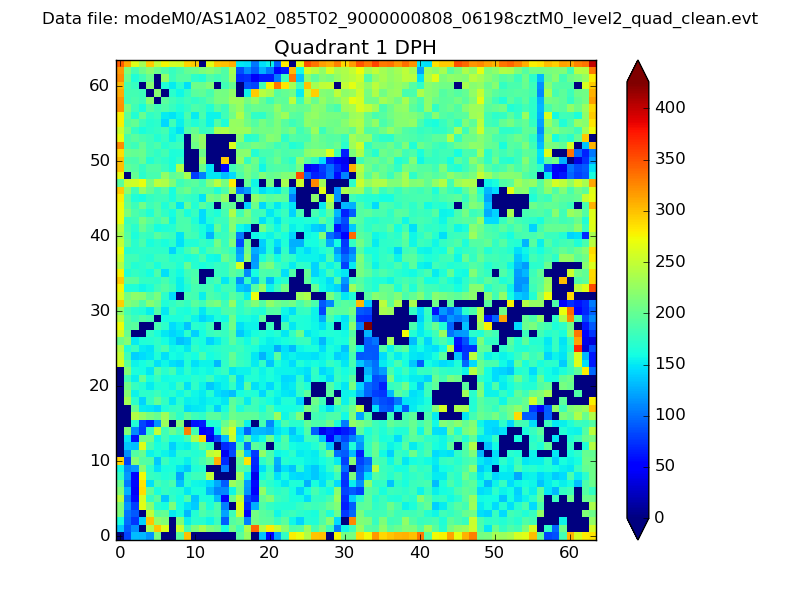
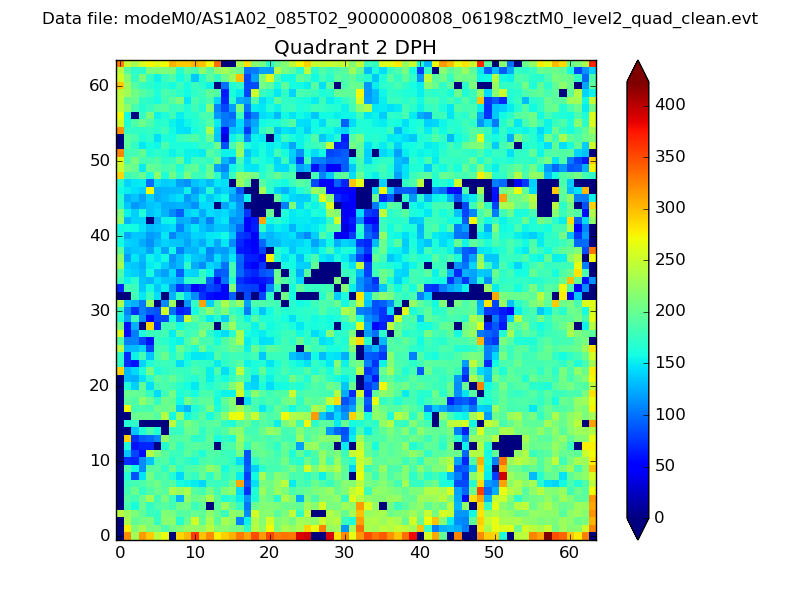
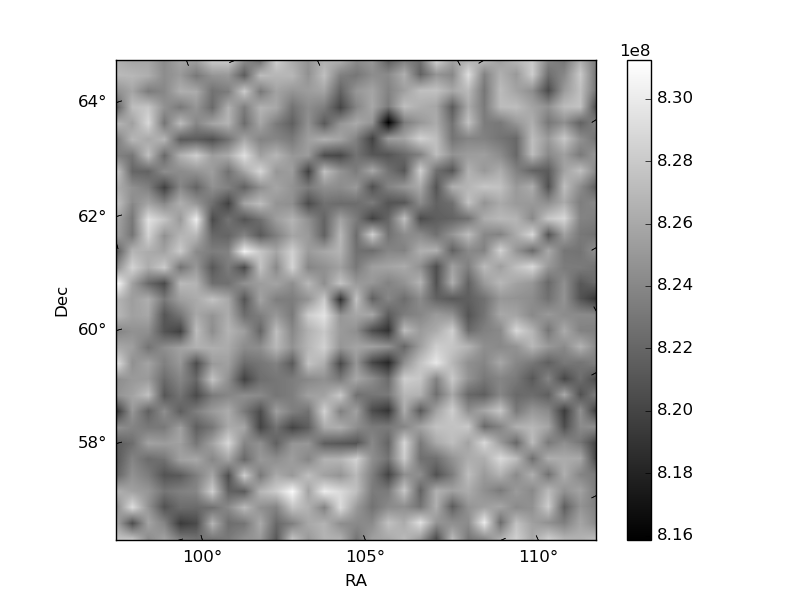
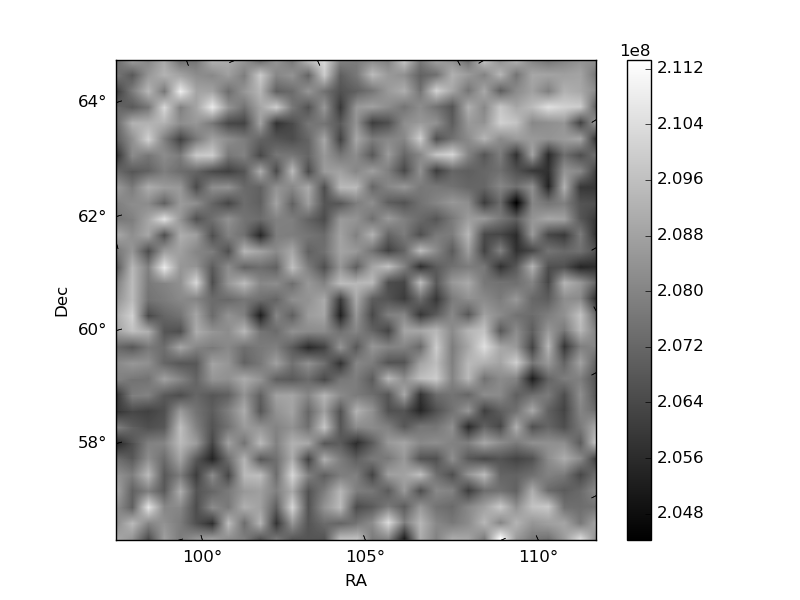
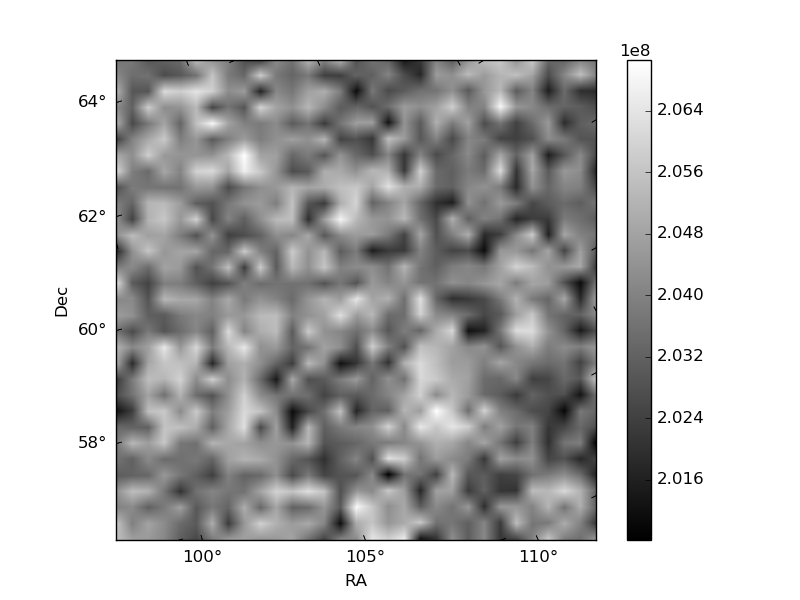
Histogram calculated using DETX and DETY for each event in the final _common_clean file
| Quadrant A | 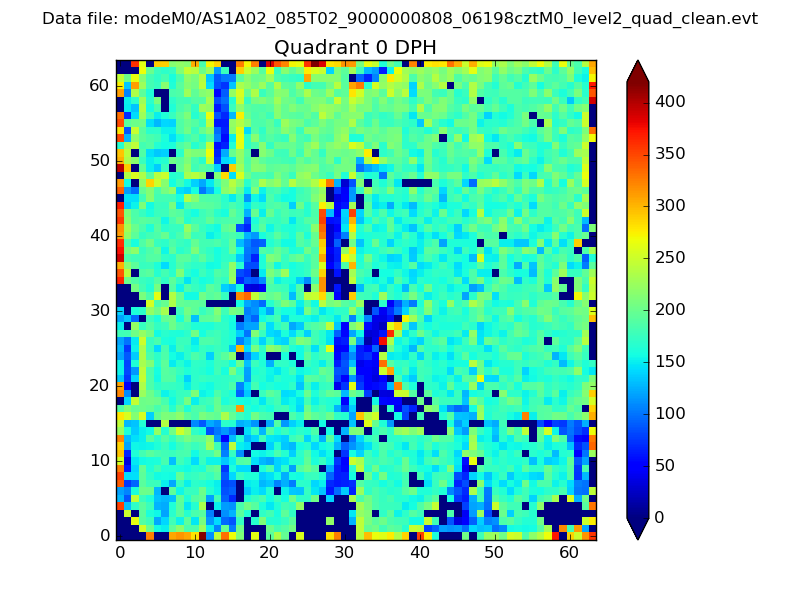 |
 |
Quadrant B |
|---|---|---|---|
| Quadrant D | 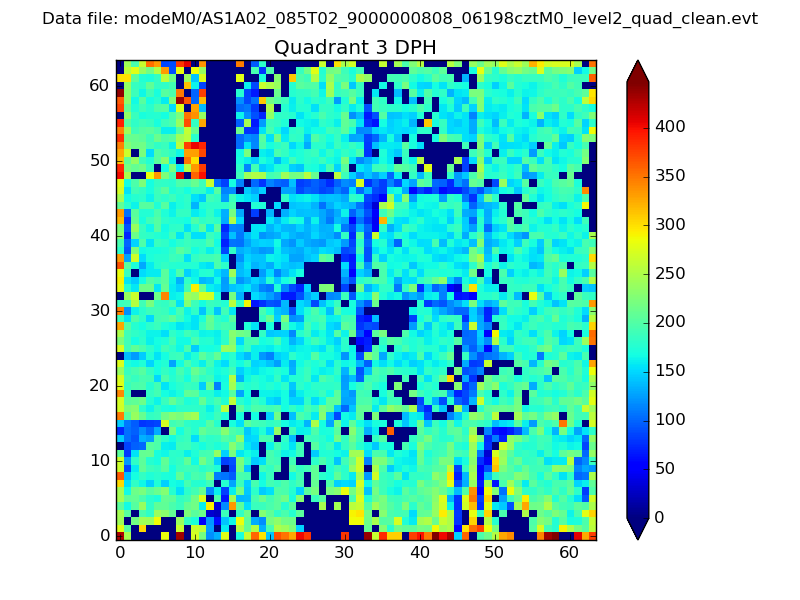 |
 |
Quadrant C |
| Plot type | Count rate plots | Images |
|---|---|---|
| Comparison with Poisson distribution Blue bars denote a histogram of data divided into 1 sec bins. Red curve is a Poisson curve with rate = median count rate of data. |
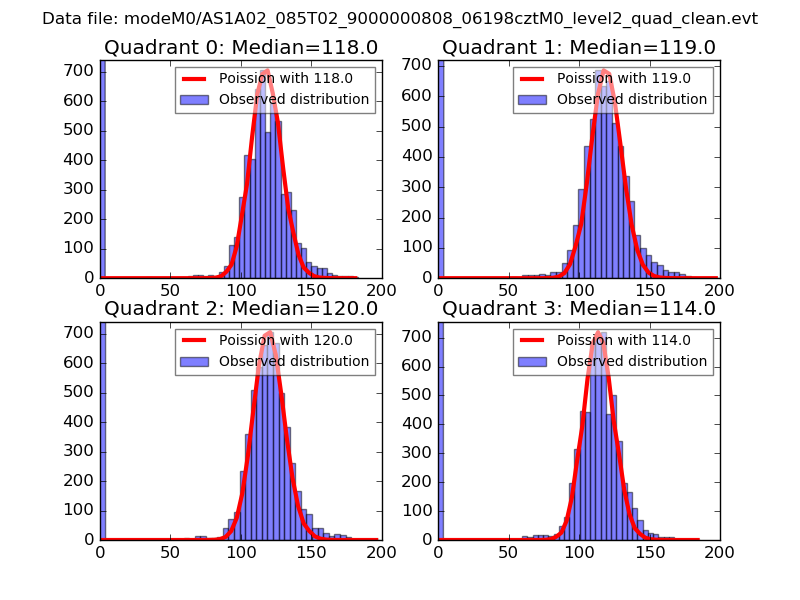 |
 |
| Quadrant-wise count rates Data is divided into 100 sec bins |
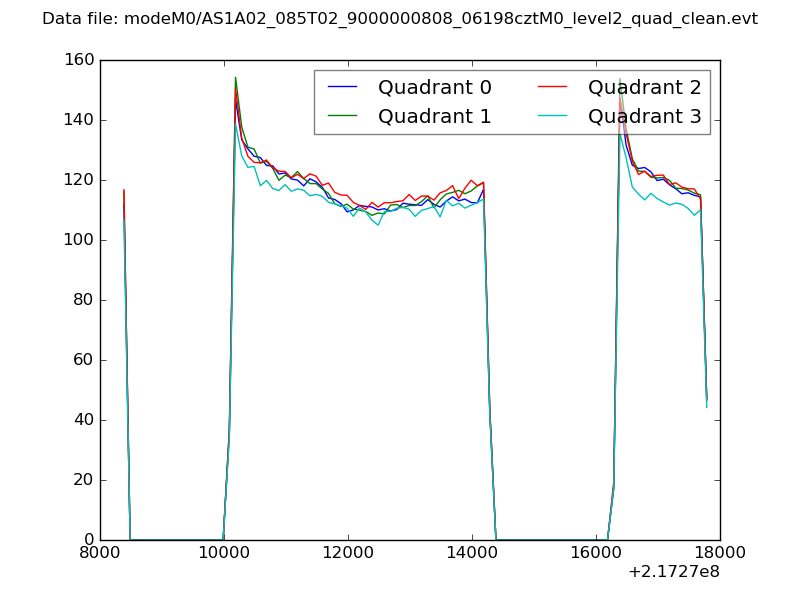 |
|
| Module-wise count rates for Quadrant A Data is divided into 100 sec bins |
 |
 |
| Module-wise count rates for Quadrant B Data is divided into 100 sec bins |
 |
 |
| Module-wise count rates for Quadrant C Data is divided into 100 sec bins |
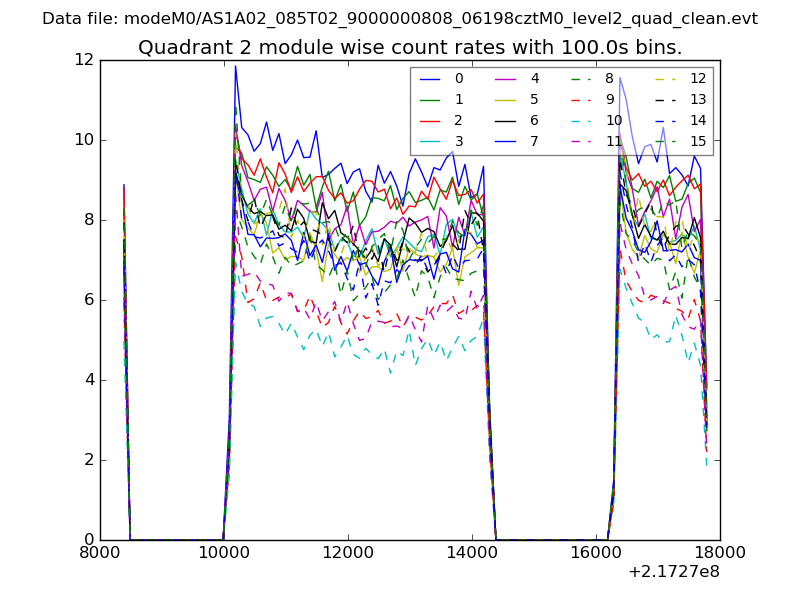 |
 |
| Module-wise count rates for Quadrant D Data is divided into 100 sec bins |
 |
 |
| Parameter | Plot |
|---|---|
| CZT HV Monitor | 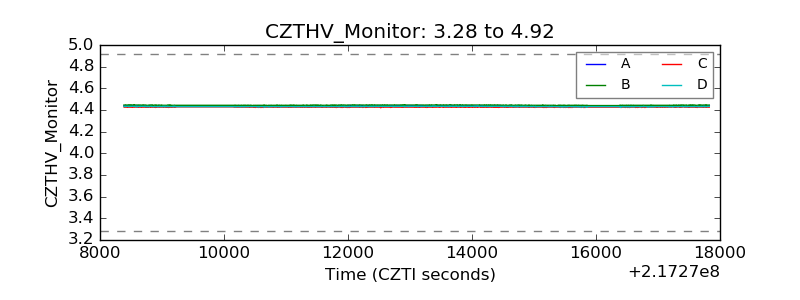 |
| D_VDD | 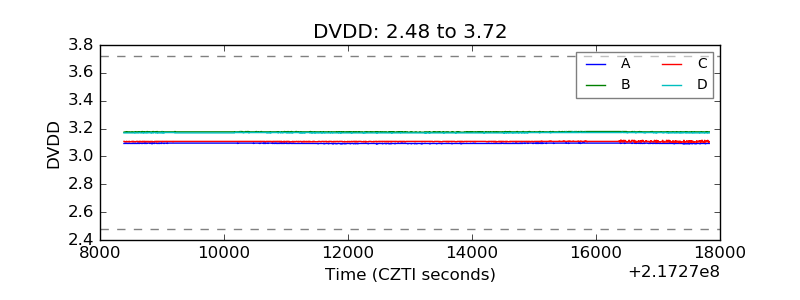 |
| Temperature 1 | 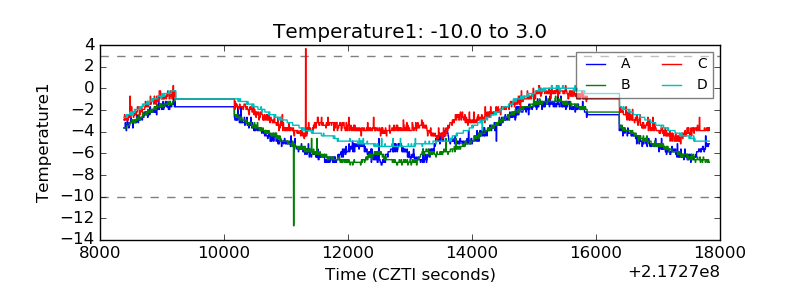 |
| Veto HV Monitor | 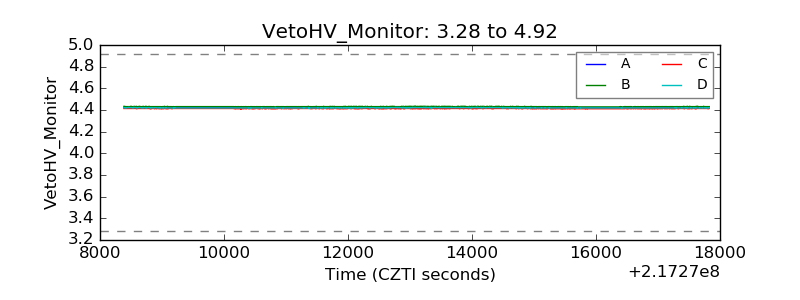 |
| Veto LLD | 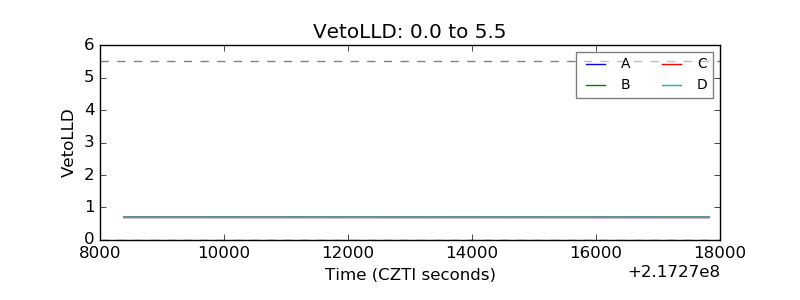 |
| Alpha Counter | 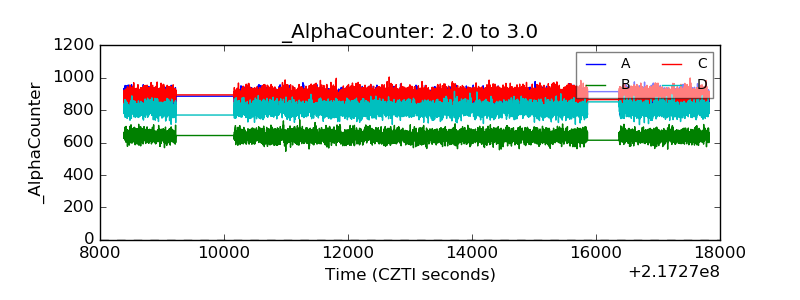 |
| _CPM_Rate | 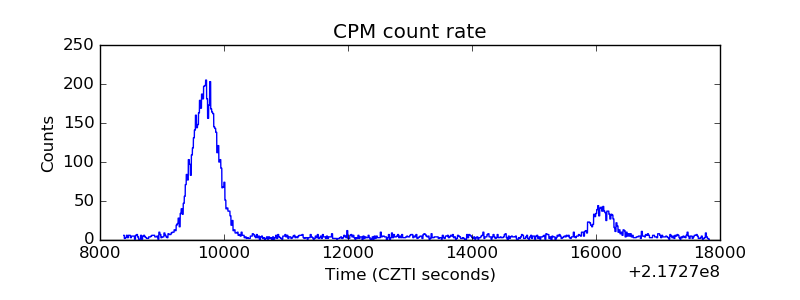 |
| CZT Counter | 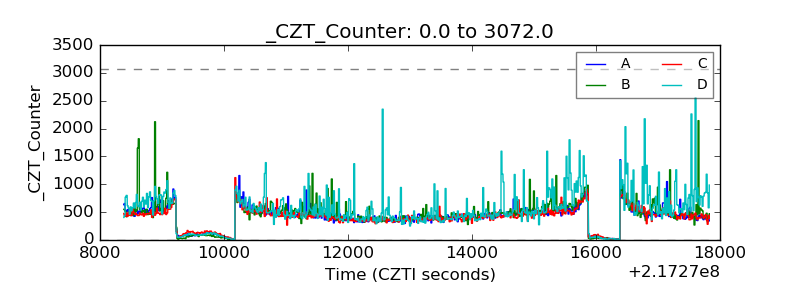 |
| +2.5 Volts monitor |  |
| +5 Volts monitor |  |
| _ROLL_ROT |  |
| _Roll_DEC | 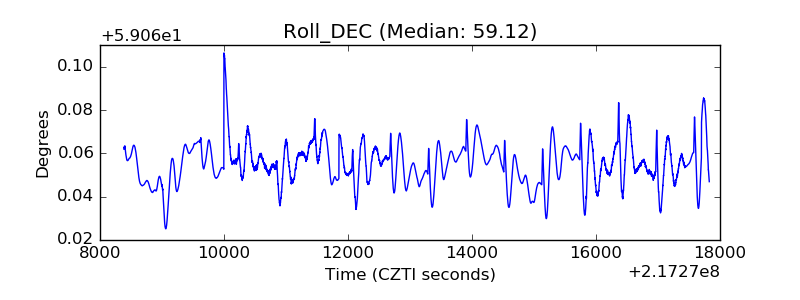 |
| _Roll_RA | 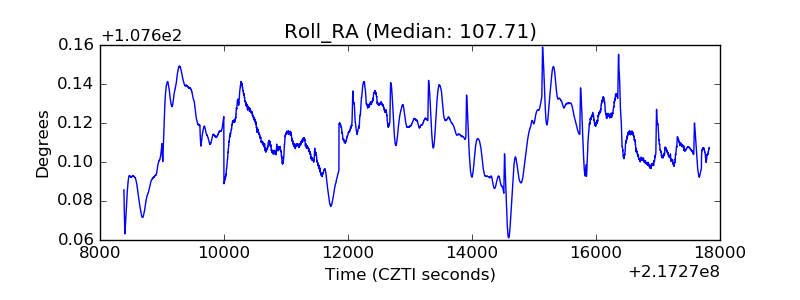 |
| Veto Counter | 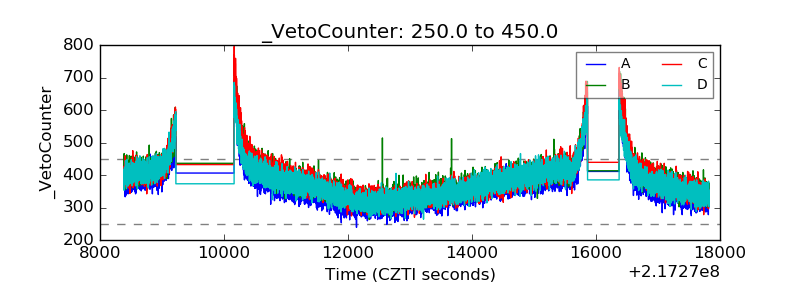 |