| Param | Original file | Final file |
|---|---|---|
| Filename | modeM0/AS1A02_085T02_9000000808_06206cztM0_level2.evt | modeM0/AS1A02_085T02_9000000808_06206cztM0_level2_quad_clean.evt |
| Size (bytes) | 886,780,800 | 176,987,520 |
| Size | 845.7 MB | 168.8 MB |
| Events in quadrant A | 5,877,594 | 1,128,962 |
| Events in quadrant B | 7,685,950 | 1,111,877 |
| Events in quadrant C | 5,718,028 | 1,142,096 |
| Events in quadrant D | 6,704,078 | 1,089,019 |
| Mode SS | |||
|---|---|---|---|
| Quadrant | BADHDUFLAG | Total packets | Discarded packets |
| A | 0 | 264 | 0 |
| B | 0 | 264 | 0 |
| C | 0 | 264 | 0 |
| D | 0 | 264 | 0 |
| Mode M9 | |||
|---|---|---|---|
| Quadrant | BADHDUFLAG | Total packets | Discarded packets |
| A | 0 | 4 | 0 |
| B | 0 | 4 | 0 |
| C | 0 | 4 | 0 |
| D | 0 | 4 | 0 |
| Mode M0 | |||
|---|---|---|---|
| Quadrant | BADHDUFLAG | Total packets | Discarded packets |
| A | 0 | 26668 | 2 |
| B | 0 | 32034 | 2 |
| C | 0 | 26452 | 2 |
| D | 0 | 29236 | 2 |
| Quadrant | Total seconds | Saturated seconds | Saturation percentage |
|---|---|---|---|
| A | 12851 | 66 | 0.513579% |
| B | 12851 | 763 | 5.937281% |
| C | 12851 | 47 | 0.365730% |
| D | 12851 | 153 | 1.190569% |
Noise dominated data is calculated using 1-second bins in cleaned event files. If a bin has >2000 counts, and if more than 50% of those come from <1% of pixels, then it is considered to be noise-dominated and hence unusable.
| Quadrant | # 1 sec bins | Bins with >0 counts | Bins with >2000 counts | High rate bins dominated by noise | Noise dominated (total time) | Noise dominated (detector-on time) | Marked lightcurve |
|---|---|---|---|---|---|---|---|
| A | 13226 | 12854 | 6 | 6 | 0.05% | 0.05% | 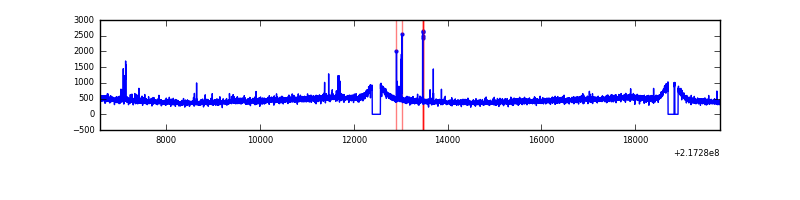 |
| B | 13226 | 12854 | 367 | 367 | 2.77% | 2.86% | 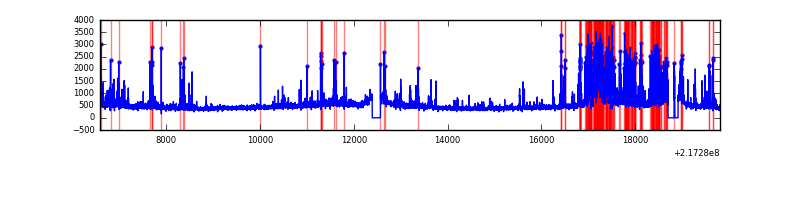 |
| C | 13226 | 12854 | 0 | 0 | 0.00% | 0.00% | 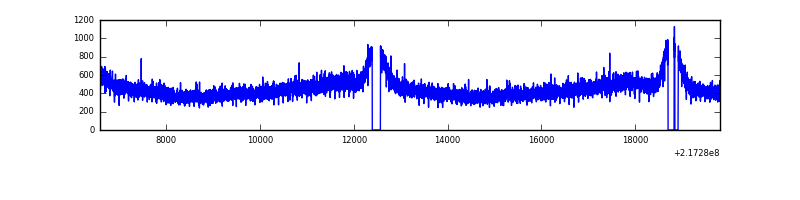 |
| D | 13226 | 12854 | 62 | 62 | 0.47% | 0.48% | 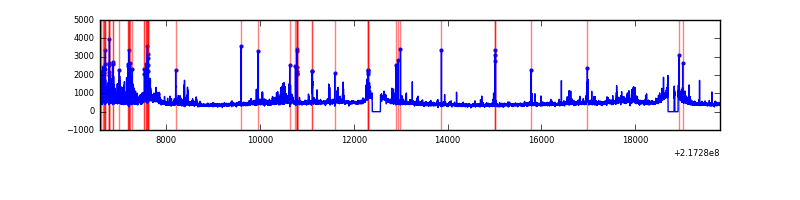 |
Top three noisy pixels from each quadrant. If the there are fewer than three noisy pixels in the level2.evt file, extra rows are filled as -1
| Pixel properties | Quadrant properties | ||||||
|---|---|---|---|---|---|---|---|
| Quadrant | DetID | PixID | Counts | Sigma | Mean | Median | Sigma |
| A | 8 | 15 | 89541 | 292.72 | 1479 | 1444 | 301.0 |
| A | 4 | 2 | 58222 | 188.66 | 1479 | 1444 | 301.0 |
| A | 13 | 251 | 19885 | 61.27 | 1479 | 1444 | 301.0 |
| B | 3 | 64 | 1693280 | 6068.85 | 1457 | 1420 | 278.8 |
| B | 0 | 214 | 103828 | 367.35 | 1457 | 1420 | 278.8 |
| B | 0 | 219 | 97254 | 343.76 | 1457 | 1420 | 278.8 |
| C | 1 | 16 | 26556 | 75.13 | 1450 | 1456 | 334.1 |
| C | 8 | 128 | 15461 | 41.92 | 1450 | 1456 | 334.1 |
| C | 13 | 61 | 11678 | 30.6 | 1450 | 1456 | 334.1 |
| D | 2 | 63 | 607243 | 1708.72 | 1442 | 1394 | 354.6 |
| D | 5 | 97 | 167694 | 469.03 | 1442 | 1394 | 354.6 |
| D | 2 | 14 | 128418 | 358.25 | 1442 | 1394 | 354.6 |
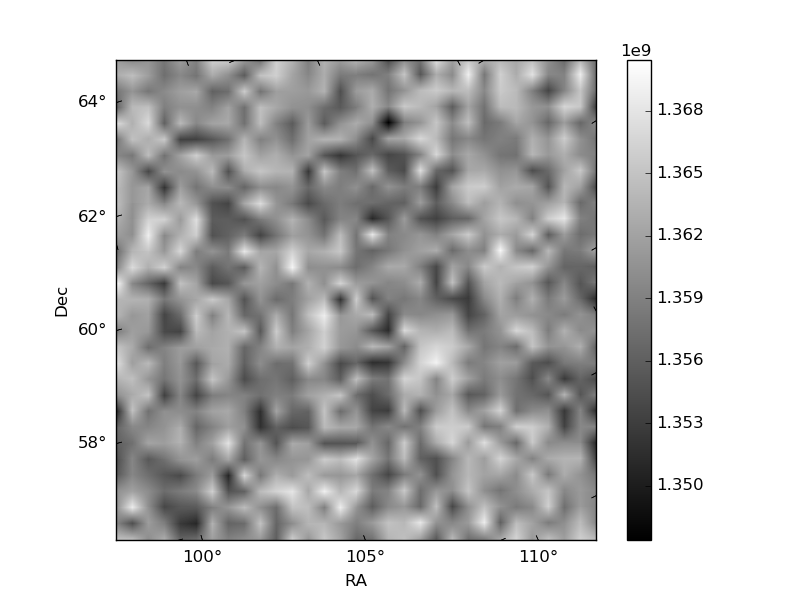
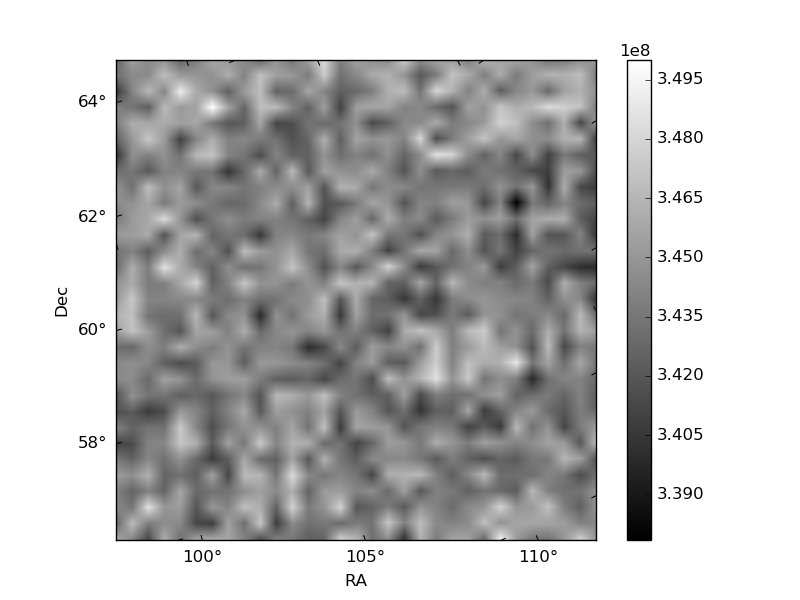
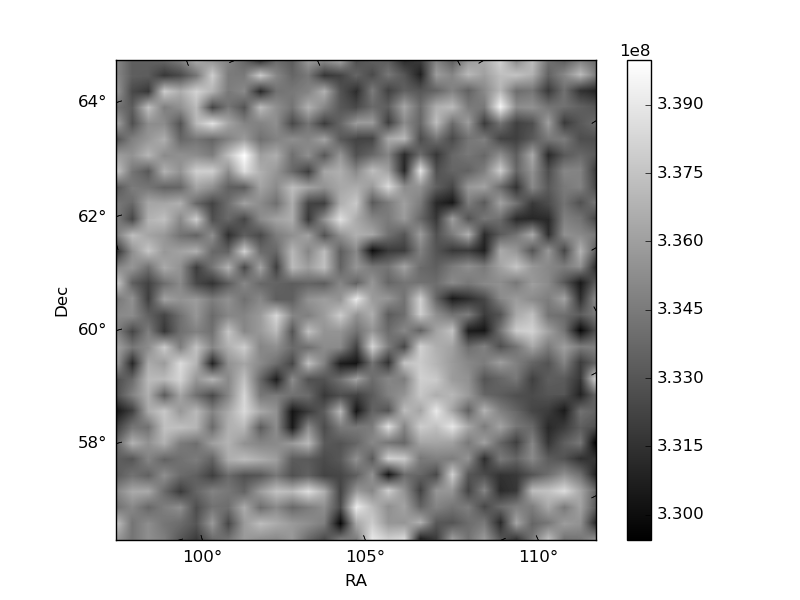
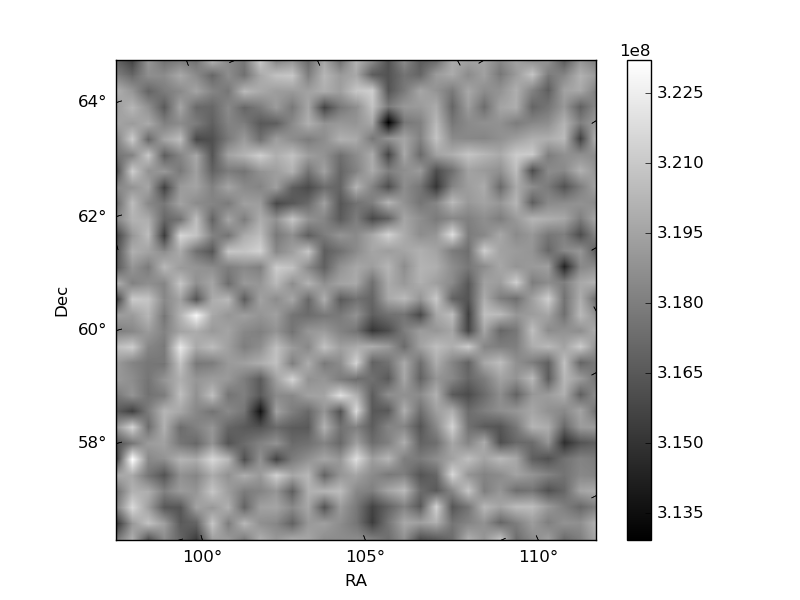
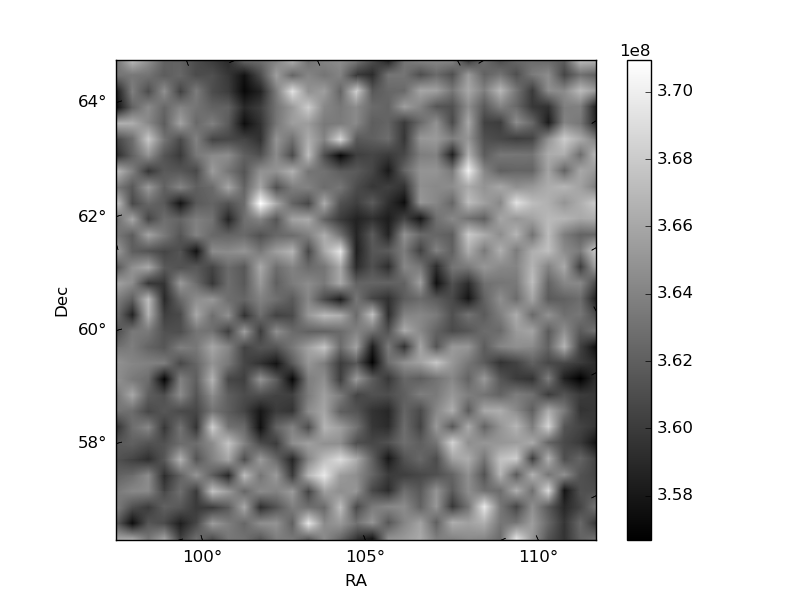
Histogram calculated using DETX and DETY for each event in the final _common_clean file
| Quadrant A | 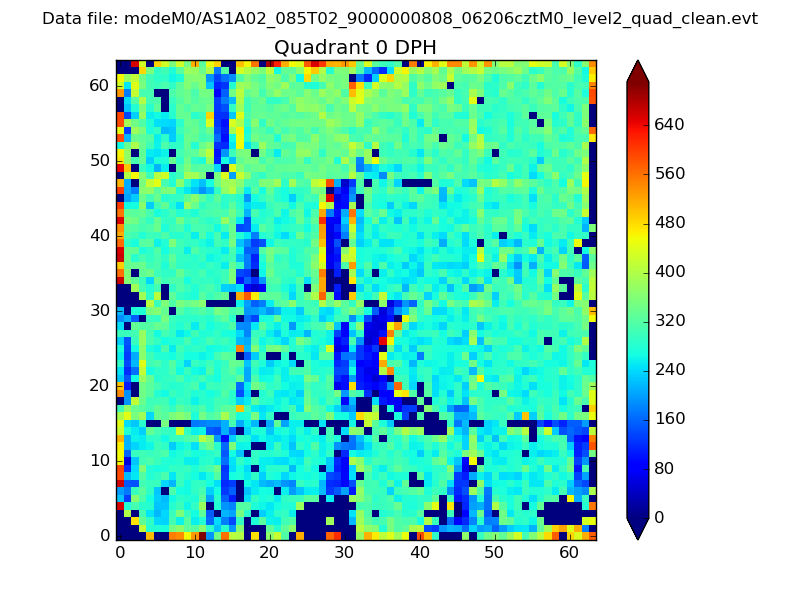 |
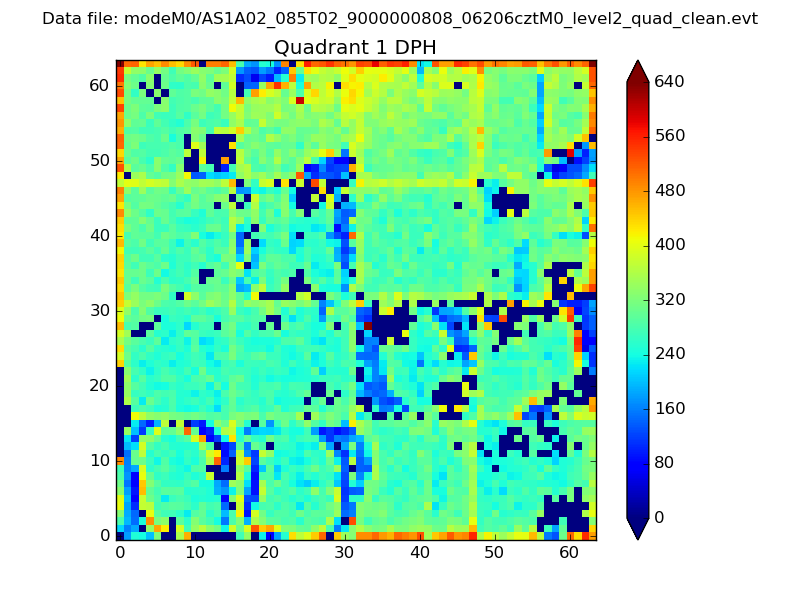 |
Quadrant B |
|---|---|---|---|
| Quadrant D | 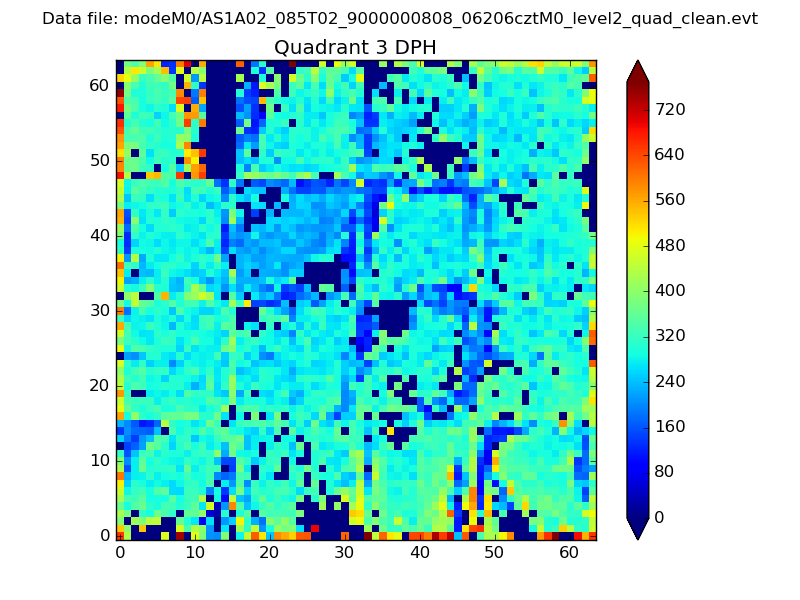 |
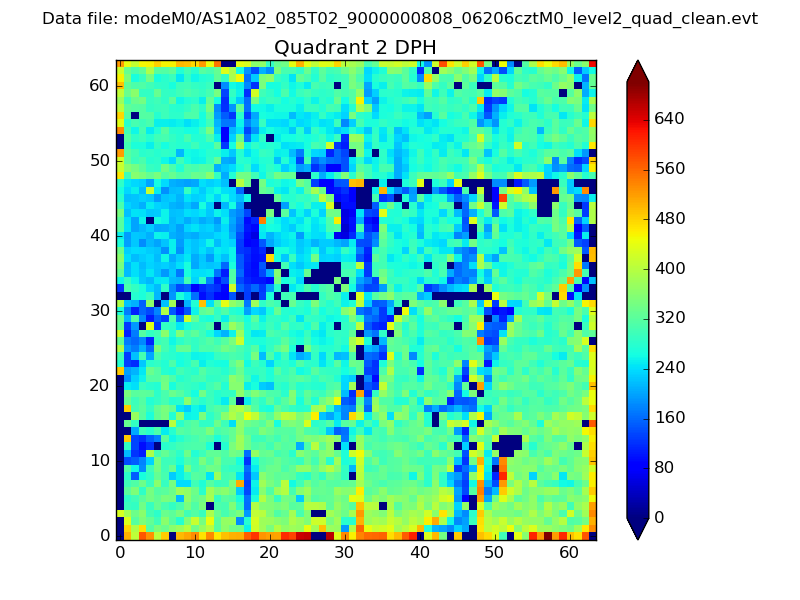 |
Quadrant C |
| Plot type | Count rate plots | Images |
|---|---|---|
| Comparison with Poisson distribution Blue bars denote a histogram of data divided into 1 sec bins. Red curve is a Poisson curve with rate = median count rate of data. |
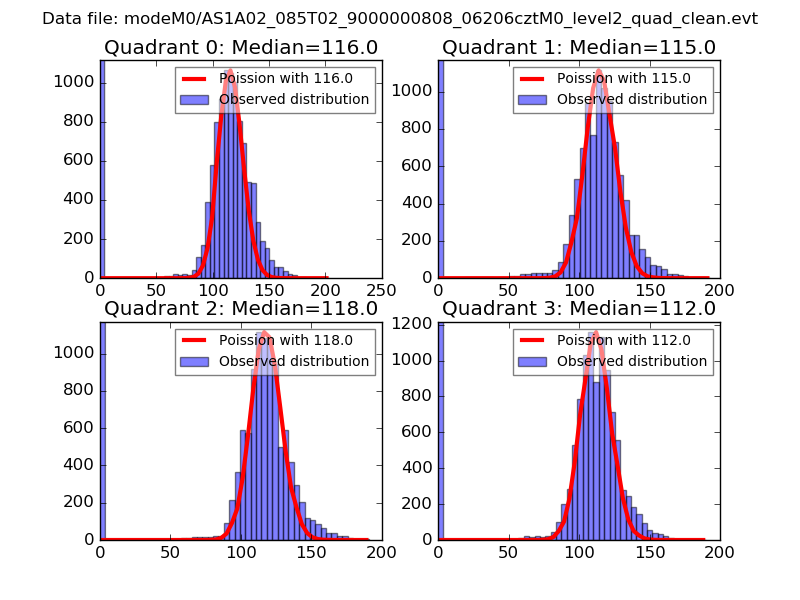 |
 |
| Quadrant-wise count rates Data is divided into 100 sec bins |
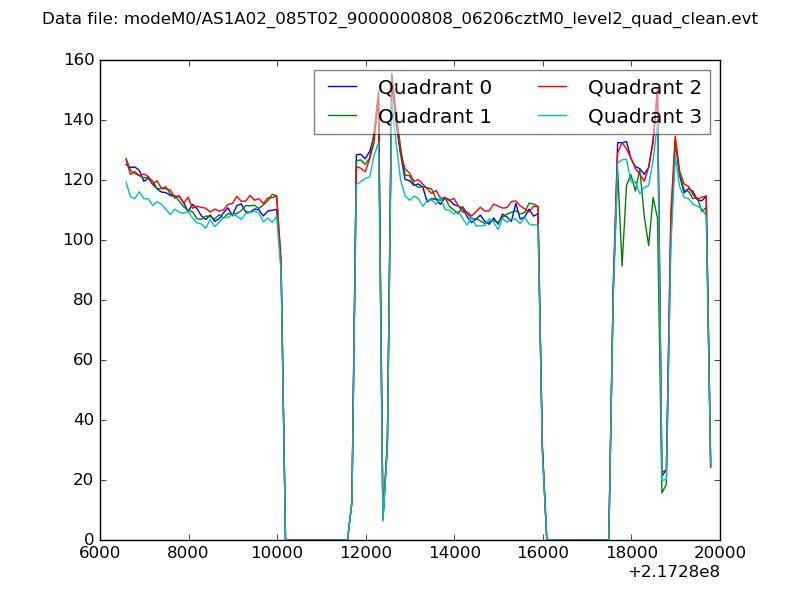 |
|
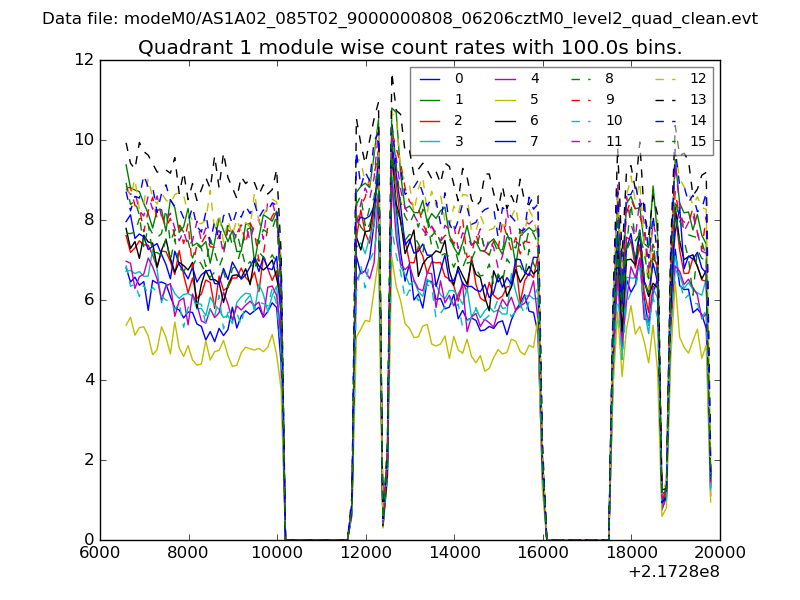
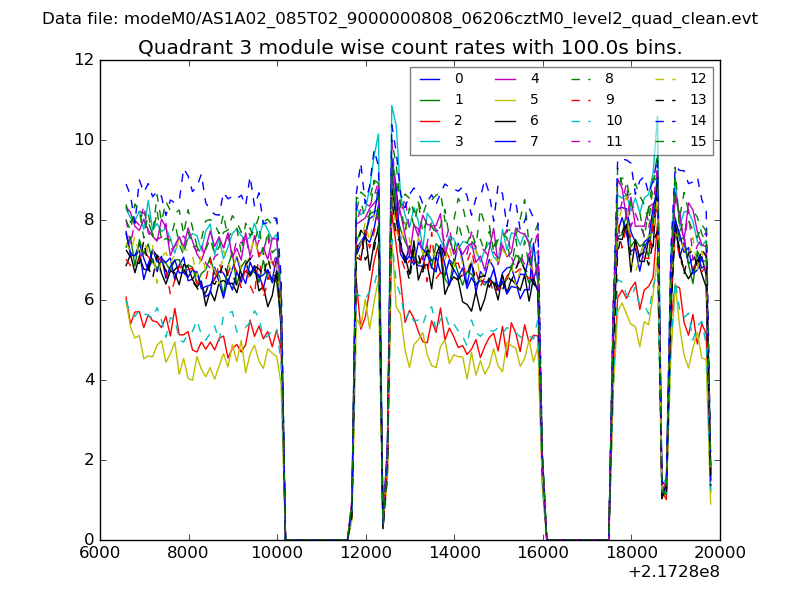
| Module-wise count rates for Quadrant A Data is divided into 100 sec bins |
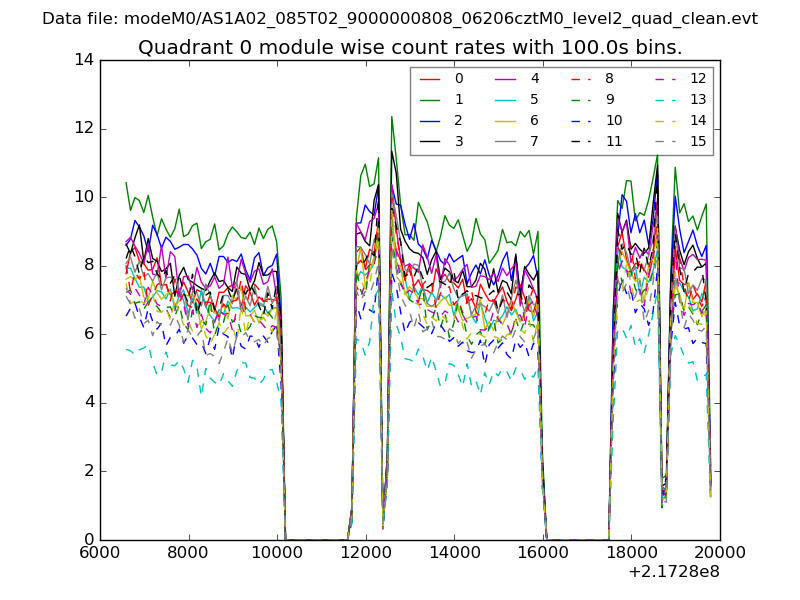 |
 |
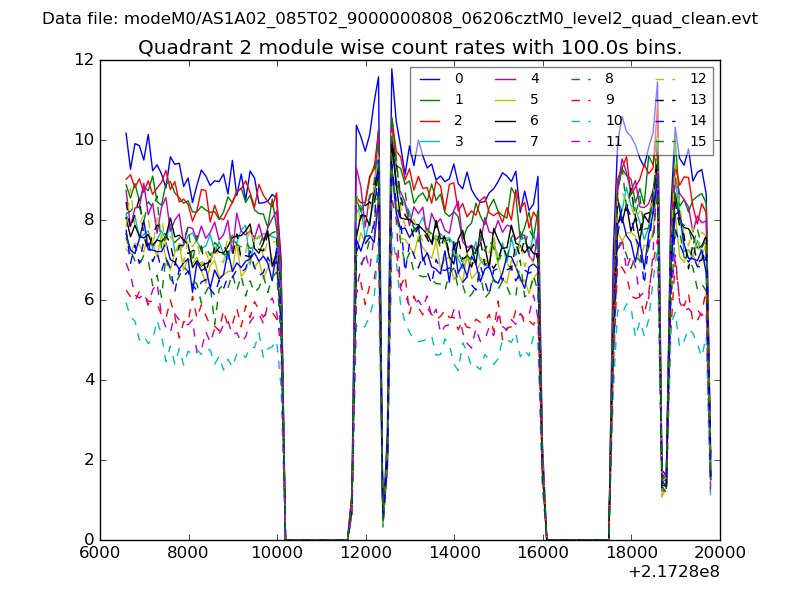
| Module-wise count rates for Quadrant B Data is divided into 100 sec bins |
 |
 |
| Module-wise count rates for Quadrant C Data is divided into 100 sec bins |
 |
 |
| Module-wise count rates for Quadrant D Data is divided into 100 sec bins |
 |
 |
| Parameter | Plot |
|---|---|
| CZT HV Monitor | 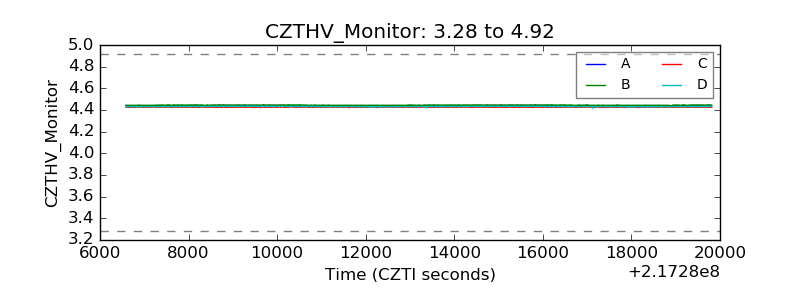 |
| D_VDD | 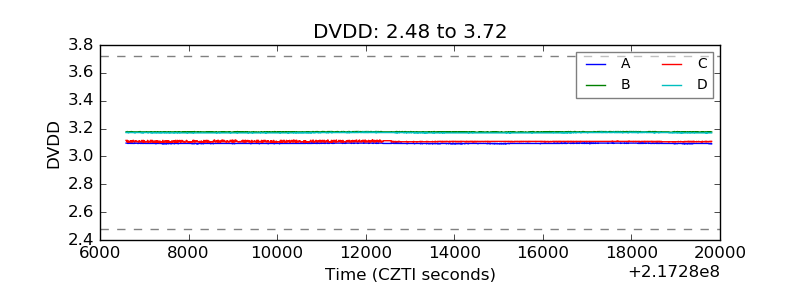 |
| Temperature 1 | 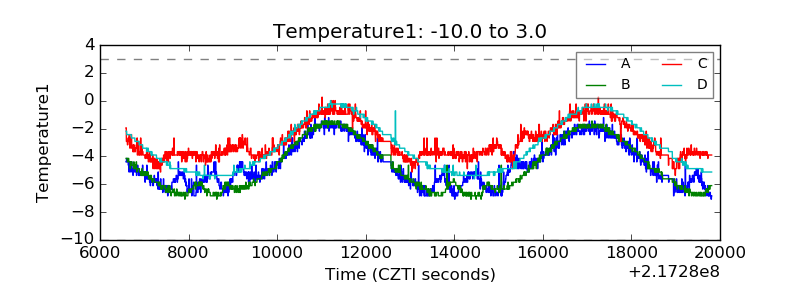 |
| Veto HV Monitor | 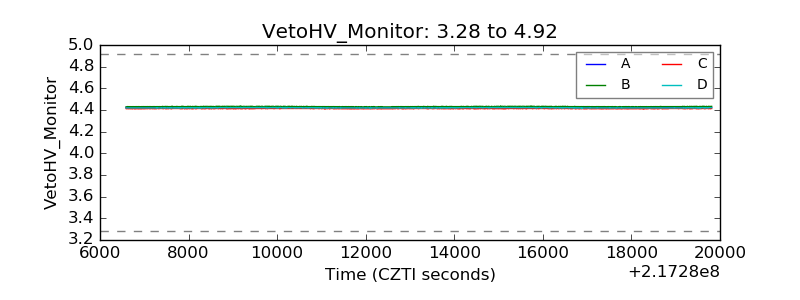 |
| Veto LLD | 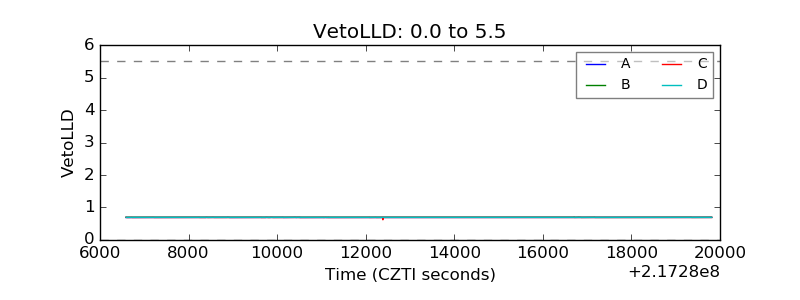 |
| Alpha Counter | 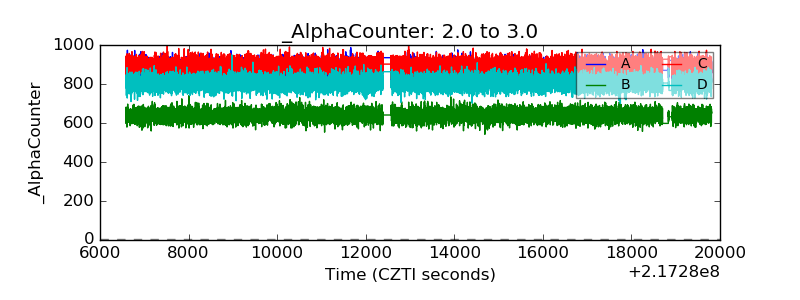 |
| _CPM_Rate | 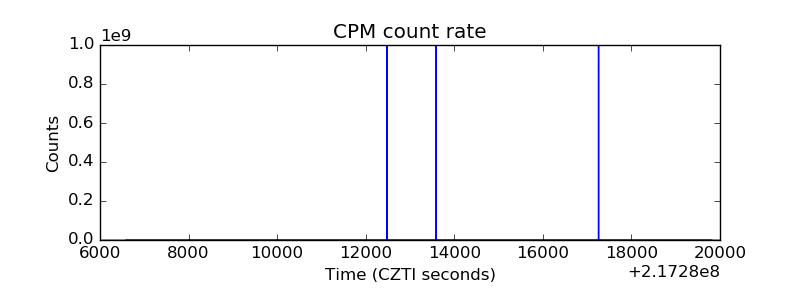 |
| CZT Counter | 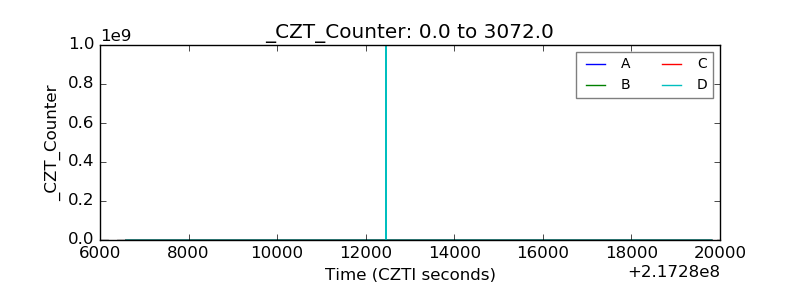 |
| +2.5 Volts monitor | 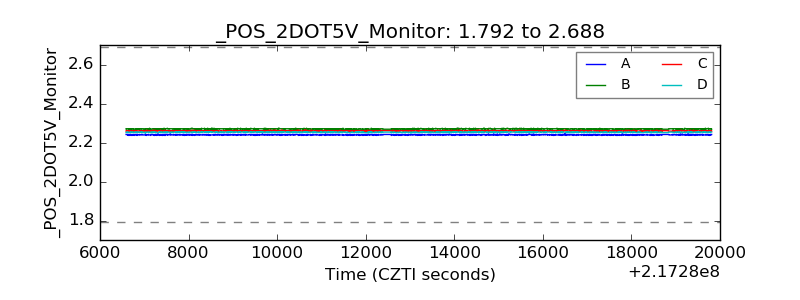 |
| +5 Volts monitor | 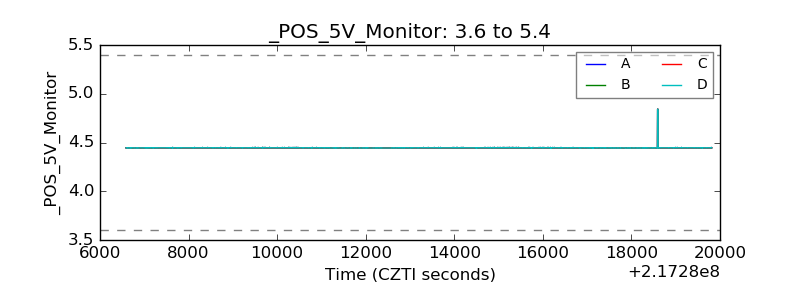 |
| _ROLL_ROT | 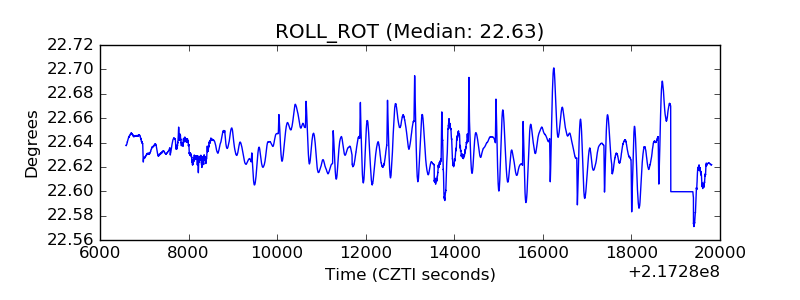 |
| _Roll_DEC | 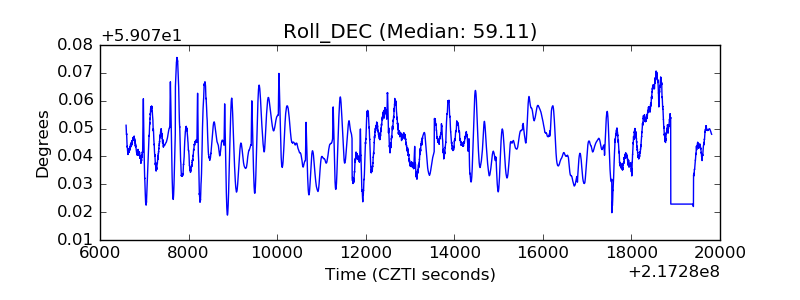 |
| _Roll_RA | 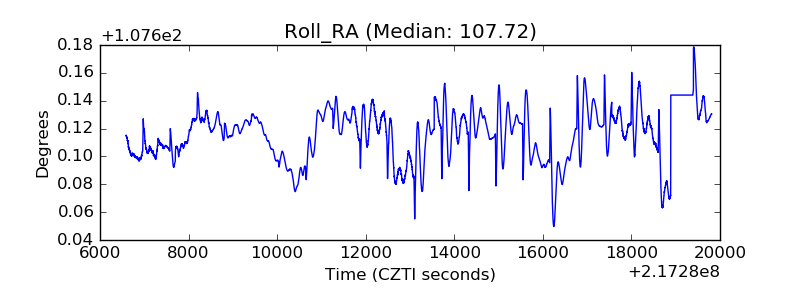 |
| Veto Counter | 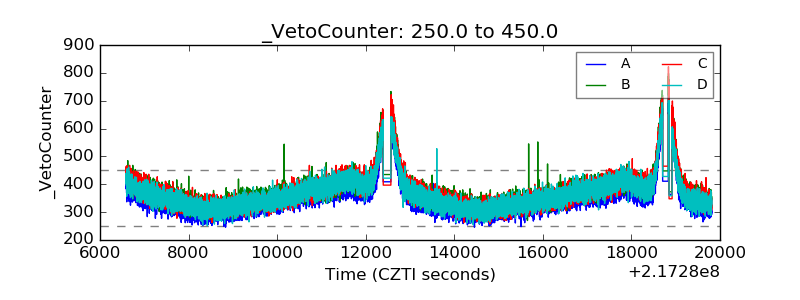 |