| Param | Original file | Final file |
|---|---|---|
| Filename | modeM0/AS1G06_103T01_9000000812cztM0_level2.fits | modeM0/AS1G06_103T01_9000000812cztM0_level2_quad_clean.evt |
| Size (bytes) | 731,422,080 | 752,319,360 |
| Size | 697.5 MB | 717.5 MB |
| Events in quadrant A | 4,343,006 | 4,502,283 |
| Events in quadrant B | 4,252,382 | 4,540,344 |
| Events in quadrant C | 4,333,654 | 4,312,590 |
| Events in quadrant D | 3,750,508 | 3,958,882 |
| Mode SS | |||
|---|---|---|---|
| Quadrant | BADHDUFLAG | Total packets | Discarded packets |
| A | 0 | 1622 | 0 |
| B | 0 | 1630 | 0 |
| C | 0 | 1632 | 0 |
| D | 0 | 1626 | 0 |
| Mode M9 | |||
|---|---|---|---|
| Quadrant | BADHDUFLAG | Total packets | Discarded packets |
| A | 0 | 124 | 0 |
| B | 0 | 127 | 0 |
| C | 0 | 125 | 0 |
| D | 0 | 126 | 0 |
| Mode M0 | |||
|---|---|---|---|
| Quadrant | BADHDUFLAG | Total packets | Discarded packets |
| A | 0 | 169689 | 0 |
| B | 0 | 167874 | 0 |
| C | 0 | 162888 | 0 |
| D | 0 | 168353 | 0 |
| Quadrant | Total seconds | Saturated seconds | Saturation percentage |
|---|---|---|---|
| A | 79747 | 887 | 1.112268% |
| B | 79731 | 1055 | 1.323199% |
| C | 79797 | 532 | 0.666692% |
| D | 79837 | 671 | 0.840462% |
Noise dominated data is calculated using 1-second bins in cleaned event files. If a bin has >2000 counts, and if more than 50% of those come from <1% of pixels, then it is considered to be noise-dominated and hence unusable.
| Quadrant | # 1 sec bins | Bins with >0 counts | Bins with >2000 counts | High rate bins dominated by noise | Noise dominated (total time) | Noise dominated (detector-on time) | Marked lightcurve |
|---|---|---|---|---|---|---|---|
| A | 100084 | 80665 | 0 | 0 | 0.00% | 0.00% |  |
| B | 100084 | 80610 | 0 | 0 | 0.00% | 0.00% |  |
| C | 100084 | 80675 | 0 | 0 | 0.00% | 0.00% |  |
| D | 100084 | 80678 | 0 | 0 | 0.00% | 0.00% |  |
Top three noisy pixels from each quadrant. If the there are fewer than three noisy pixels in the level2.evt file, extra rows are filled as -1
| Pixel properties | Quadrant properties | ||||||
|---|---|---|---|---|---|---|---|
| Quadrant | DetID | PixID | Counts | Sigma | Mean | Median | Sigma |
| A | 14 | 188 | 4459 | 12.1 | 1129 | 1055 | 281.4 |
| A | 0 | 29 | 4363 | 11.75 | 1129 | 1055 | 281.4 |
| A | 14 | 204 | 3851 | 9.94 | 1129 | 1055 | 281.4 |
| B | 2 | 9 | 3635 | 11.35 | 1121 | 1063 | 226.6 |
| B | 12 | 226 | 2960 | 8.37 | 1121 | 1063 | 226.6 |
| B | 14 | 254 | 2918 | 8.19 | 1121 | 1063 | 226.6 |
| C | 12 | 241 | 3135 | 6.86 | 1142 | 1054 | 303.1 |
| C | 1 | 81 | 3128 | 6.84 | 1142 | 1054 | 303.1 |
| C | 1 | 80 | 3107 | 6.77 | 1142 | 1054 | 303.1 |
| D | 3 | 14 | 2805 | 6.32 | 1070 | 968 | 290.8 |
| D | 7 | 5 | 2751 | 6.13 | 1070 | 968 | 290.8 |
| D | 6 | 231 | 2736 | 6.08 | 1070 | 968 | 290.8 |
Histogram calculated using DETX and DETY for each event in the final _common_clean file
| Quadrant A |  |
 |
Quadrant B |
|---|---|---|---|
| Quadrant D |  |
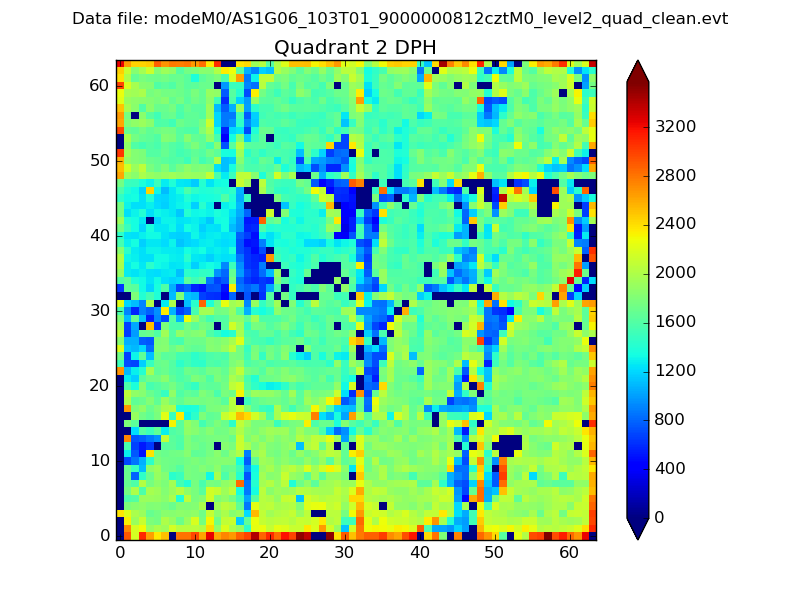 |
Quadrant C |
| Plot type | Count rate plots | Images |
|---|---|---|
| Comparison with Poisson distribution Blue bars denote a histogram of data divided into 1 sec bins. Red curve is a Poisson curve with rate = median count rate of data. |
 |
 |
| Quadrant-wise count rates Data is divided into 100 sec bins |
 |
|
| Module-wise count rates for Quadrant A Data is divided into 100 sec bins |
 |
 |
| Module-wise count rates for Quadrant B Data is divided into 100 sec bins |
 |
 |
| Module-wise count rates for Quadrant C Data is divided into 100 sec bins |
 |
 |
| Module-wise count rates for Quadrant D Data is divided into 100 sec bins |
 |
 |
| Parameter | Plot |
|---|---|
| CZT HV Monitor |  |
| D_VDD | 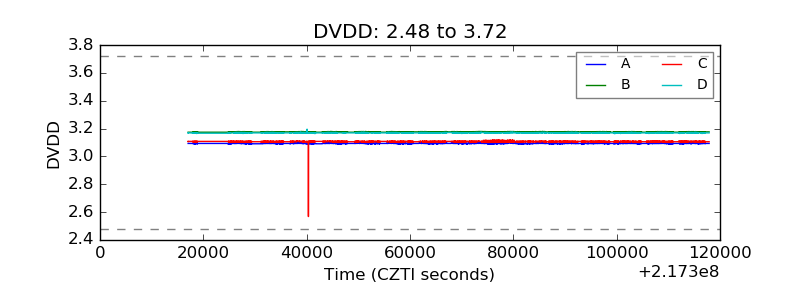 |
| Temperature 1 |  |
| Veto HV Monitor |  |
| Veto LLD |  |
| Alpha Counter |  |
| _CPM_Rate |  |
| CZT Counter |  |
| +2.5 Volts monitor |  |
| +5 Volts monitor |  |
| _ROLL_ROT |  |
| _Roll_DEC |  |
| _Roll_RA |  |
| Veto Counter |  |