| Param | Original file | Final file |
|---|---|---|
| Filename | modeM0/AS1G06_103T01_9000000812_06206cztM0_level2.evt | modeM0/AS1G06_103T01_9000000812_06206cztM0_level2_quad_clean.evt |
| Size (bytes) | 396,947,520 | 83,934,720 |
| Size | 378.6 MB | 80.0 MB |
| Events in quadrant A | 2,886,163 | 531,058 |
| Events in quadrant B | 3,041,908 | 539,051 |
| Events in quadrant C | 2,777,482 | 525,797 |
| Events in quadrant D | 2,888,900 | 508,167 |
| Mode SS | |||
|---|---|---|---|
| Quadrant | BADHDUFLAG | Total packets | Discarded packets |
| A | 0 | 145 | 13 |
| B | 0 | 140 | 10 |
| C | 0 | 143 | 15 |
| D | 0 | 143 | 17 |
| Mode M9 | |||
|---|---|---|---|
| Quadrant | BADHDUFLAG | Total packets | Discarded packets |
| A | 0 | 19 | 7 |
| B | 0 | 19 | 8 |
| C | 0 | 20 | 8 |
| D | 0 | 19 | 8 |
| Mode M0 | |||
|---|---|---|---|
| Quadrant | BADHDUFLAG | Total packets | Discarded packets |
| A | 0 | 14420 | 1699 |
| B | 0 | 14759 | 1694 |
| C | 0 | 14288 | 1592 |
| D | 0 | 14658 | 1608 |
| Quadrant | Total seconds | Saturated seconds | Saturation percentage |
|---|---|---|---|
| A | 6248 | 73 | 1.168374% |
| B | 6255 | 94 | 1.502798% |
| C | 6267 | 38 | 0.606351% |
| D | 6302 | 56 | 0.888607% |
Noise dominated data is calculated using 1-second bins in cleaned event files. If a bin has >2000 counts, and if more than 50% of those come from <1% of pixels, then it is considered to be noise-dominated and hence unusable.
| Quadrant | # 1 sec bins | Bins with >0 counts | Bins with >2000 counts | High rate bins dominated by noise | Noise dominated (total time) | Noise dominated (detector-on time) | Marked lightcurve |
|---|---|---|---|---|---|---|---|
| A | 14806 | 6430 | 2 | 2 | 0.01% | 0.03% | 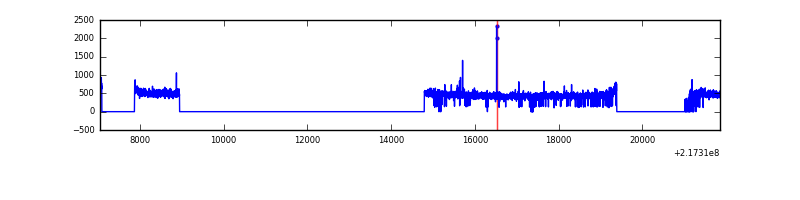 |
| B | 14806 | 6423 | 12 | 12 | 0.08% | 0.19% | 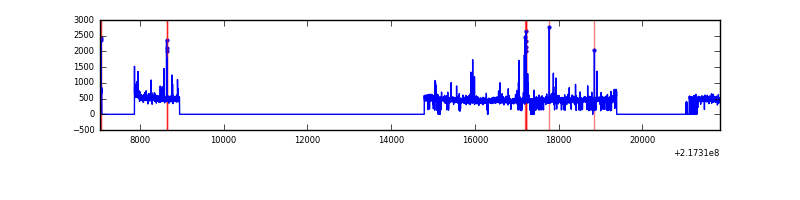 |
| C | 14806 | 6441 | 0 | 0 | 0.00% | 0.00% | 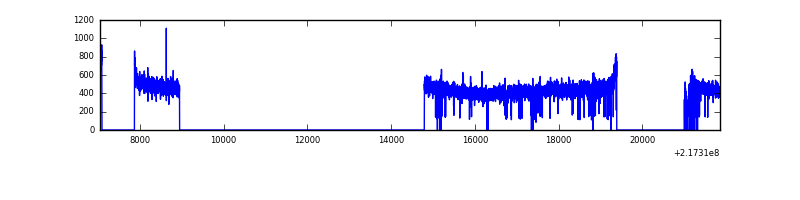 |
| D | 14806 | 6441 | 14 | 14 | 0.09% | 0.22% | 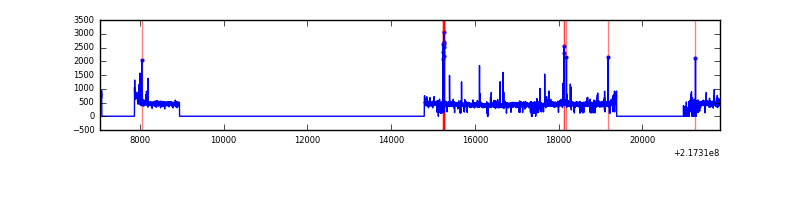 |
Top three noisy pixels from each quadrant. If the there are fewer than three noisy pixels in the level2.evt file, extra rows are filled as -1
| Pixel properties | Quadrant properties | ||||||
|---|---|---|---|---|---|---|---|
| Quadrant | DetID | PixID | Counts | Sigma | Mean | Median | Sigma |
| A | 8 | 15 | 44139 | 288.08 | 731 | 714 | 150.7 |
| A | 4 | 2 | 16599 | 105.38 | 731 | 714 | 150.7 |
| A | 12 | 194 | 6858 | 40.76 | 731 | 714 | 150.7 |
| B | 0 | 219 | 41041 | 282.84 | 737 | 718 | 142.6 |
| B | 4 | 52 | 31842 | 218.31 | 737 | 718 | 142.6 |
| B | 15 | 204 | 22272 | 151.19 | 737 | 718 | 142.6 |
| C | 1 | 16 | 11794 | 67.19 | 708 | 712 | 164.9 |
| C | 13 | 61 | 5621 | 29.76 | 708 | 712 | 164.9 |
| C | 8 | 222 | 2229 | 9.2 | 708 | 712 | 164.9 |
| D | 5 | 97 | 38455 | 215.27 | 715 | 691 | 175.4 |
| D | 12 | 221 | 30010 | 167.13 | 715 | 691 | 175.4 |
| D | 2 | 136 | 29457 | 163.98 | 715 | 691 | 175.4 |
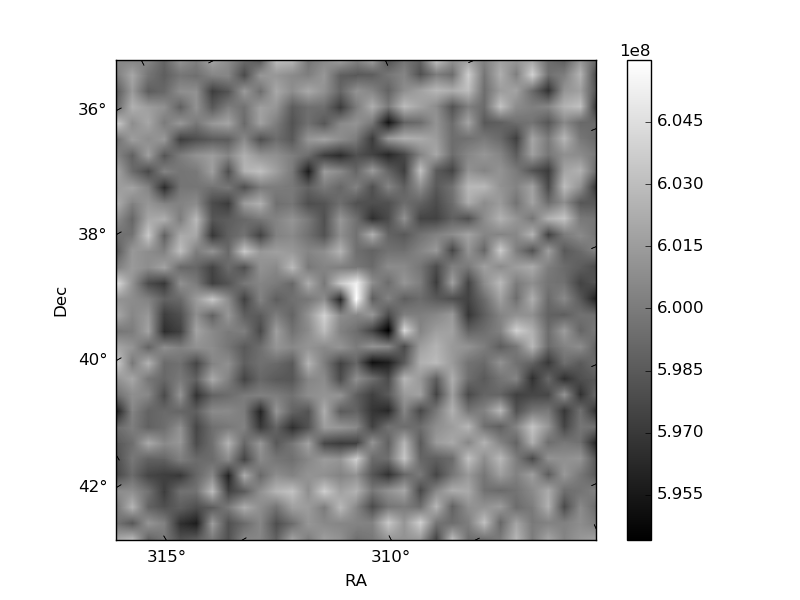
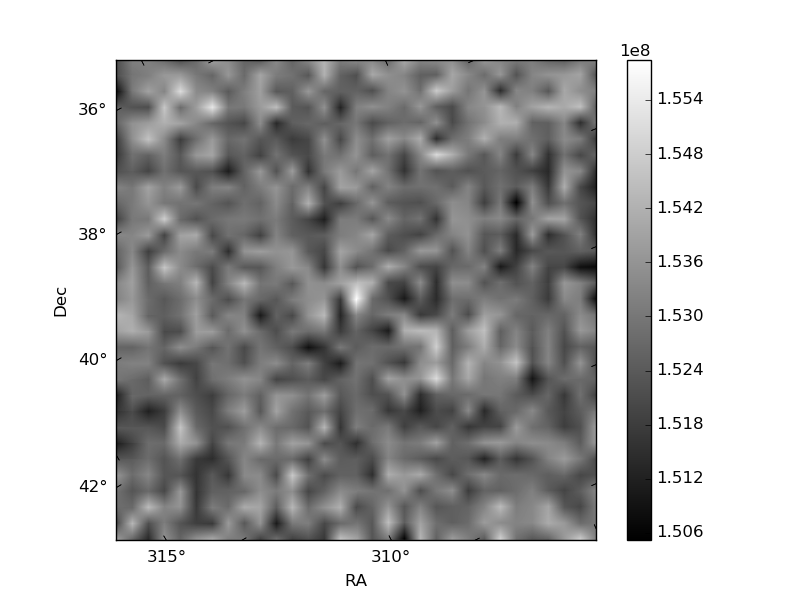
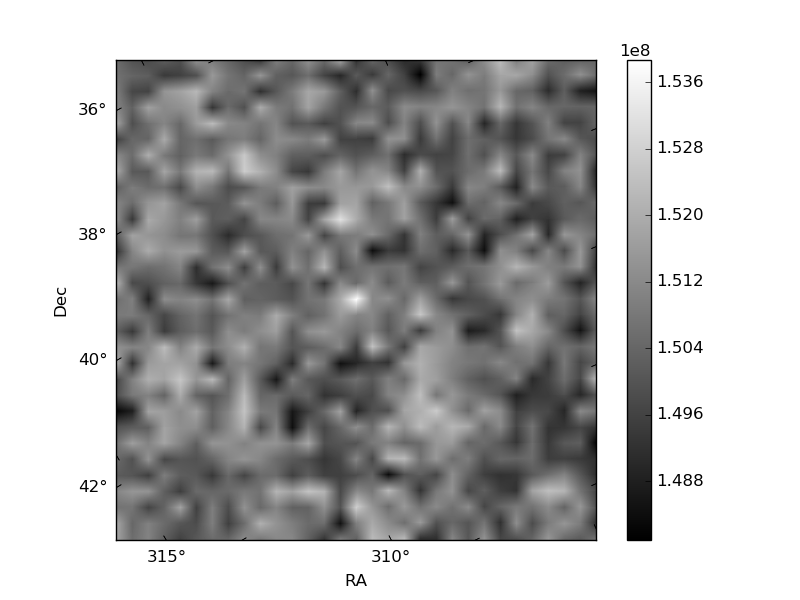
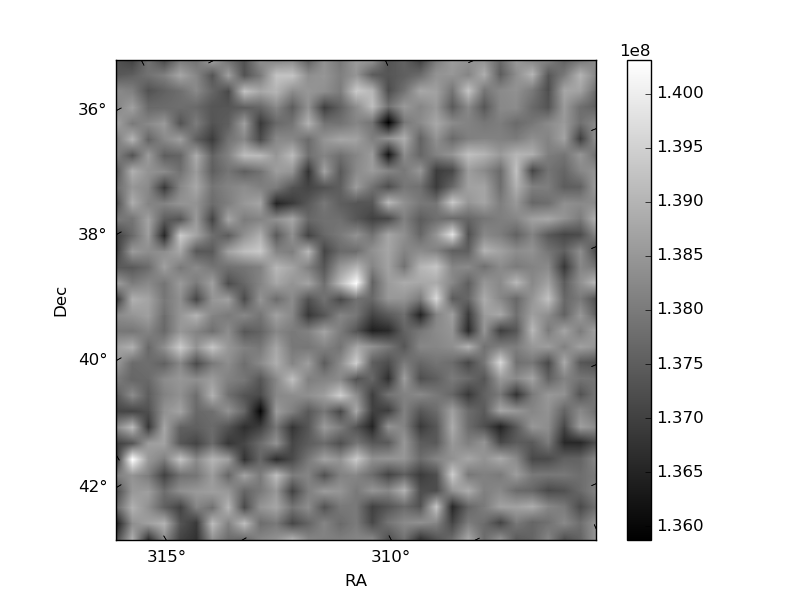
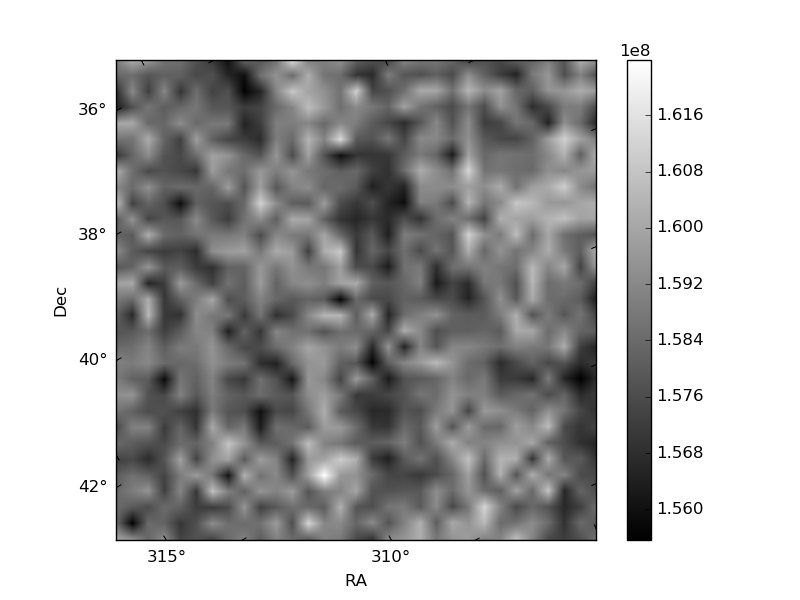
Histogram calculated using DETX and DETY for each event in the final _common_clean file
| Quadrant A | 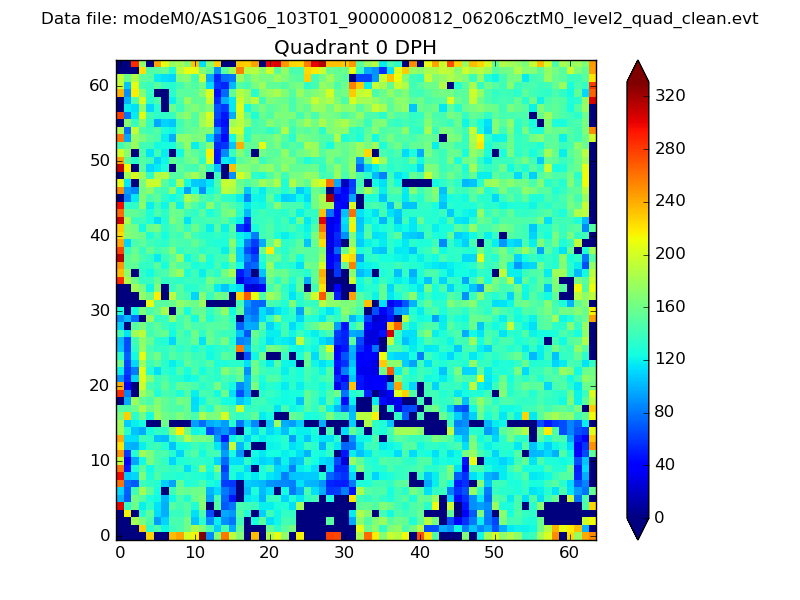 |
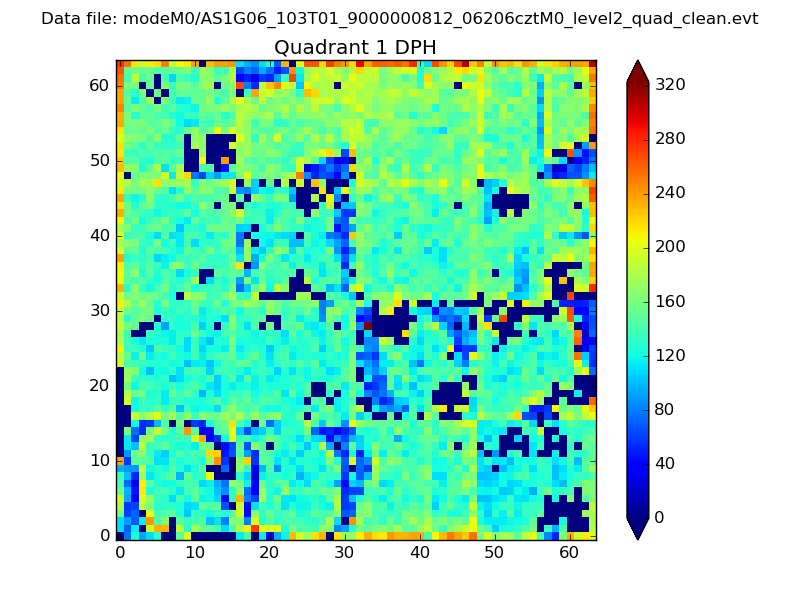 |
Quadrant B |
|---|---|---|---|
| Quadrant D | 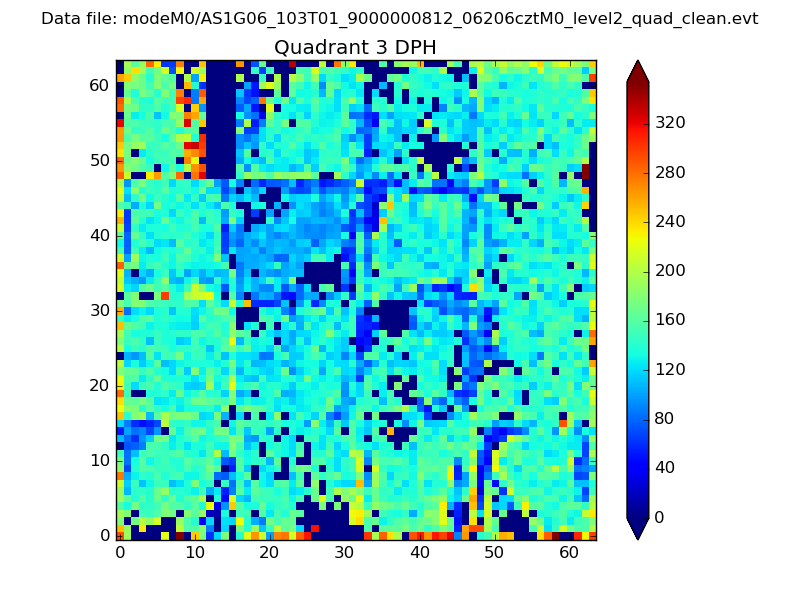 |
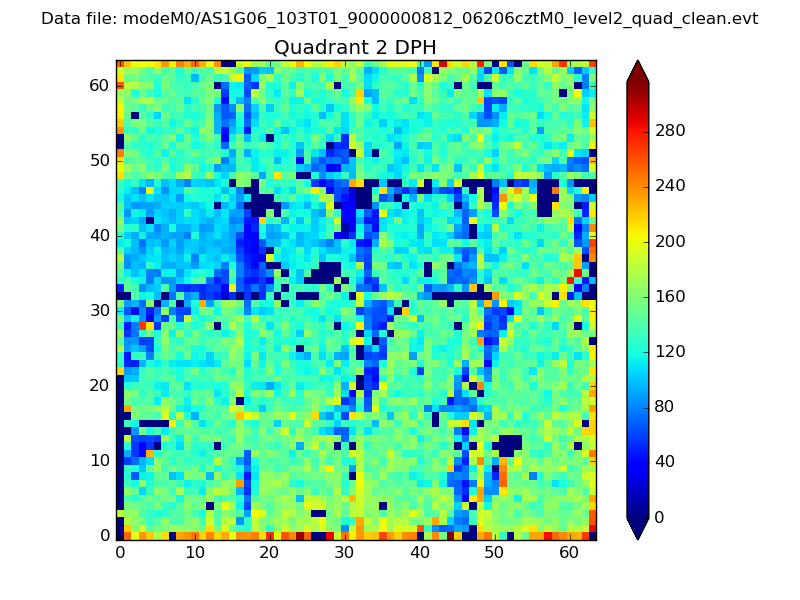 |
Quadrant C |
| Plot type | Count rate plots | Images |
|---|---|---|
| Comparison with Poisson distribution Blue bars denote a histogram of data divided into 1 sec bins. Red curve is a Poisson curve with rate = median count rate of data. |
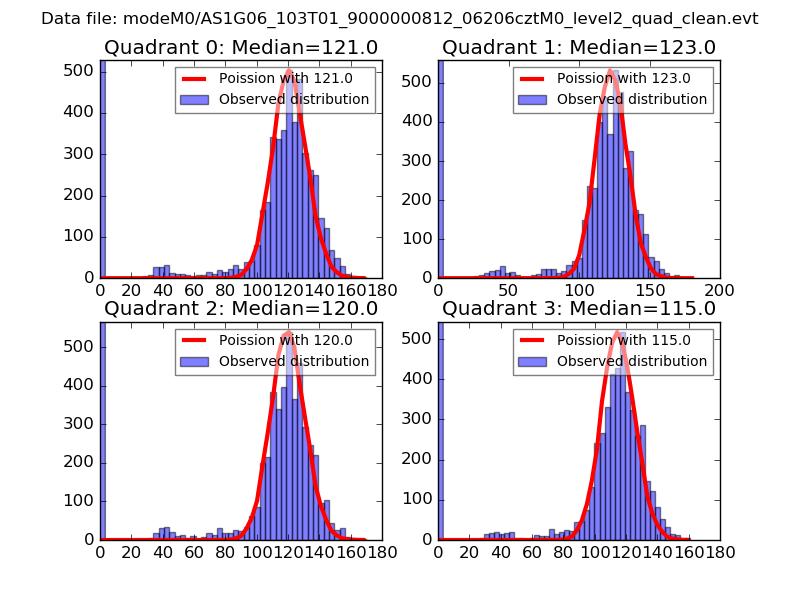 |
 |
| Quadrant-wise count rates Data is divided into 100 sec bins |
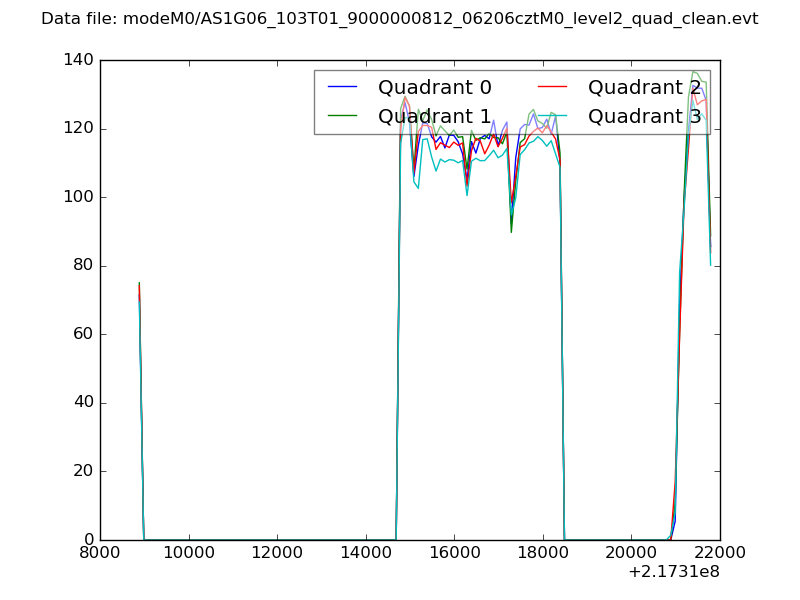 |
|
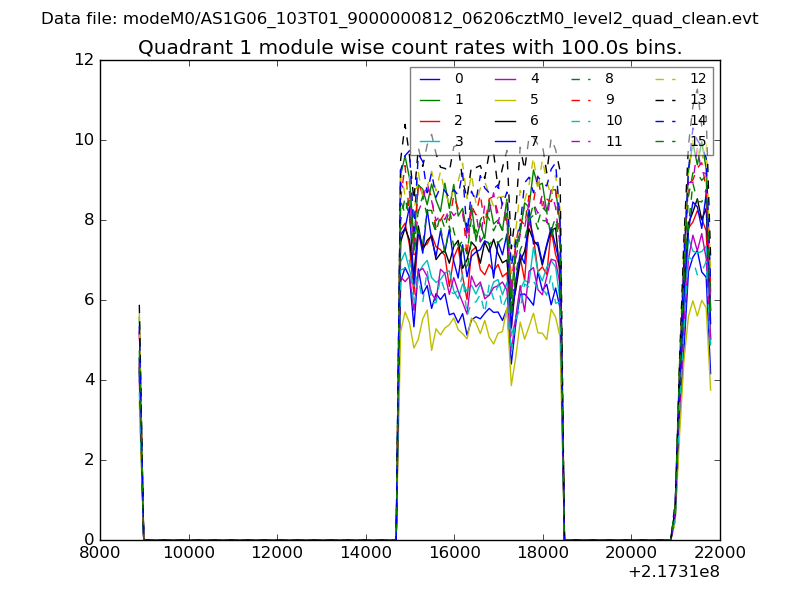
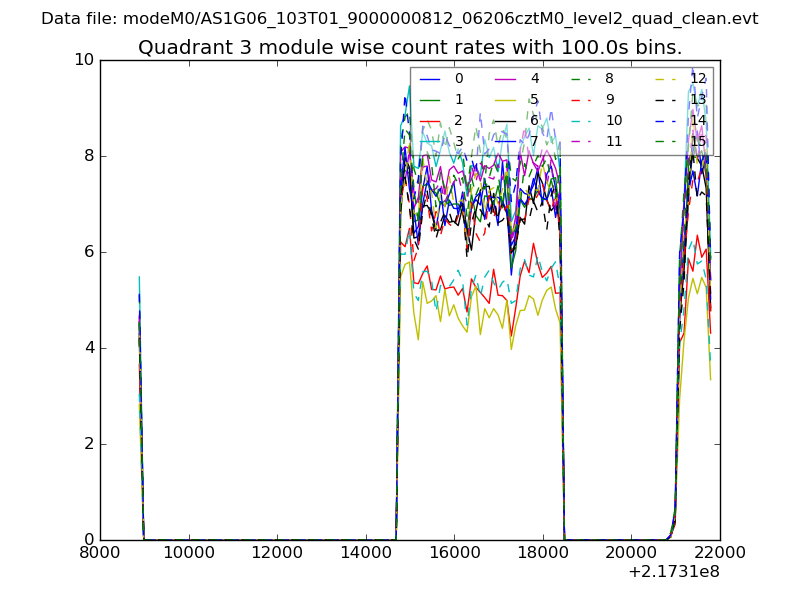
| Module-wise count rates for Quadrant A Data is divided into 100 sec bins |
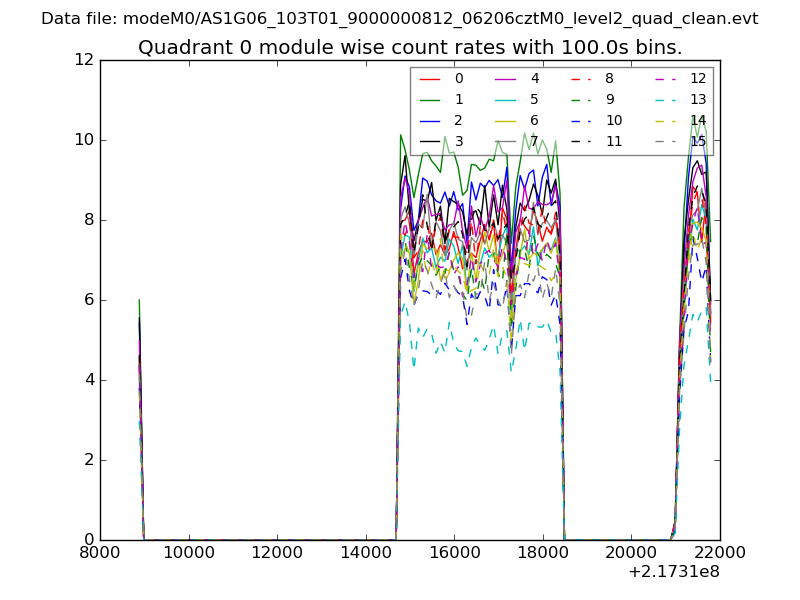 |
 |
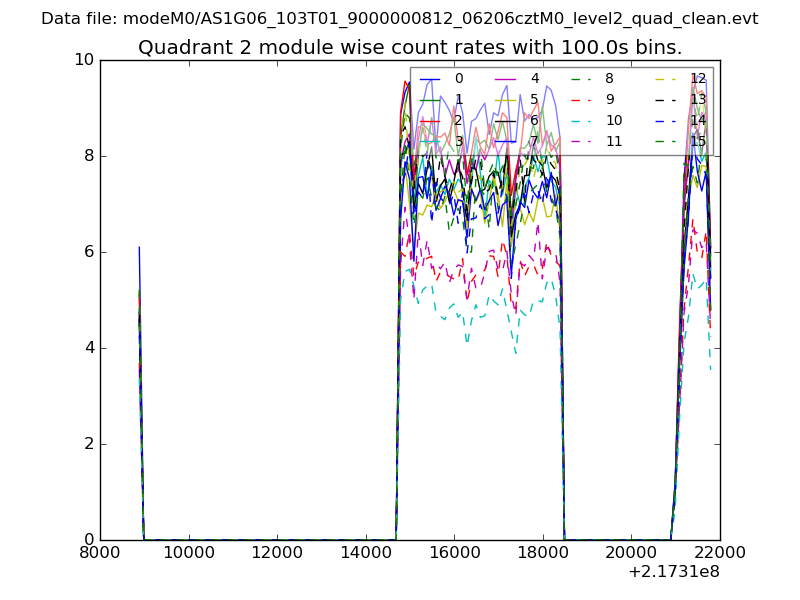
| Module-wise count rates for Quadrant B Data is divided into 100 sec bins |
 |
 |
| Module-wise count rates for Quadrant C Data is divided into 100 sec bins |
 |
 |
| Module-wise count rates for Quadrant D Data is divided into 100 sec bins |
 |
 |
| Parameter | Plot |
|---|---|
| CZT HV Monitor | 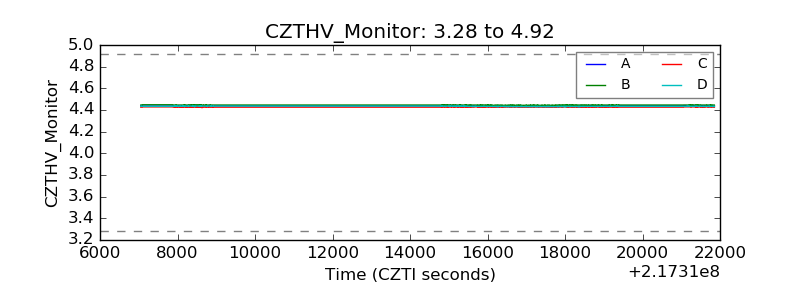 |
| D_VDD | 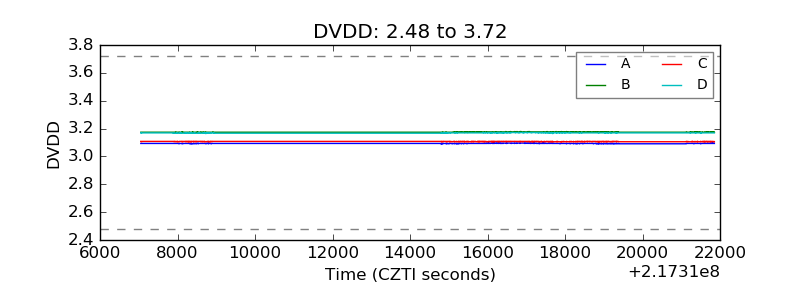 |
| Temperature 1 | 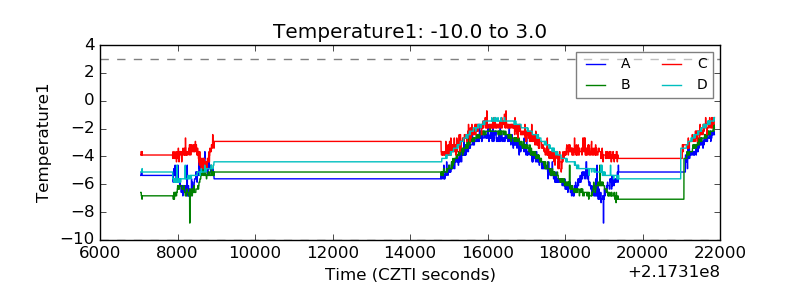 |
| Veto HV Monitor | 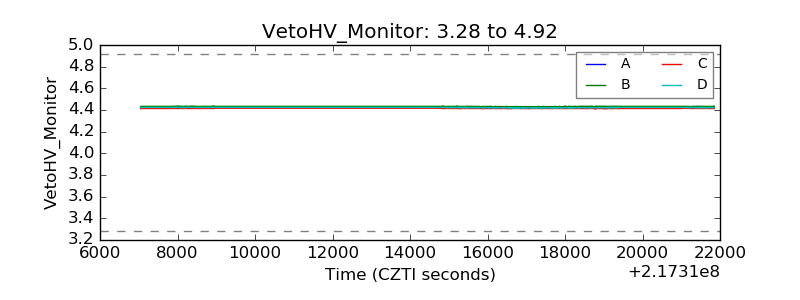 |
| Veto LLD | 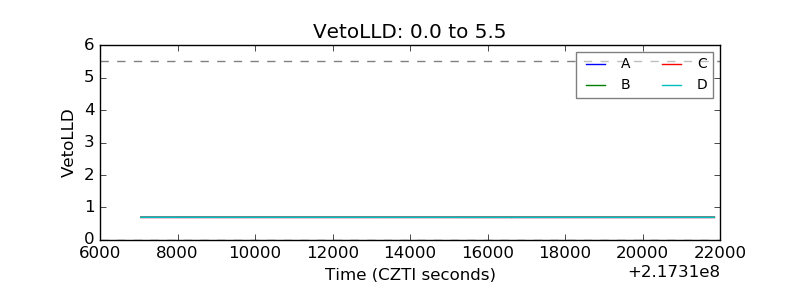 |
| Alpha Counter | 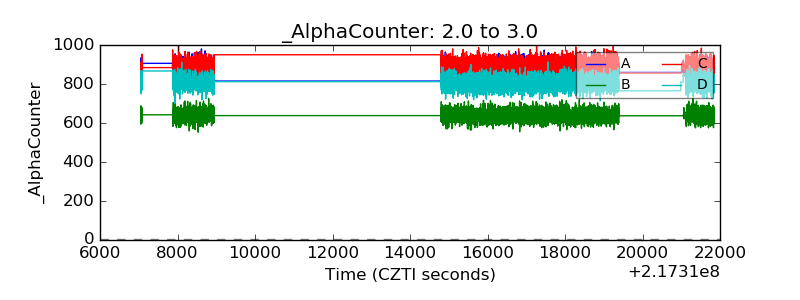 |
| _CPM_Rate | 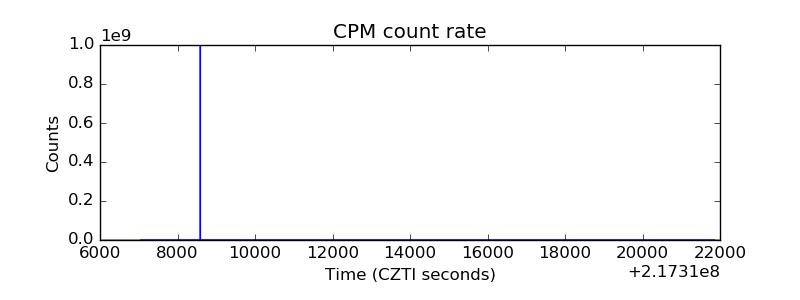 |
| CZT Counter | 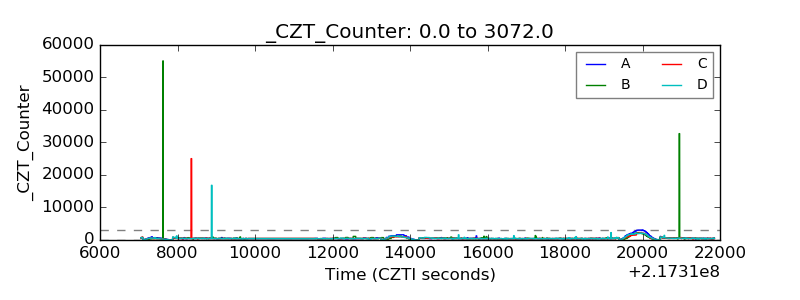 |
| +2.5 Volts monitor | 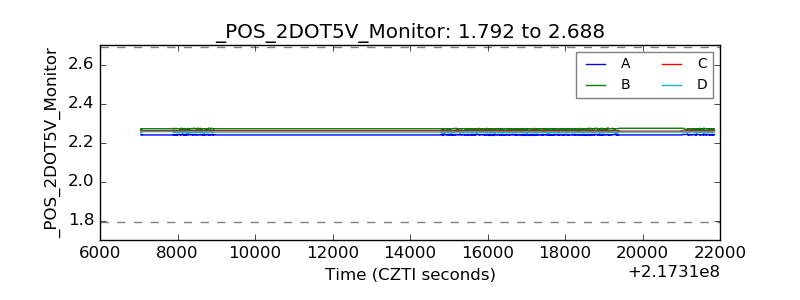 |
| +5 Volts monitor |  |
| _ROLL_ROT | 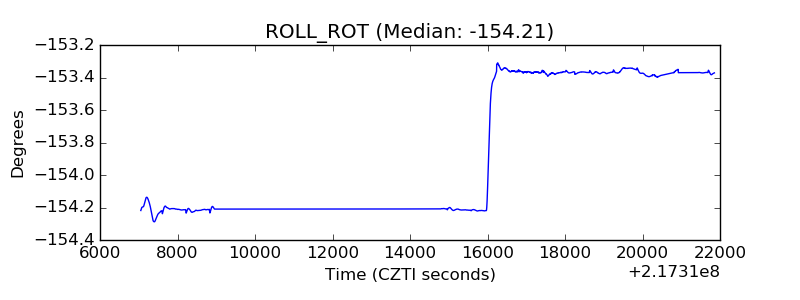 |
| _Roll_DEC | 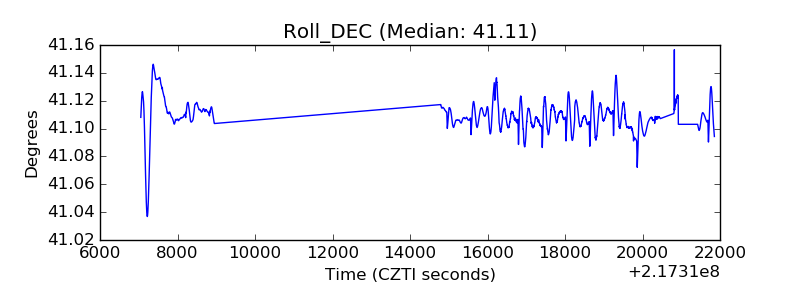 |
| _Roll_RA | 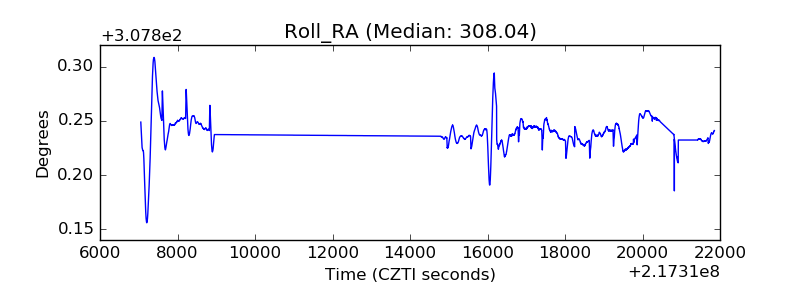 |
| Veto Counter | 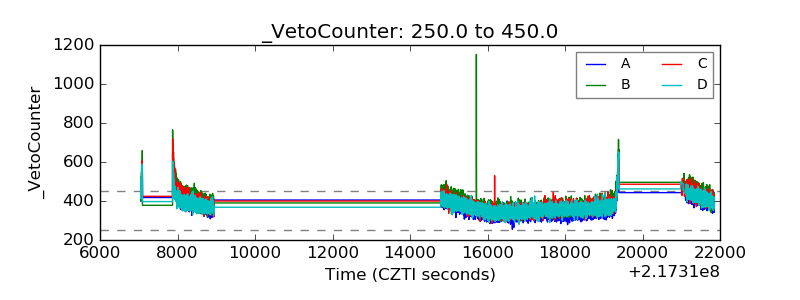 |