| Param | Original file | Final file |
|---|---|---|
| Filename | modeM0/AS1G06_103T01_9000000812_06207cztM0_level2.evt | modeM0/AS1G06_103T01_9000000812_06207cztM0_level2_quad_clean.evt |
| Size (bytes) | 993,551,040 | 235,624,320 |
| Size | 947.5 MB | 224.7 MB |
| Events in quadrant A | 7,216,652 | 1,536,166 |
| Events in quadrant B | 7,630,633 | 1,558,646 |
| Events in quadrant C | 6,936,963 | 1,513,602 |
| Events in quadrant D | 7,250,306 | 1,454,039 |
| Mode SS | |||
|---|---|---|---|
| Quadrant | BADHDUFLAG | Total packets | Discarded packets |
| A | 0 | 322 | 6 |
| B | 0 | 322 | 6 |
| C | 0 | 322 | 2 |
| D | 0 | 322 | 4 |
| Mode M9 | |||
|---|---|---|---|
| Quadrant | BADHDUFLAG | Total packets | Discarded packets |
| A | 0 | 32 | 3 |
| B | 0 | 32 | 6 |
| C | 0 | 32 | 3 |
| D | 0 | 32 | 4 |
| Mode M0 | |||
|---|---|---|---|
| Quadrant | BADHDUFLAG | Total packets | Discarded packets |
| A | 0 | 32476 | 419 |
| B | 0 | 33350 | 462 |
| C | 0 | 32171 | 495 |
| D | 0 | 32880 | 402 |
| Quadrant | Total seconds | Saturated seconds | Saturation percentage |
|---|---|---|---|
| A | 15578 | 157 | 1.007832% |
| B | 15571 | 177 | 1.136729% |
| C | 15543 | 84 | 0.540436% |
| D | 15583 | 140 | 0.898415% |
Noise dominated data is calculated using 1-second bins in cleaned event files. If a bin has >2000 counts, and if more than 50% of those come from <1% of pixels, then it is considered to be noise-dominated and hence unusable.
| Quadrant | # 1 sec bins | Bins with >0 counts | Bins with >2000 counts | High rate bins dominated by noise | Noise dominated (total time) | Noise dominated (detector-on time) | Marked lightcurve |
|---|---|---|---|---|---|---|---|
| A | 18936 | 15719 | 3 | 3 | 0.02% | 0.02% |  |
| B | 18936 | 15718 | 29 | 29 | 0.15% | 0.18% | 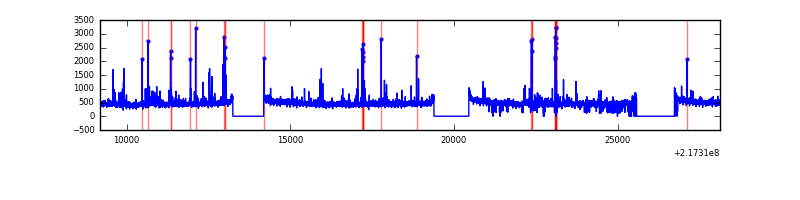 |
| C | 18936 | 15724 | 0 | 0 | 0.00% | 0.00% | 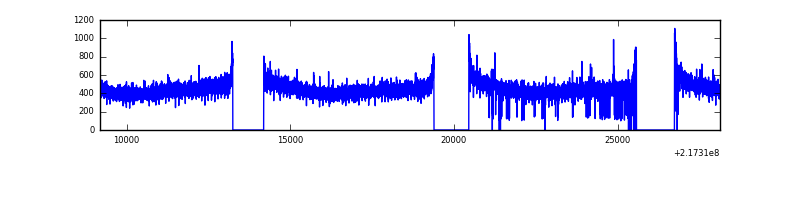 |
| D | 18936 | 15722 | 23 | 23 | 0.12% | 0.15% | 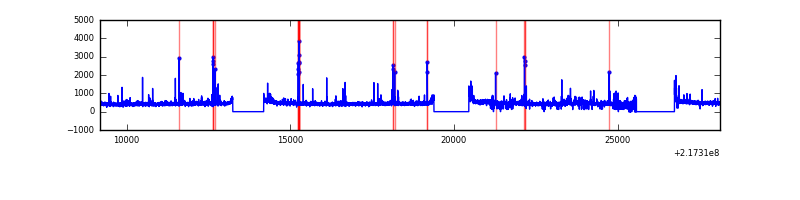 |
Top three noisy pixels from each quadrant. If the there are fewer than three noisy pixels in the level2.evt file, extra rows are filled as -1
| Pixel properties | Quadrant properties | ||||||
|---|---|---|---|---|---|---|---|
| Quadrant | DetID | PixID | Counts | Sigma | Mean | Median | Sigma |
| A | 8 | 15 | 110589 | 293.68 | 1835 | 1796 | 370.4 |
| A | 4 | 2 | 18799 | 45.9 | 1835 | 1796 | 370.4 |
| A | 0 | 226 | 17779 | 43.15 | 1835 | 1796 | 370.4 |
| B | 0 | 219 | 79496 | 223.0 | 1840 | 1801 | 348.4 |
| B | 15 | 204 | 76435 | 214.21 | 1840 | 1801 | 348.4 |
| B | 4 | 52 | 68047 | 190.14 | 1840 | 1801 | 348.4 |
| C | 1 | 16 | 46861 | 110.78 | 1765 | 1779 | 407.0 |
| C | 13 | 61 | 14016 | 30.07 | 1765 | 1779 | 407.0 |
| C | 8 | 222 | 5527 | 9.21 | 1765 | 1779 | 407.0 |
| D | 5 | 97 | 124025 | 281.36 | 1782 | 1728 | 434.7 |
| D | 12 | 221 | 95160 | 214.95 | 1782 | 1728 | 434.7 |
| D | 2 | 136 | 71054 | 159.49 | 1782 | 1728 | 434.7 |
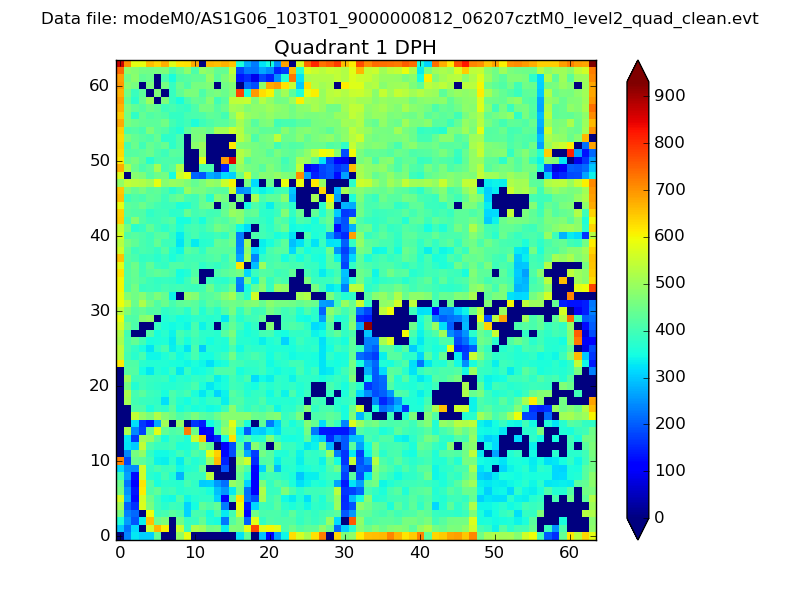
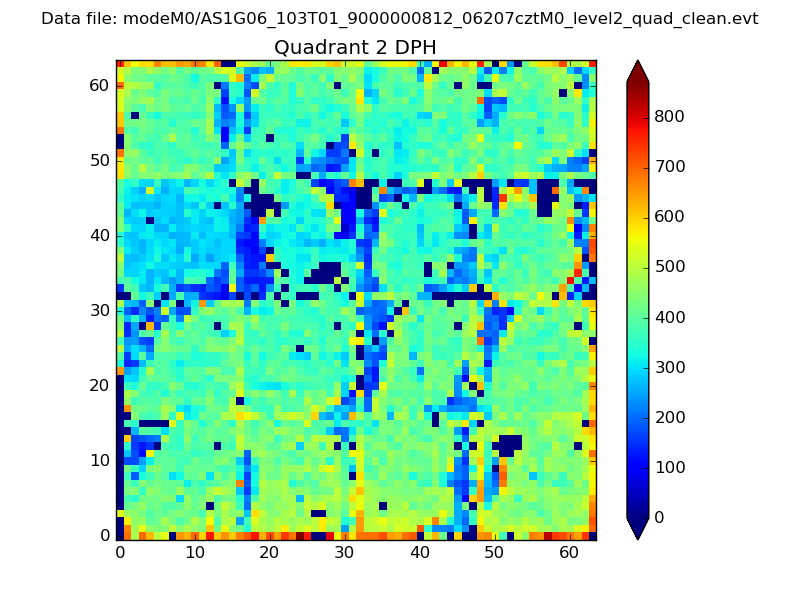
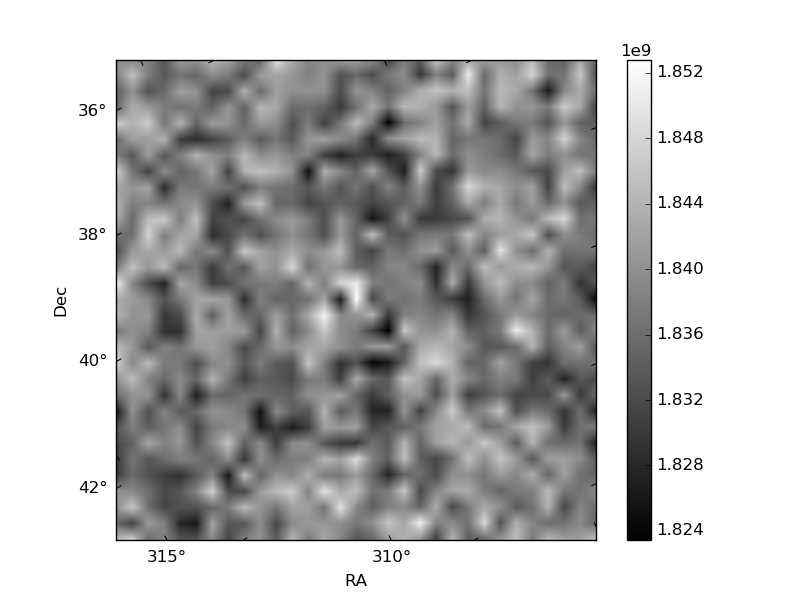
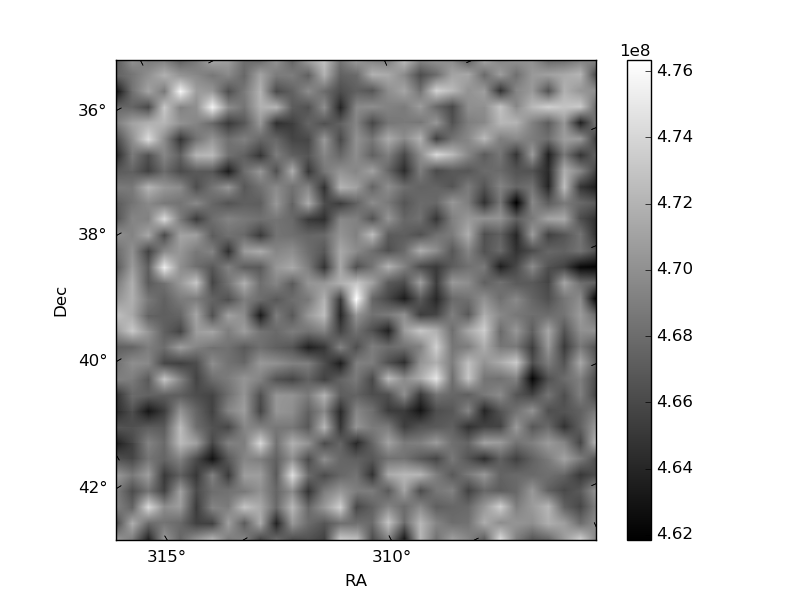
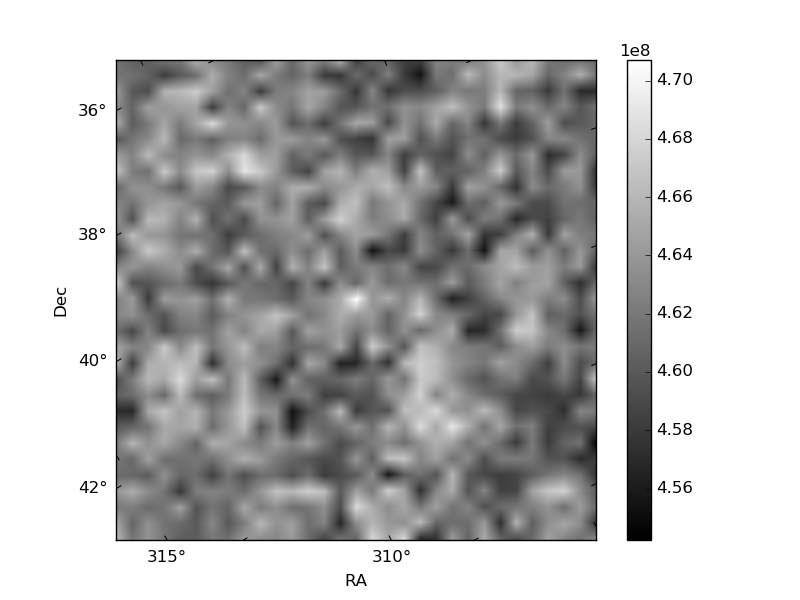
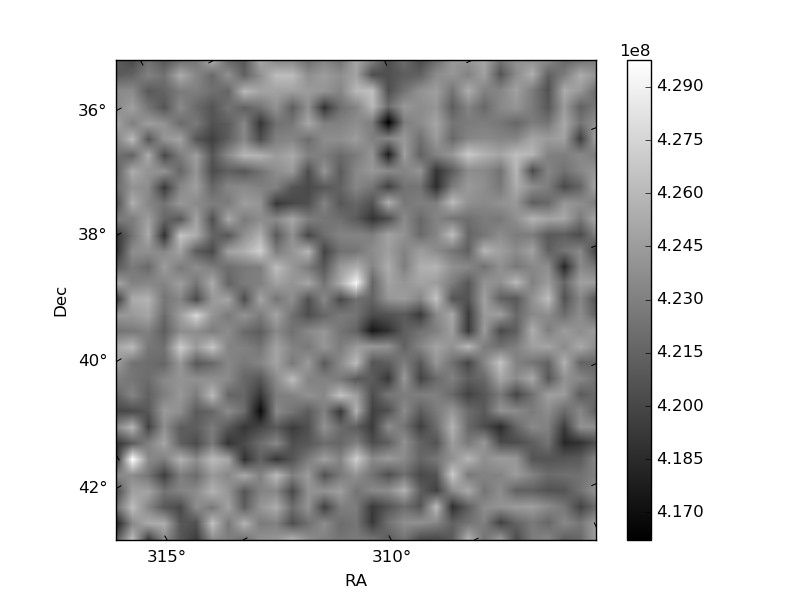
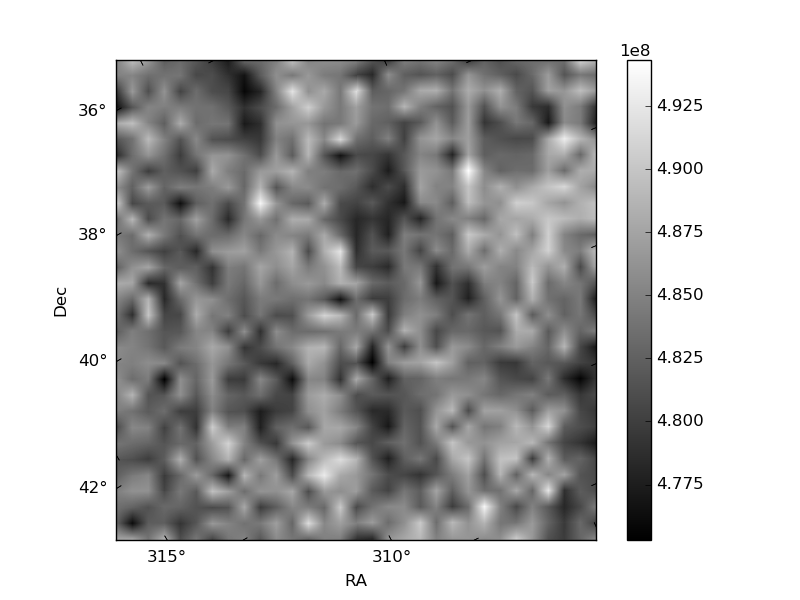
Histogram calculated using DETX and DETY for each event in the final _common_clean file
| Quadrant A | 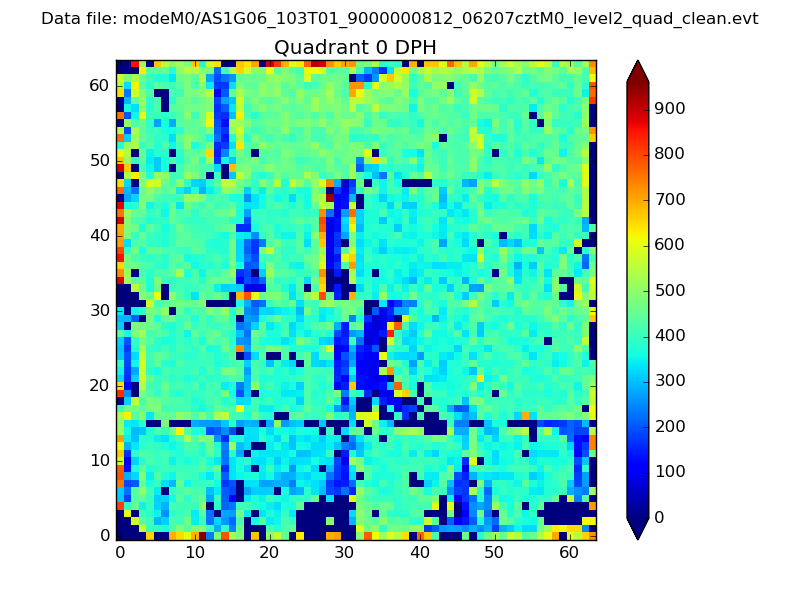 |
 |
Quadrant B |
|---|---|---|---|
| Quadrant D | 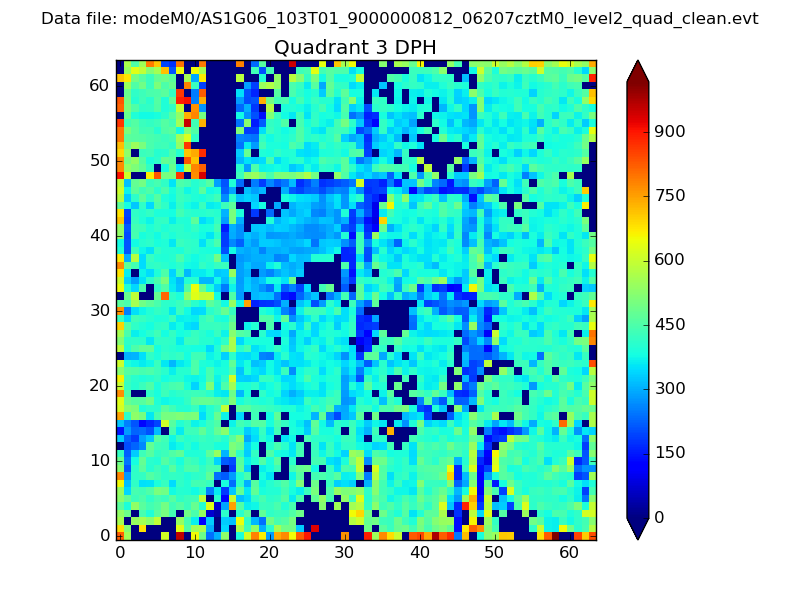 |
 |
Quadrant C |
| Plot type | Count rate plots | Images |
|---|---|---|
| Comparison with Poisson distribution Blue bars denote a histogram of data divided into 1 sec bins. Red curve is a Poisson curve with rate = median count rate of data. |
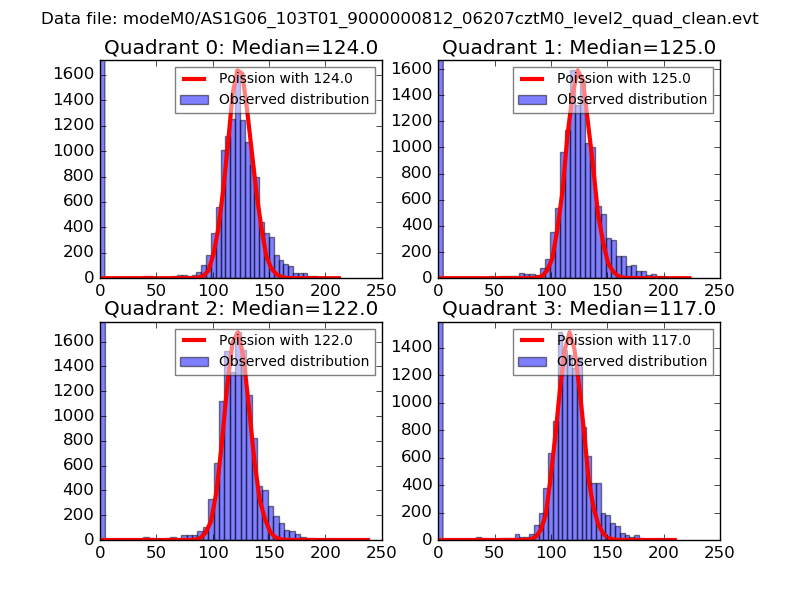 |
 |
| Quadrant-wise count rates Data is divided into 100 sec bins |
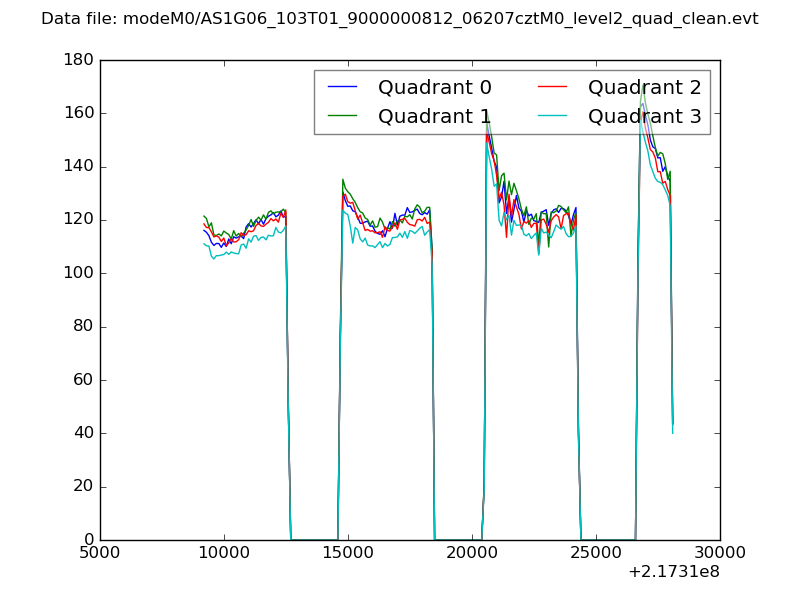 |
|
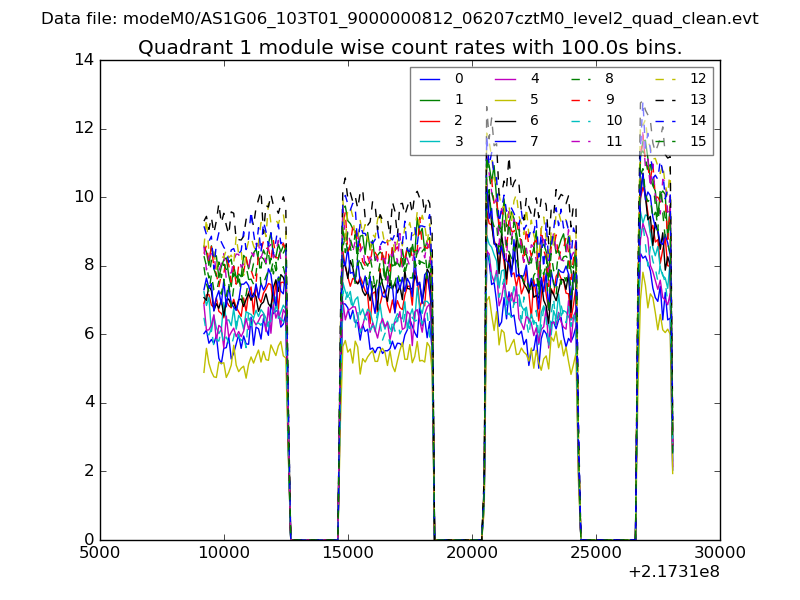
| Module-wise count rates for Quadrant A Data is divided into 100 sec bins |
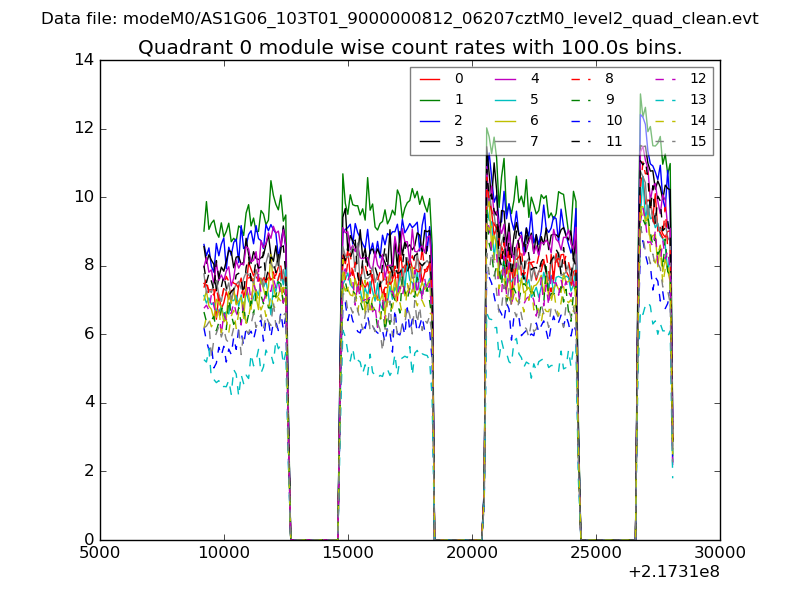 |
 |
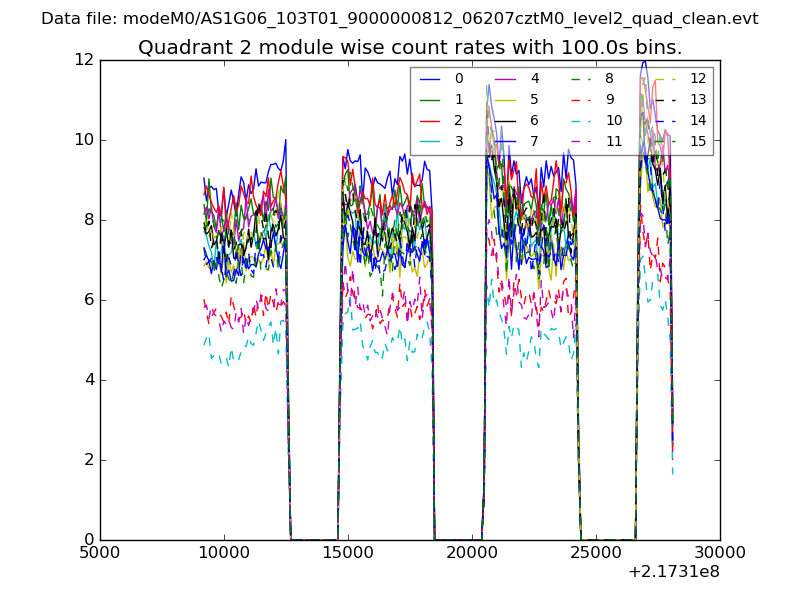
| Module-wise count rates for Quadrant B Data is divided into 100 sec bins |
 |
 |
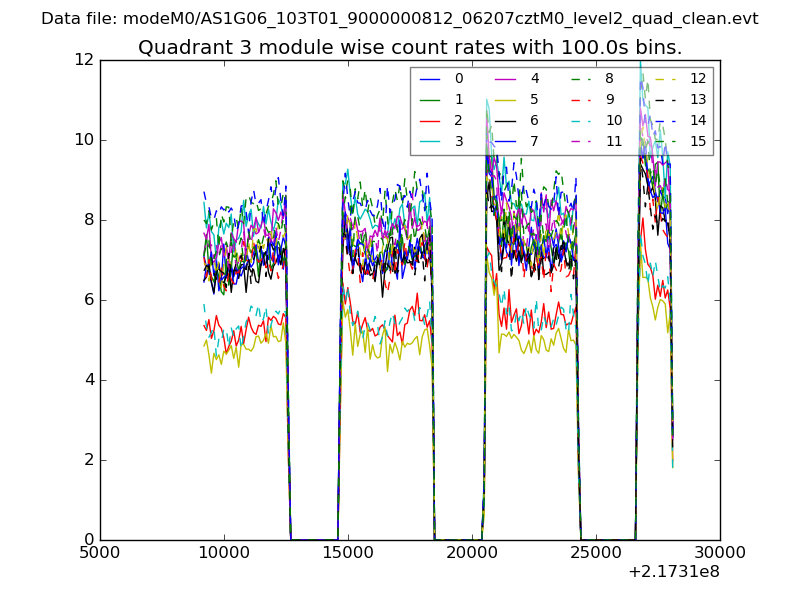
| Module-wise count rates for Quadrant C Data is divided into 100 sec bins |
 |
 |
| Module-wise count rates for Quadrant D Data is divided into 100 sec bins |
 |
 |
| Parameter | Plot |
|---|---|
| CZT HV Monitor | 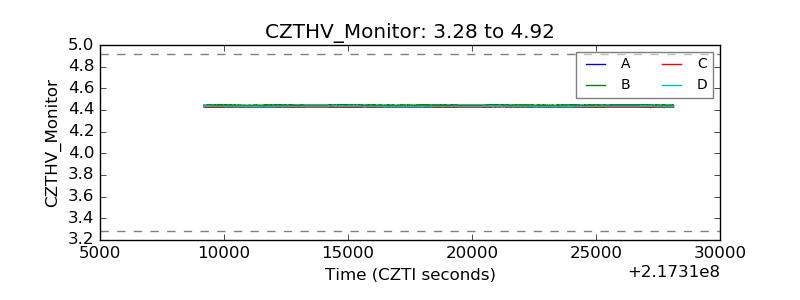 |
| D_VDD | 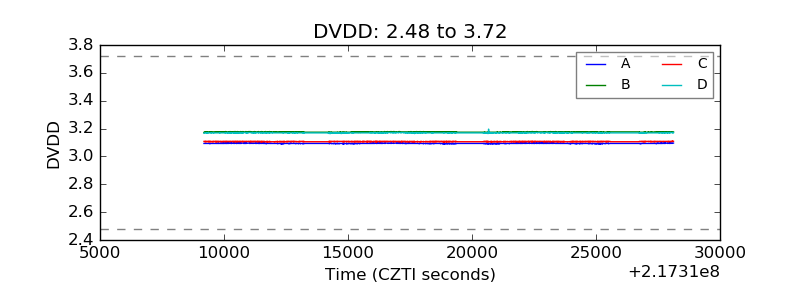 |
| Temperature 1 | 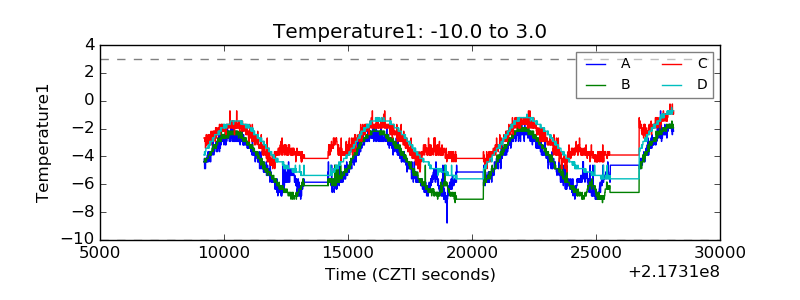 |
| Veto HV Monitor | 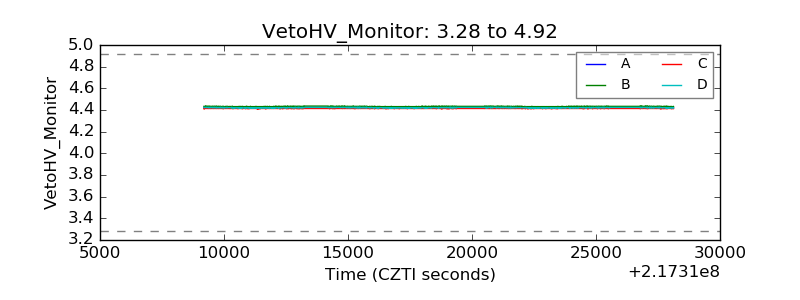 |
| Veto LLD | 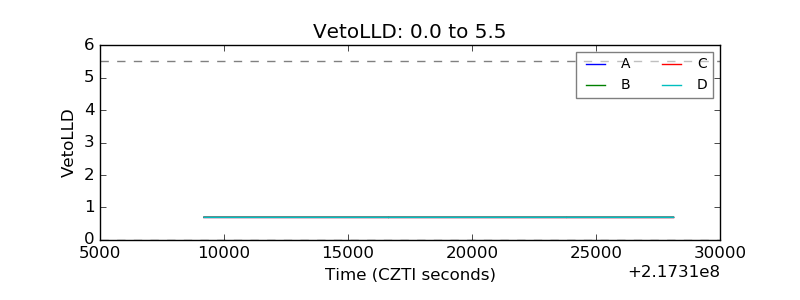 |
| Alpha Counter | 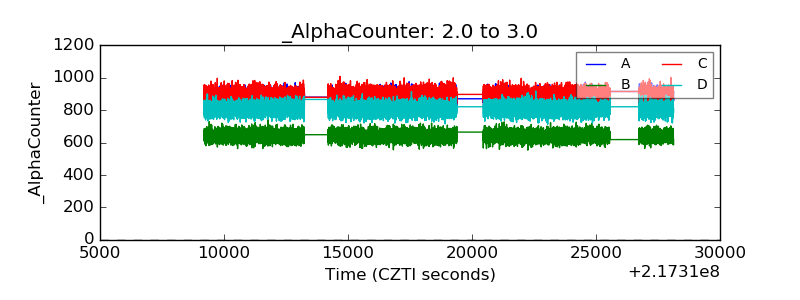 |
| _CPM_Rate | 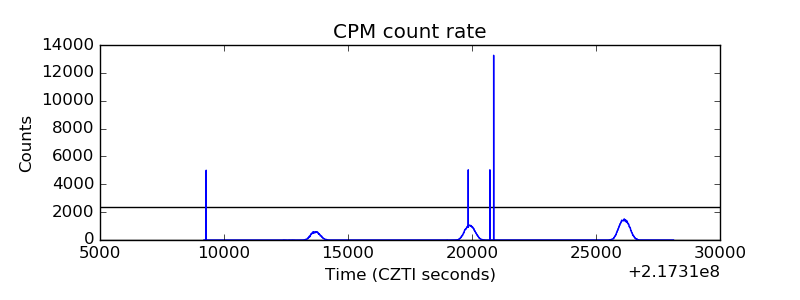 |
| CZT Counter | 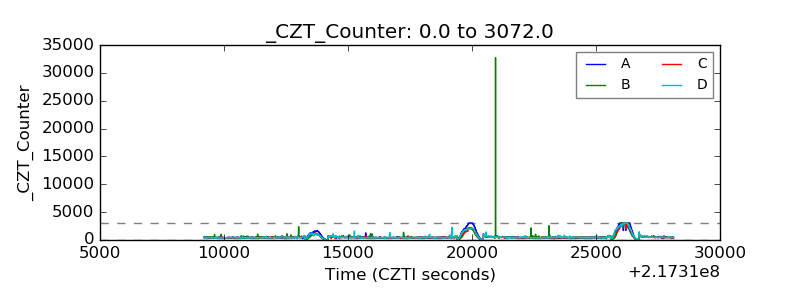 |
| +2.5 Volts monitor |  |
| +5 Volts monitor |  |
| _ROLL_ROT |  |
| _Roll_DEC |  |
| _Roll_RA | 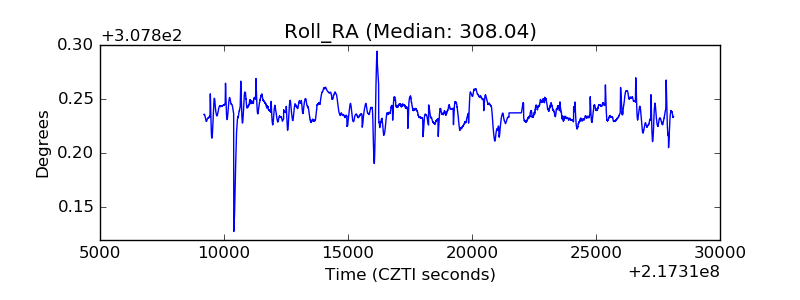 |
| Veto Counter | 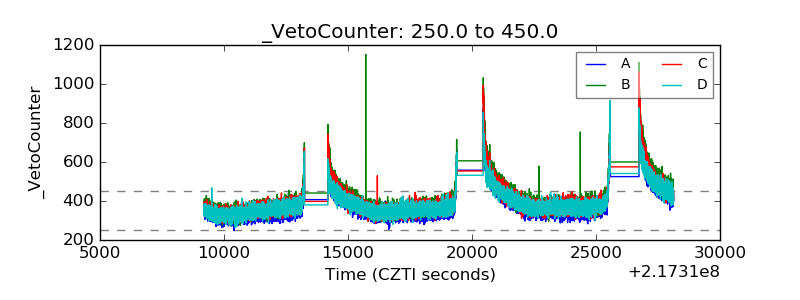 |