| Param | Original file | Final file |
|---|---|---|
| Filename | modeM0/AS1G06_103T01_9000000812_06208cztM0_level2.evt | modeM0/AS1G06_103T01_9000000812_06208cztM0_level2_quad_clean.evt |
| Size (bytes) | 433,690,560 | 100,995,840 |
| Size | 413.6 MB | 96.3 MB |
| Events in quadrant A | 3,356,509 | 665,090 |
| Events in quadrant B | 3,231,067 | 676,868 |
| Events in quadrant C | 2,994,225 | 650,161 |
| Events in quadrant D | 3,122,650 | 625,474 |
| Mode SS | |||
|---|---|---|---|
| Quadrant | BADHDUFLAG | Total packets | Discarded packets |
| A | 0 | 130 | 0 |
| B | 0 | 130 | 0 |
| C | 0 | 130 | 0 |
| D | 0 | 130 | 0 |
| Mode M9 | |||
|---|---|---|---|
| Quadrant | BADHDUFLAG | Total packets | Discarded packets |
| A | 0 | 12 | 0 |
| B | 0 | 12 | 0 |
| C | 0 | 12 | 0 |
| D | 0 | 13 | 0 |
| Mode M0 | |||
|---|---|---|---|
| Quadrant | BADHDUFLAG | Total packets | Discarded packets |
| A | 0 | 14064 | 5 |
| B | 0 | 13624 | 2 |
| C | 0 | 13117 | 2 |
| D | 0 | 13372 | 6 |
| Quadrant | Total seconds | Saturated seconds | Saturation percentage |
|---|---|---|---|
| A | 6317 | 121 | 1.915466% |
| B | 6318 | 91 | 1.440329% |
| C | 6318 | 49 | 0.775562% |
| D | 6316 | 75 | 1.187460% |
Noise dominated data is calculated using 1-second bins in cleaned event files. If a bin has >2000 counts, and if more than 50% of those come from <1% of pixels, then it is considered to be noise-dominated and hence unusable.
| Quadrant | # 1 sec bins | Bins with >0 counts | Bins with >2000 counts | High rate bins dominated by noise | Noise dominated (total time) | Noise dominated (detector-on time) | Marked lightcurve |
|---|---|---|---|---|---|---|---|
| A | 7563 | 6318 | 0 | 0 | 0.00% | 0.00% |  |
| B | 7563 | 6319 | 10 | 10 | 0.13% | 0.16% | 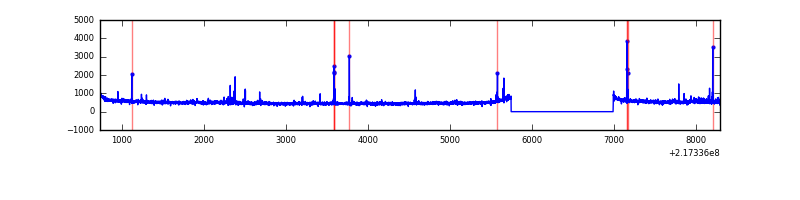 |
| C | 7563 | 6319 | 0 | 0 | 0.00% | 0.00% | 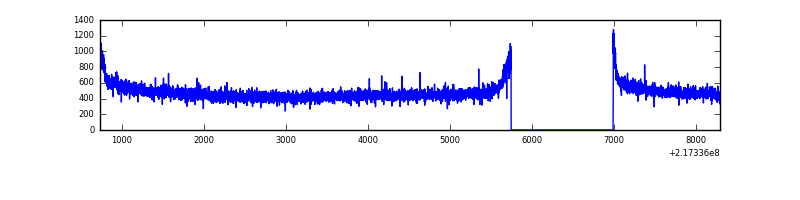 |
| D | 7563 | 6318 | 2 | 2 | 0.03% | 0.03% | 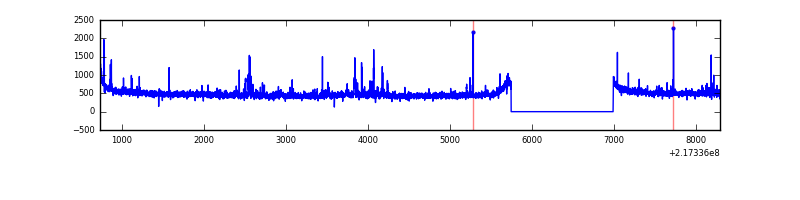 |
Top three noisy pixels from each quadrant. If the there are fewer than three noisy pixels in the level2.evt file, extra rows are filled as -1
| Pixel properties | Quadrant properties | ||||||
|---|---|---|---|---|---|---|---|
| Quadrant | DetID | PixID | Counts | Sigma | Mean | Median | Sigma |
| A | 8 | 192 | 194846 | 1221.34 | 791 | 777 | 158.9 |
| A | 8 | 15 | 77949 | 485.67 | 791 | 777 | 158.9 |
| A | 0 | 128 | 33320 | 204.8 | 791 | 777 | 158.9 |
| B | 0 | 214 | 45936 | 301.19 | 793 | 779 | 149.9 |
| B | 4 | 48 | 27728 | 179.75 | 793 | 779 | 149.9 |
| B | 15 | 204 | 23207 | 149.59 | 793 | 779 | 149.9 |
| C | 1 | 16 | 32161 | 178.87 | 759 | 763 | 175.5 |
| C | 13 | 61 | 6129 | 30.57 | 759 | 763 | 175.5 |
| C | 3 | 202 | 1976 | 6.91 | 759 | 763 | 175.5 |
| D | 5 | 97 | 51233 | 268.44 | 769 | 746 | 188.1 |
| D | 12 | 221 | 44686 | 233.63 | 769 | 746 | 188.1 |
| D | 2 | 136 | 44438 | 232.31 | 769 | 746 | 188.1 |
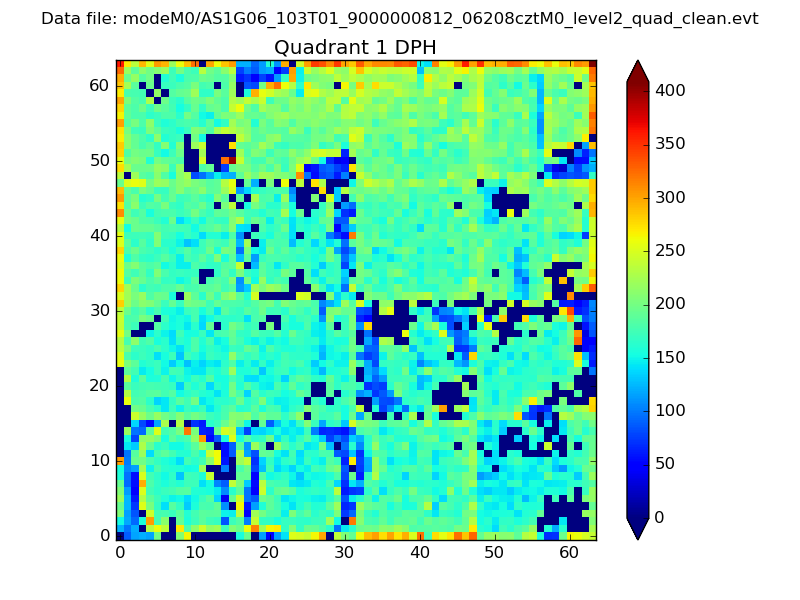
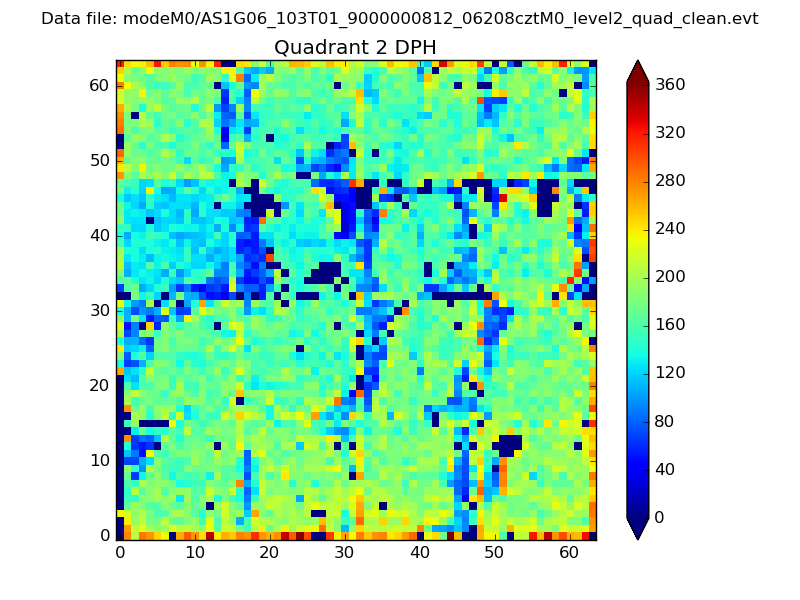
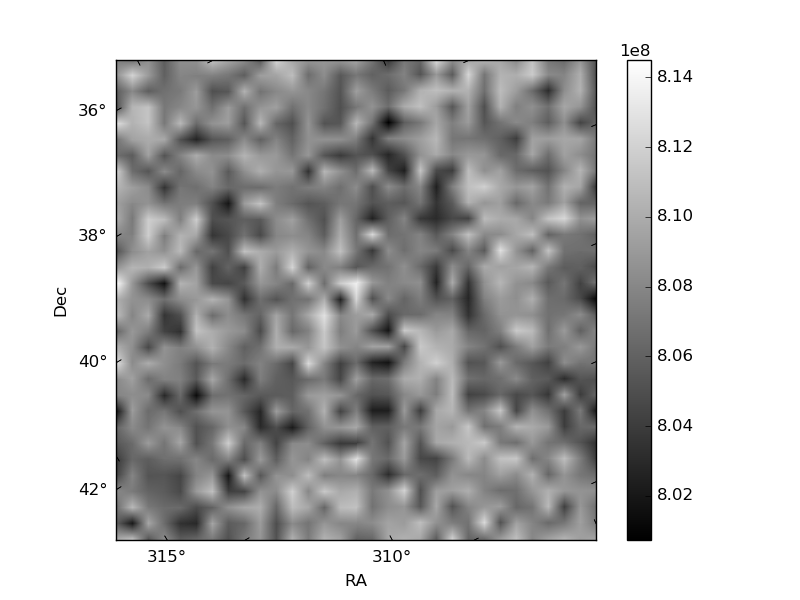
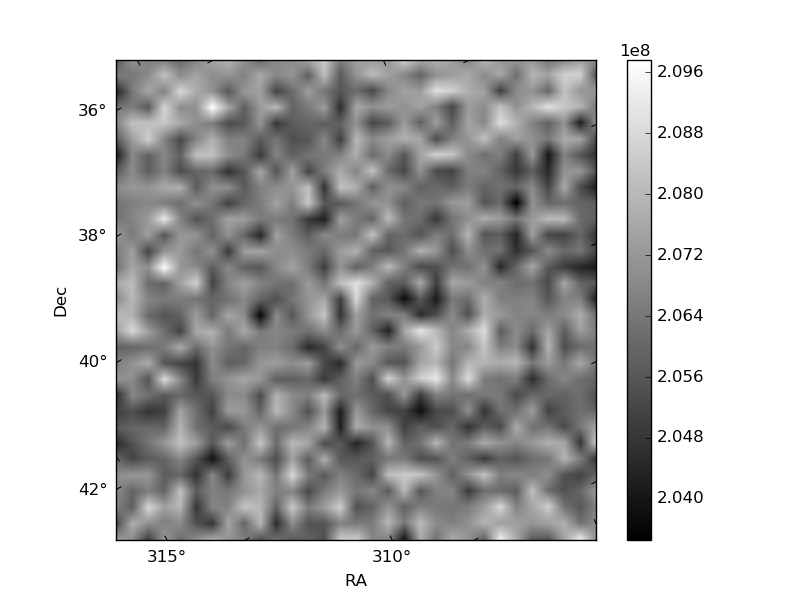
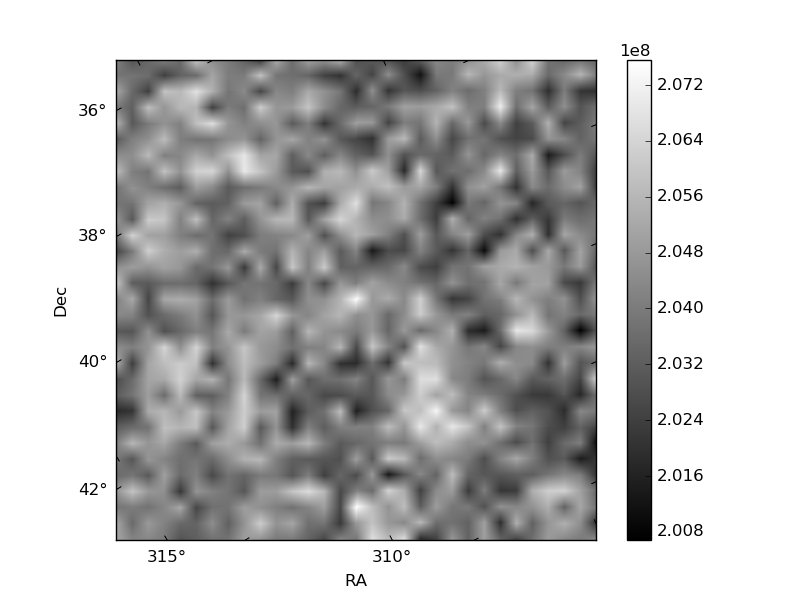
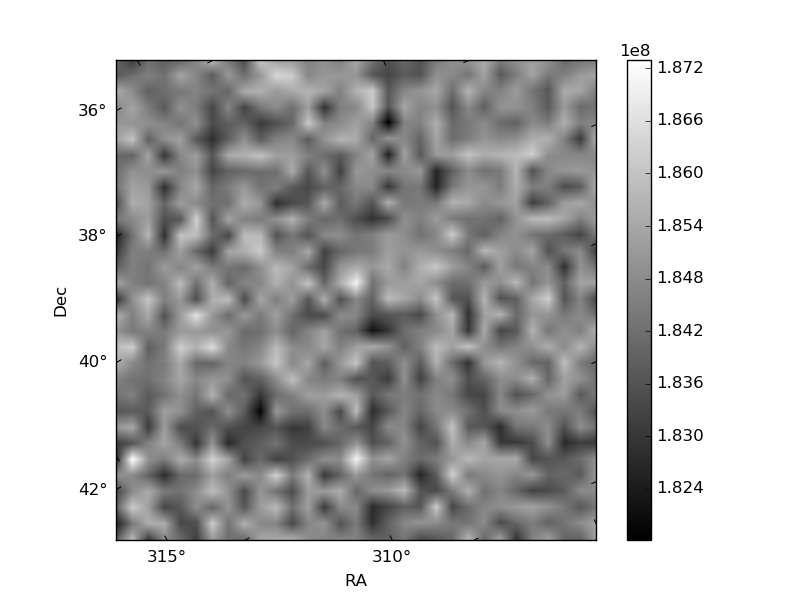
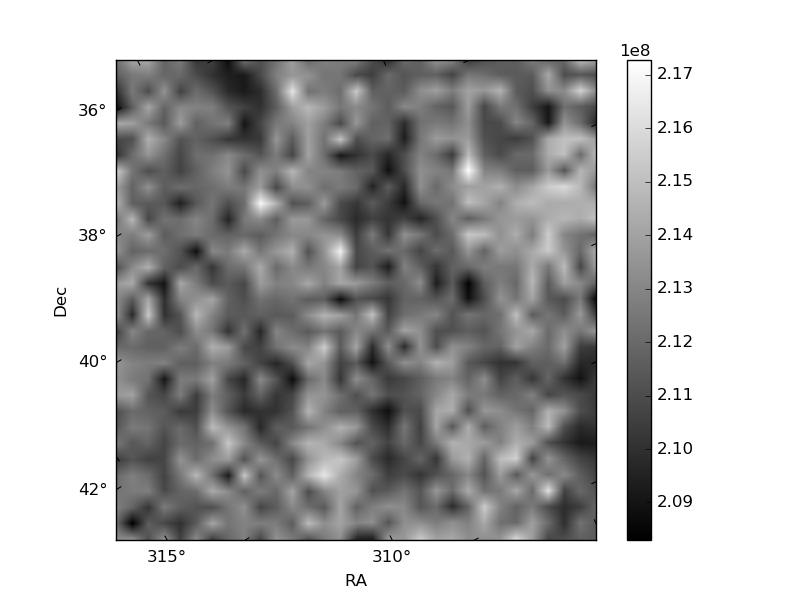
Histogram calculated using DETX and DETY for each event in the final _common_clean file
| Quadrant A | 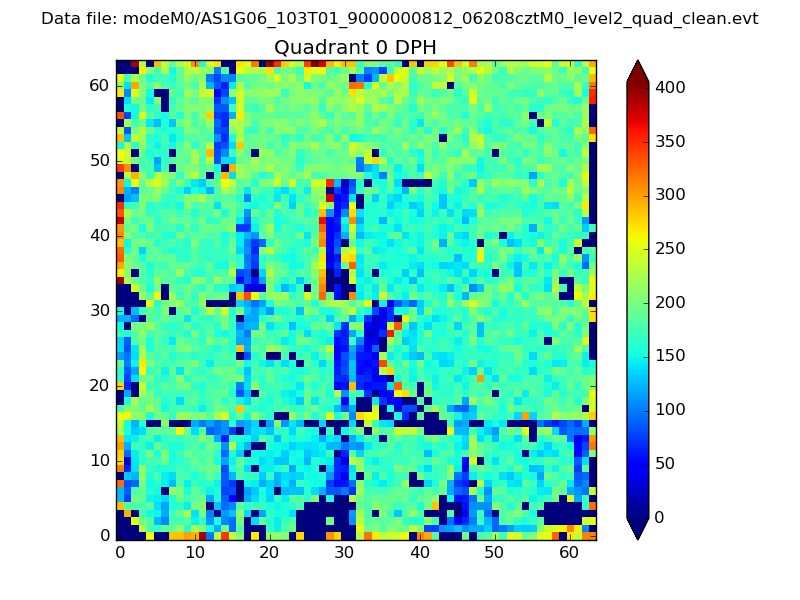 |
 |
Quadrant B |
|---|---|---|---|
| Quadrant D | 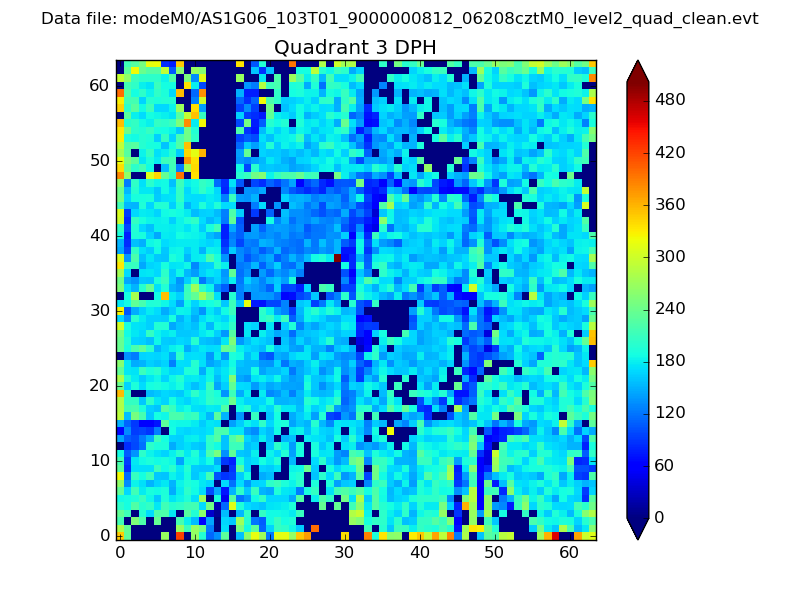 |
 |
Quadrant C |
| Plot type | Count rate plots | Images |
|---|---|---|
| Comparison with Poisson distribution Blue bars denote a histogram of data divided into 1 sec bins. Red curve is a Poisson curve with rate = median count rate of data. |
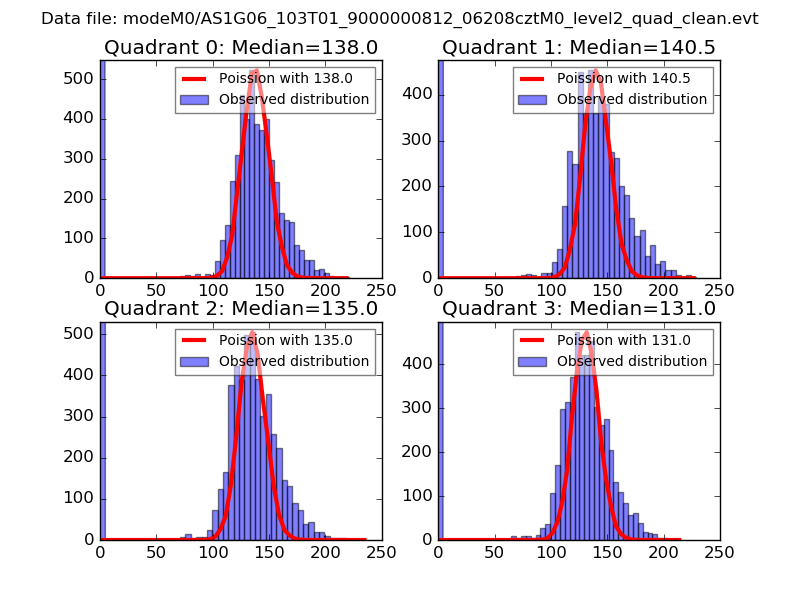 |
 |
| Quadrant-wise count rates Data is divided into 100 sec bins |
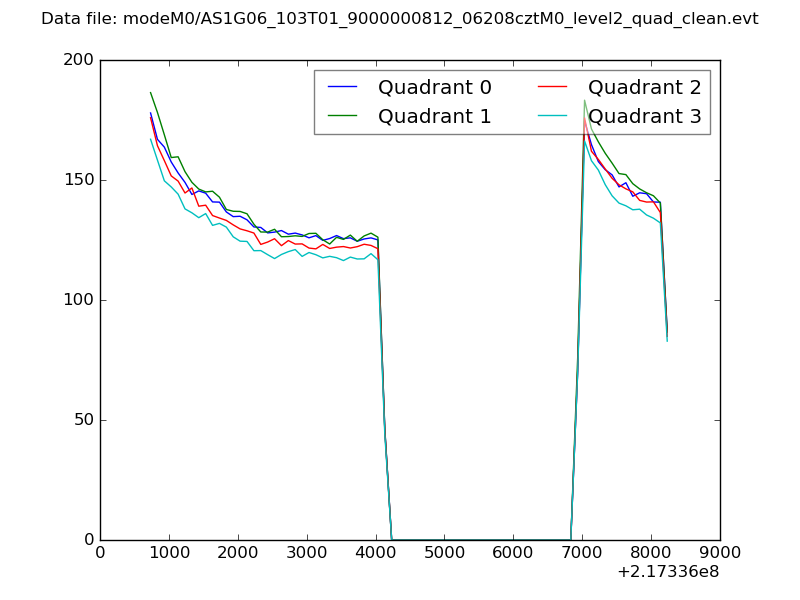 |
|
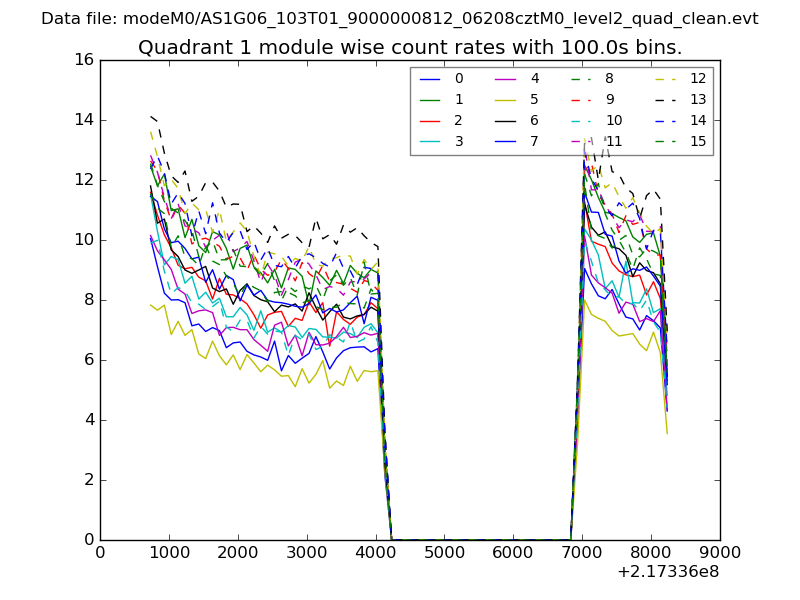
| Module-wise count rates for Quadrant A Data is divided into 100 sec bins |
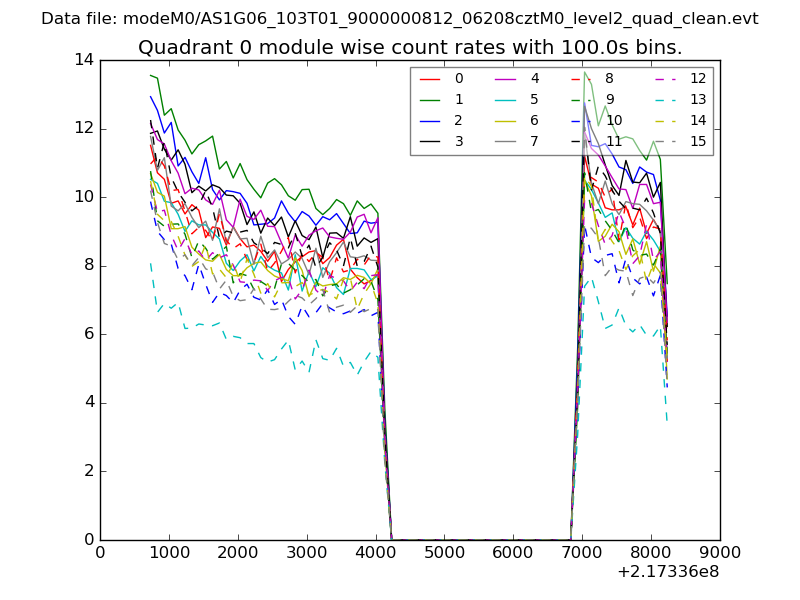 |
 |
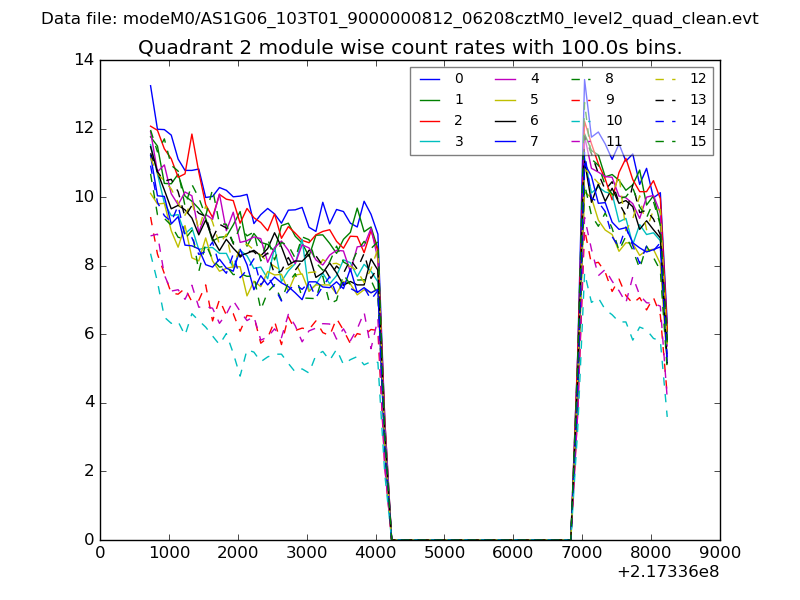
| Module-wise count rates for Quadrant B Data is divided into 100 sec bins |
 |
 |
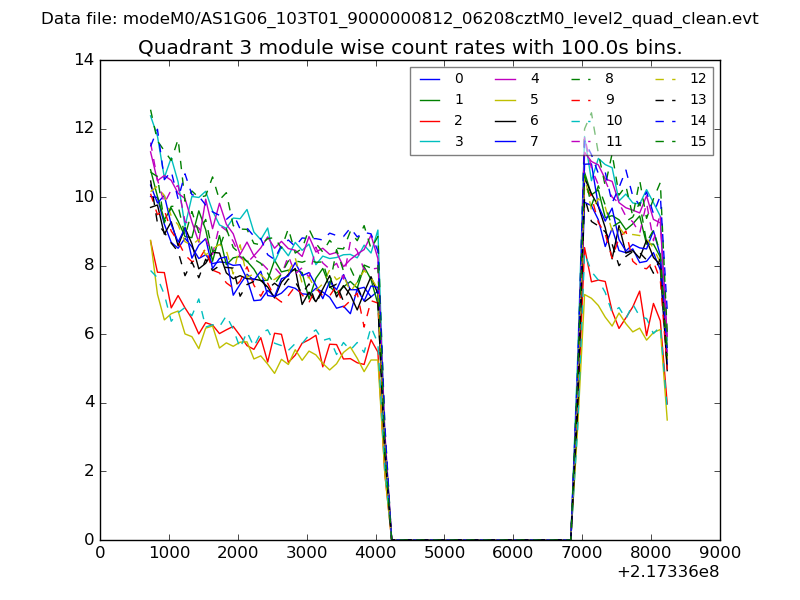
| Module-wise count rates for Quadrant C Data is divided into 100 sec bins |
 |
 |
| Module-wise count rates for Quadrant D Data is divided into 100 sec bins |
 |
 |
| Parameter | Plot |
|---|---|
| CZT HV Monitor | 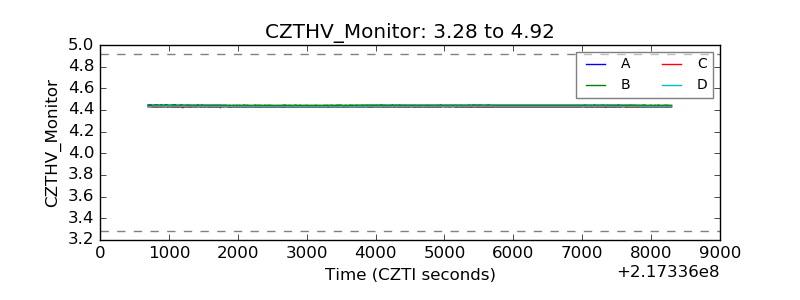 |
| D_VDD | 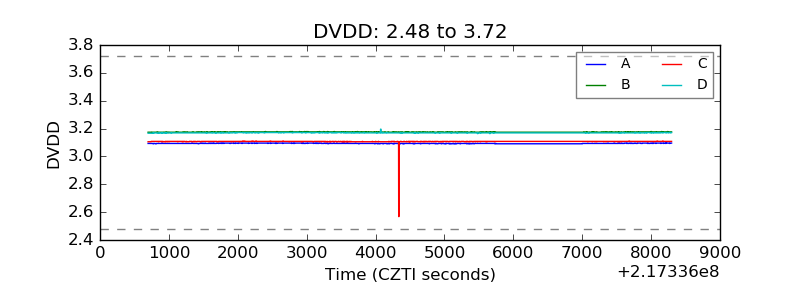 |
| Temperature 1 | 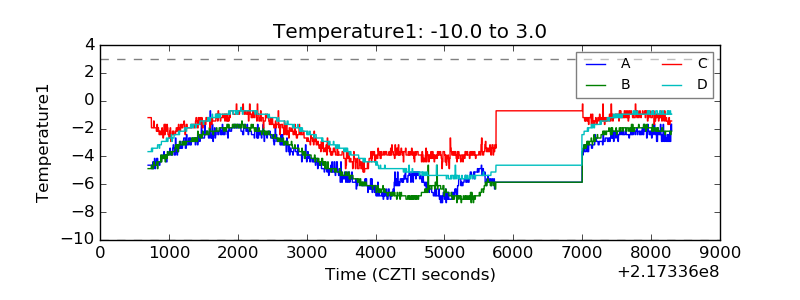 |
| Veto HV Monitor | 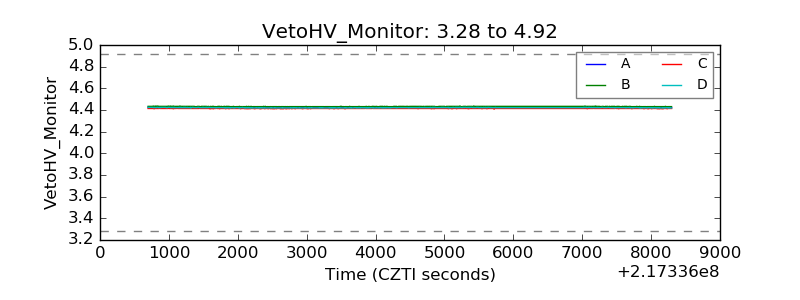 |
| Veto LLD | 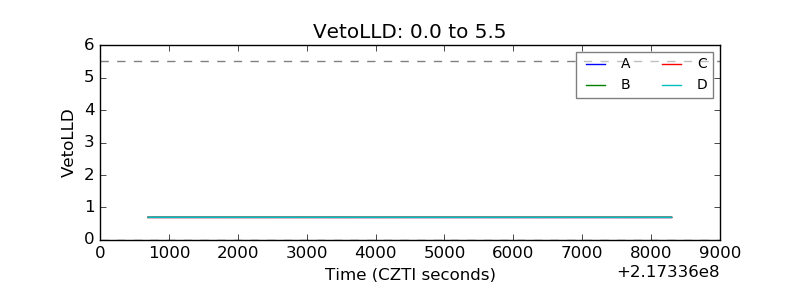 |
| Alpha Counter | 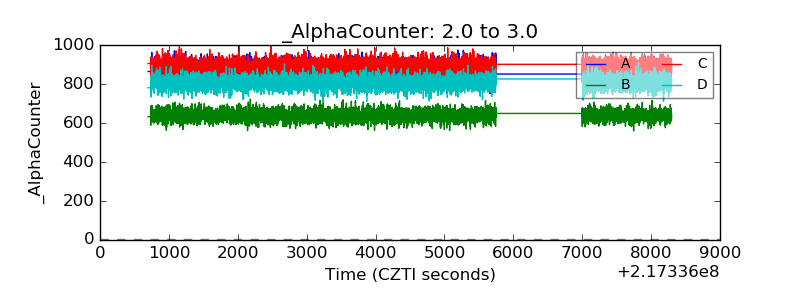 |
| _CPM_Rate | 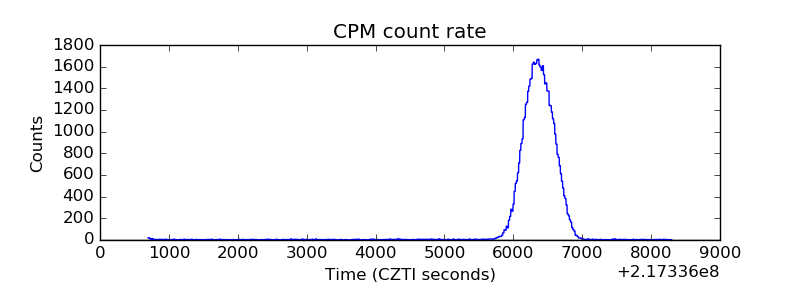 |
| CZT Counter | 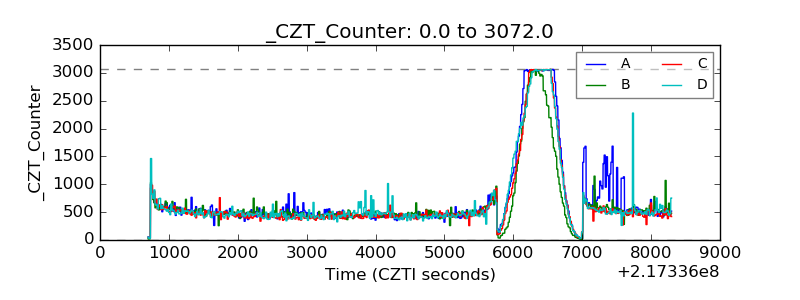 |
| +2.5 Volts monitor |  |
| +5 Volts monitor |  |
| _ROLL_ROT | 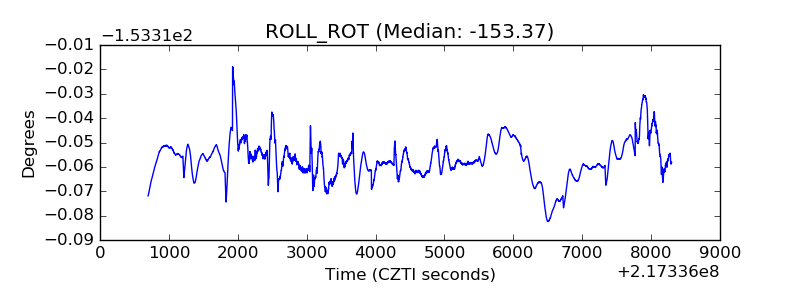 |
| _Roll_DEC | 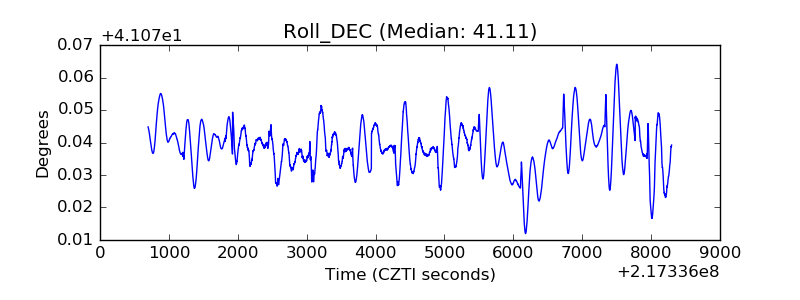 |
| _Roll_RA | 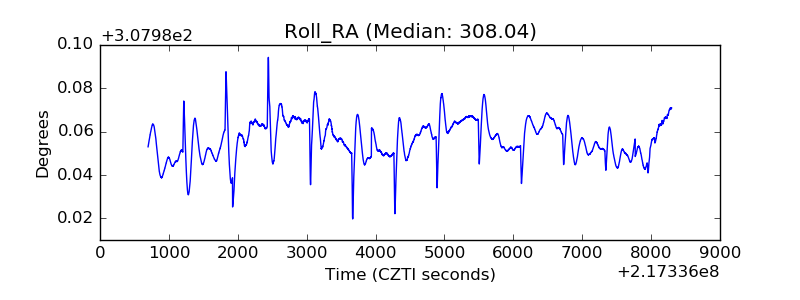 |
| Veto Counter | 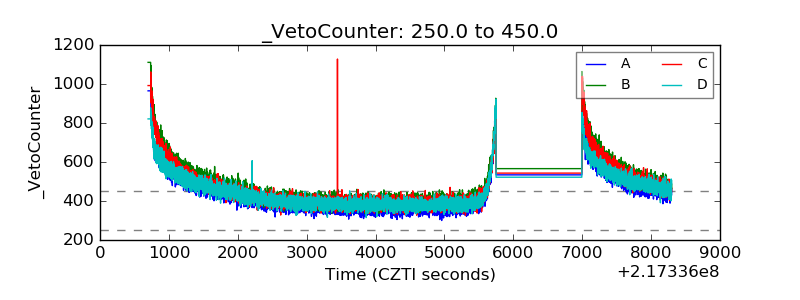 |