| Param | Original file | Final file |
|---|---|---|
| Filename | modeM0/AS1G06_103T01_9000000812_06209cztM0_level2.evt | modeM0/AS1G06_103T01_9000000812_06209cztM0_level2_quad_clean.evt |
| Size (bytes) | 432,342,720 | 93,291,840 |
| Size | 412.3 MB | 89.0 MB |
| Events in quadrant A | 3,299,691 | 606,042 |
| Events in quadrant B | 3,251,173 | 615,004 |
| Events in quadrant C | 2,940,613 | 595,421 |
| Events in quadrant D | 3,177,892 | 573,379 |
| Mode SS | |||
|---|---|---|---|
| Quadrant | BADHDUFLAG | Total packets | Discarded packets |
| A | 0 | 126 | 0 |
| B | 0 | 126 | 0 |
| C | 0 | 126 | 0 |
| D | 0 | 126 | 0 |
| Mode M9 | |||
|---|---|---|---|
| Quadrant | BADHDUFLAG | Total packets | Discarded packets |
| A | 0 | 13 | 0 |
| B | 0 | 13 | 0 |
| C | 0 | 13 | 0 |
| D | 0 | 13 | 0 |
| Mode M0 | |||
|---|---|---|---|
| Quadrant | BADHDUFLAG | Total packets | Discarded packets |
| A | 0 | 13791 | 2 |
| B | 0 | 13577 | 1 |
| C | 0 | 12812 | 1 |
| D | 0 | 13407 | 1 |
| Quadrant | Total seconds | Saturated seconds | Saturation percentage |
|---|---|---|---|
| A | 6242 | 78 | 1.249599% |
| B | 6242 | 81 | 1.297661% |
| C | 6242 | 35 | 0.560718% |
| D | 6242 | 65 | 1.041333% |
Noise dominated data is calculated using 1-second bins in cleaned event files. If a bin has >2000 counts, and if more than 50% of those come from <1% of pixels, then it is considered to be noise-dominated and hence unusable.
| Quadrant | # 1 sec bins | Bins with >0 counts | Bins with >2000 counts | High rate bins dominated by noise | Noise dominated (total time) | Noise dominated (detector-on time) | Marked lightcurve |
|---|---|---|---|---|---|---|---|
| A | 7547 | 6243 | 2 | 2 | 0.03% | 0.03% | 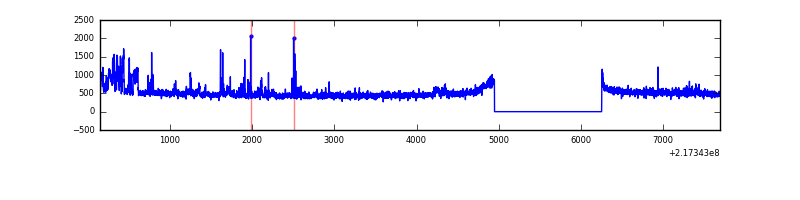 |
| B | 7547 | 6242 | 11 | 11 | 0.15% | 0.18% | 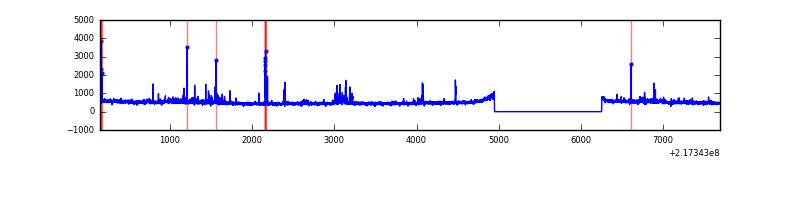 |
| C | 7547 | 6242 | 0 | 0 | 0.00% | 0.00% |  |
| D | 7547 | 6243 | 4 | 4 | 0.05% | 0.06% | 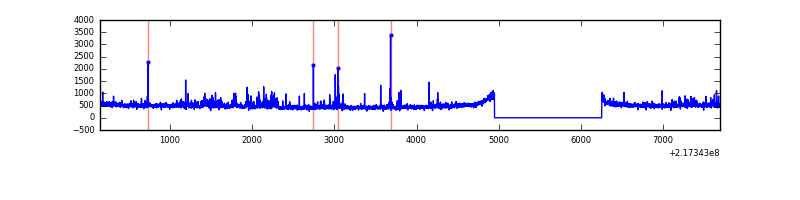 |
Top three noisy pixels from each quadrant. If the there are fewer than three noisy pixels in the level2.evt file, extra rows are filled as -1
| Pixel properties | Quadrant properties | ||||||
|---|---|---|---|---|---|---|---|
| Quadrant | DetID | PixID | Counts | Sigma | Mean | Median | Sigma |
| A | 8 | 192 | 200090 | 1285.14 | 772 | 757 | 155.1 |
| A | 8 | 15 | 120136 | 769.66 | 772 | 757 | 155.1 |
| A | 12 | 194 | 7639 | 44.37 | 772 | 757 | 155.1 |
| B | 0 | 214 | 67990 | 461.88 | 774 | 757 | 145.6 |
| B | 10 | 246 | 44035 | 297.32 | 774 | 757 | 145.6 |
| B | 15 | 35 | 43392 | 292.9 | 774 | 757 | 145.6 |
| C | 1 | 16 | 26551 | 150.2 | 746 | 753 | 171.8 |
| C | 13 | 61 | 5995 | 30.52 | 746 | 753 | 171.8 |
| C | 9 | 54 | 3941 | 18.56 | 746 | 753 | 171.8 |
| D | 2 | 136 | 107425 | 587.86 | 753 | 732 | 181.5 |
| D | 5 | 97 | 55897 | 303.95 | 753 | 732 | 181.5 |
| D | 12 | 221 | 39231 | 212.12 | 753 | 732 | 181.5 |
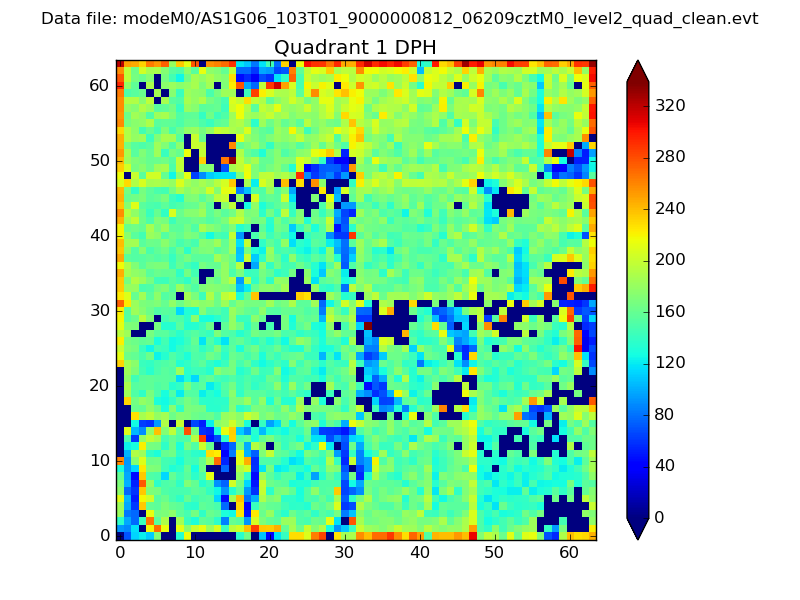
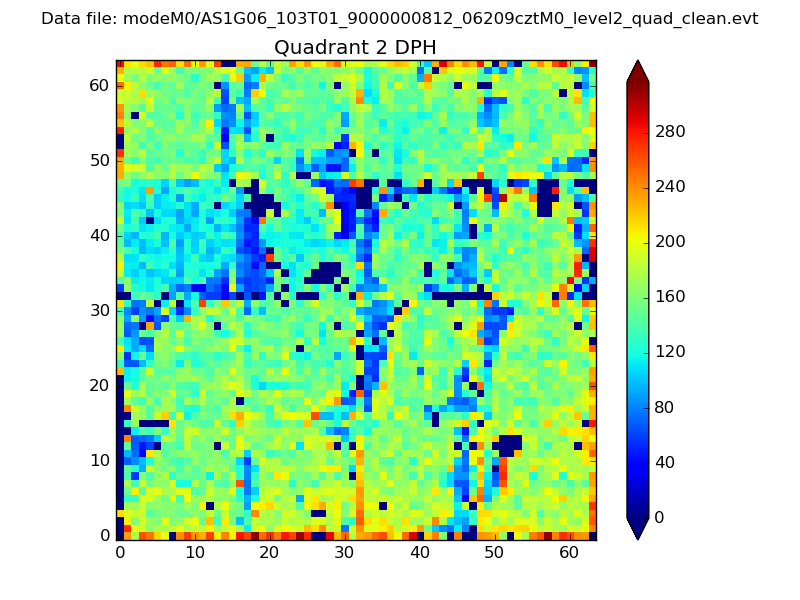
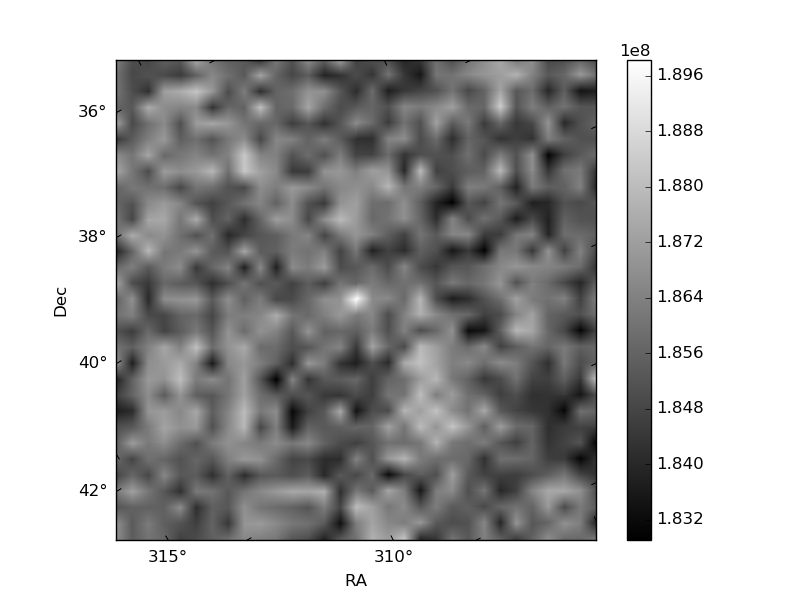
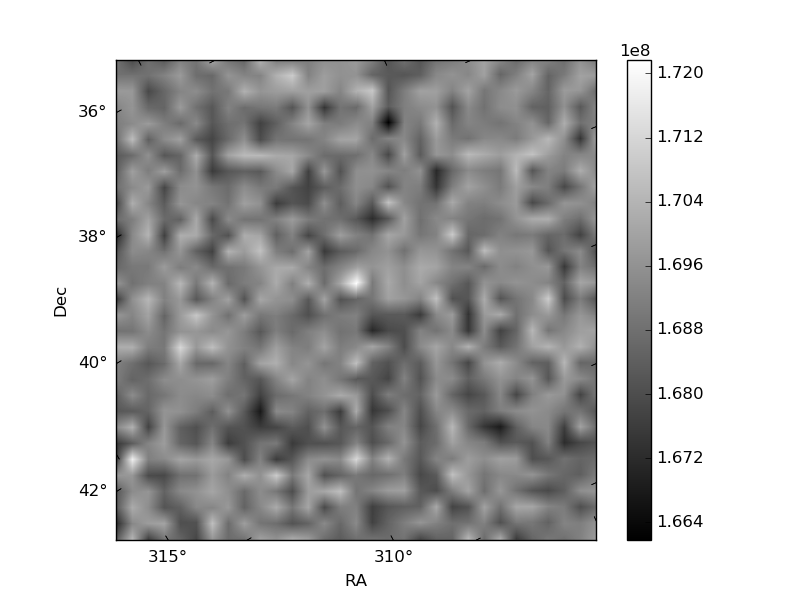
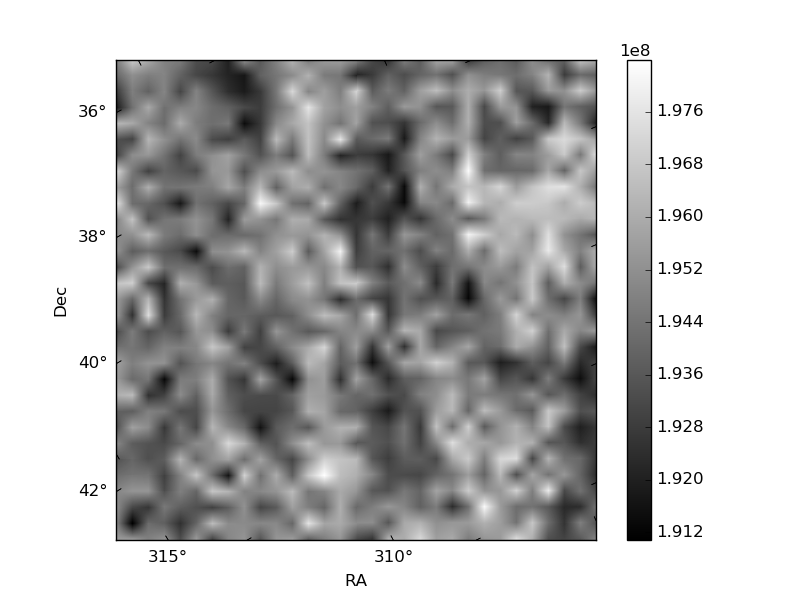
Histogram calculated using DETX and DETY for each event in the final _common_clean file
| Quadrant A | 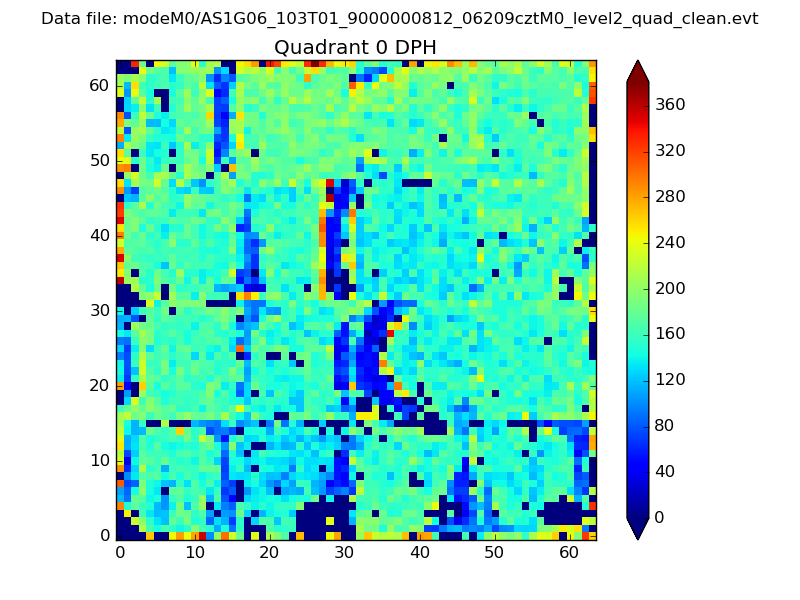 |
 |
Quadrant B |
|---|---|---|---|
| Quadrant D | 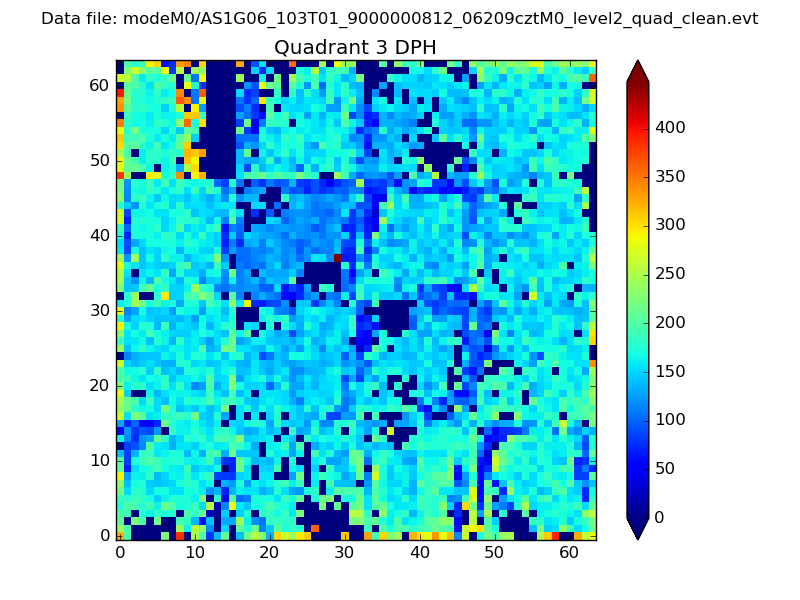 |
 |
Quadrant C |
| Plot type | Count rate plots | Images |
|---|---|---|
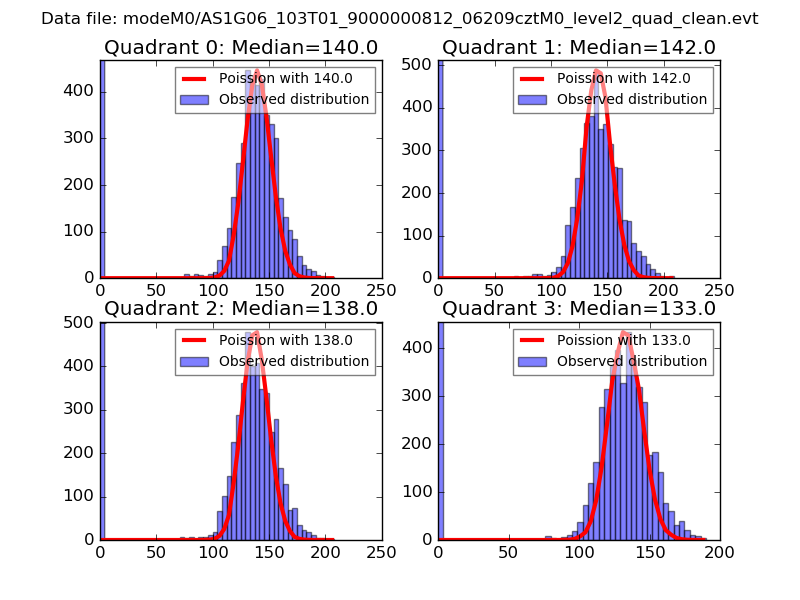
| Comparison with Poisson distribution Blue bars denote a histogram of data divided into 1 sec bins. Red curve is a Poisson curve with rate = median count rate of data. |
 |
 |
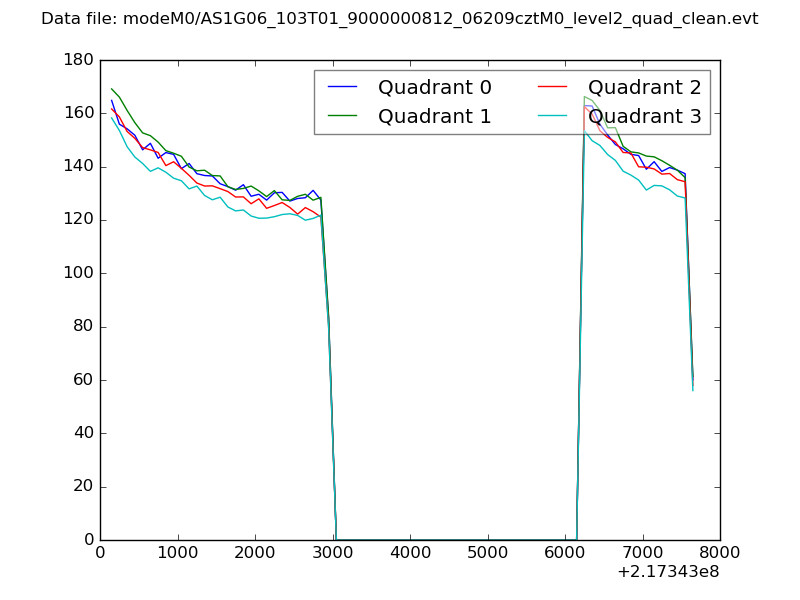
| Quadrant-wise count rates Data is divided into 100 sec bins |
 |
|
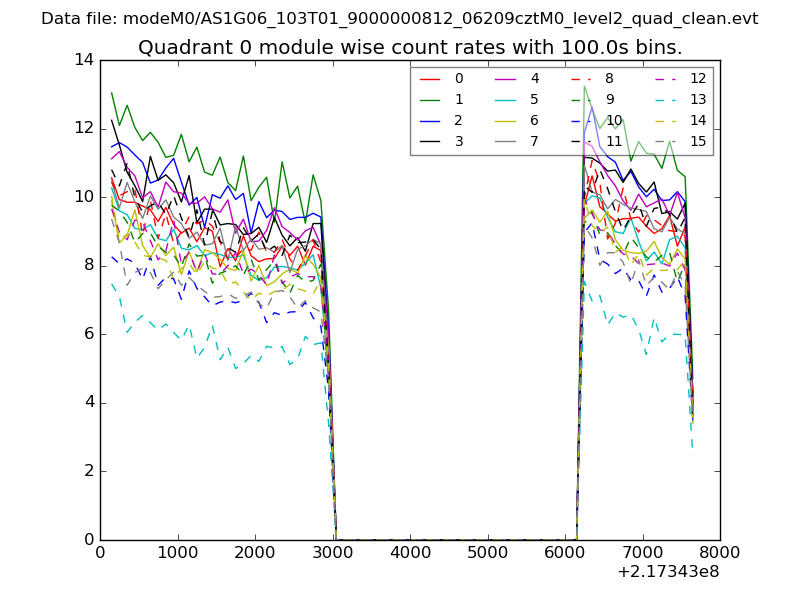
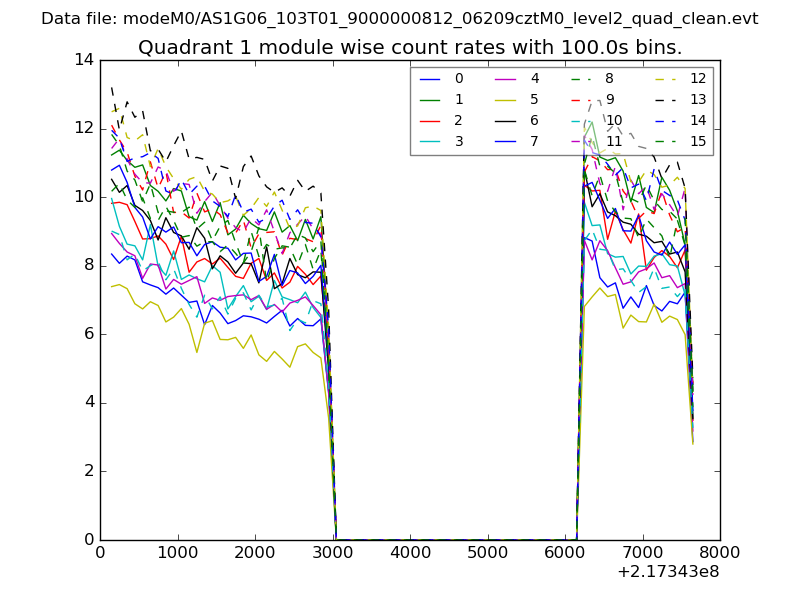
| Module-wise count rates for Quadrant A Data is divided into 100 sec bins |
 |
 |
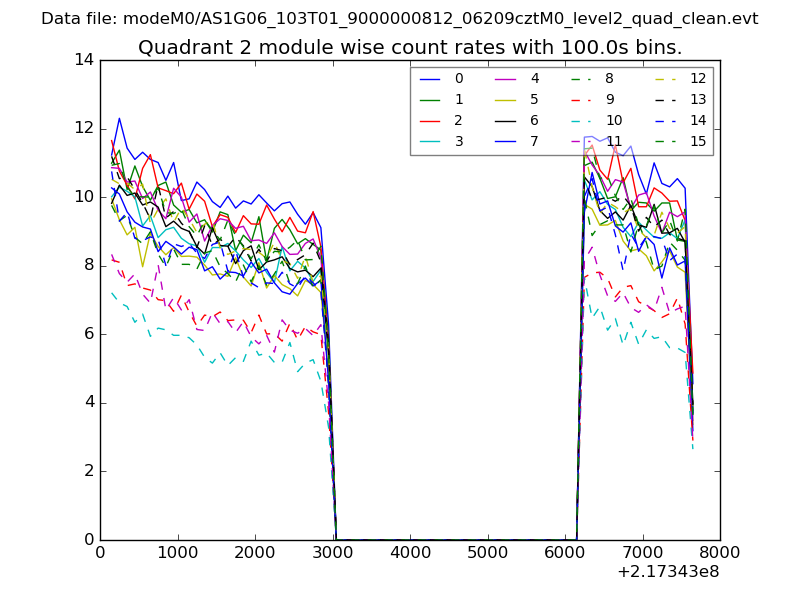
| Module-wise count rates for Quadrant B Data is divided into 100 sec bins |
 |
 |
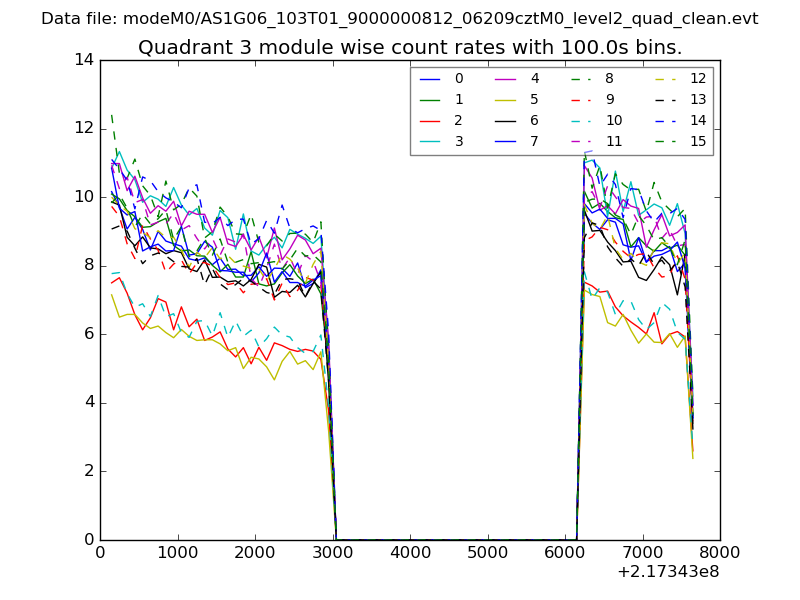
| Module-wise count rates for Quadrant C Data is divided into 100 sec bins |
 |
 |
| Module-wise count rates for Quadrant D Data is divided into 100 sec bins |
 |
 |
| Parameter | Plot |
|---|---|
| CZT HV Monitor | 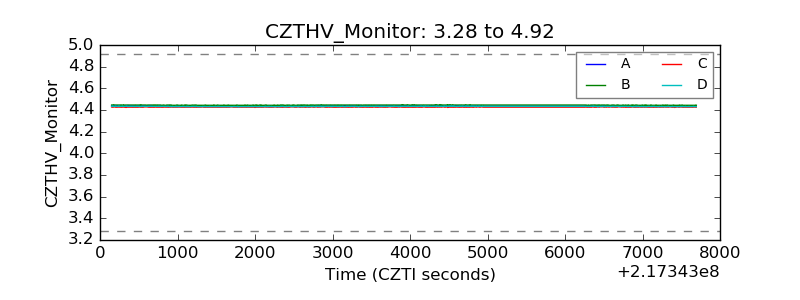 |
| D_VDD | 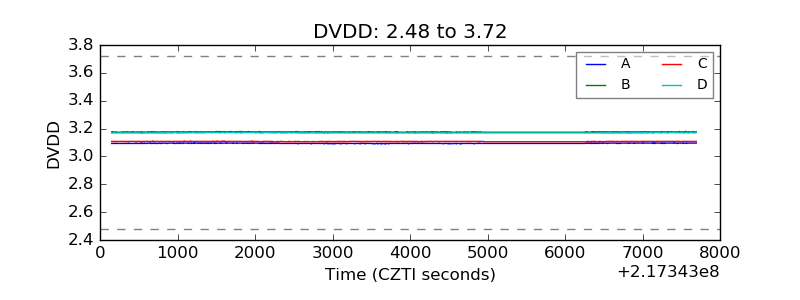 |
| Temperature 1 | 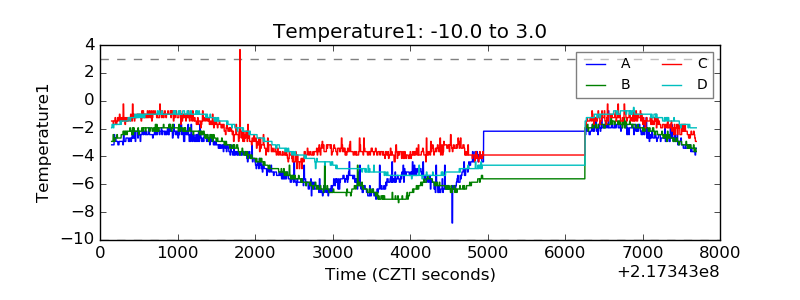 |
| Veto HV Monitor | 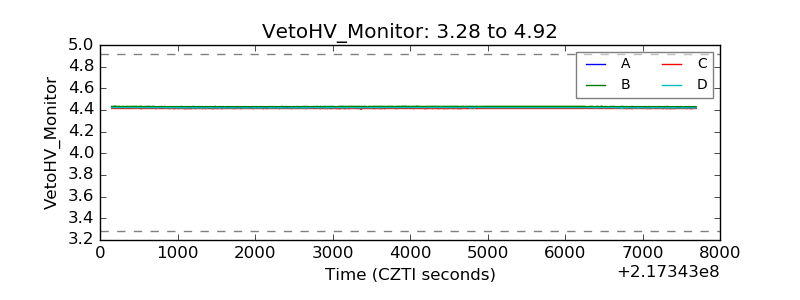 |
| Veto LLD | 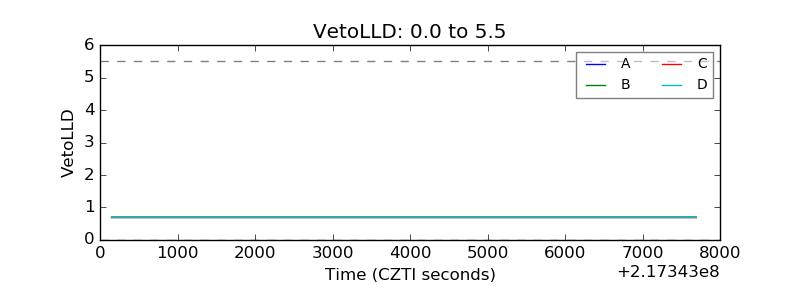 |
| Alpha Counter | 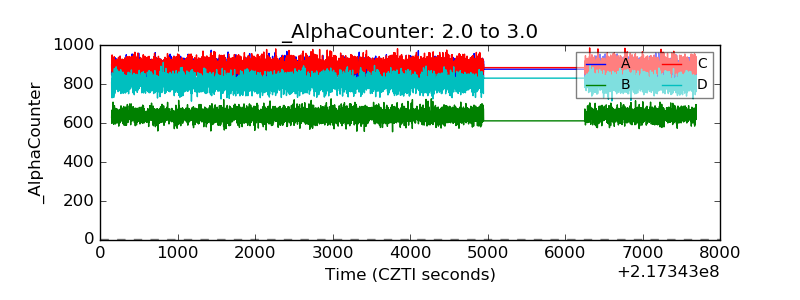 |
| _CPM_Rate | 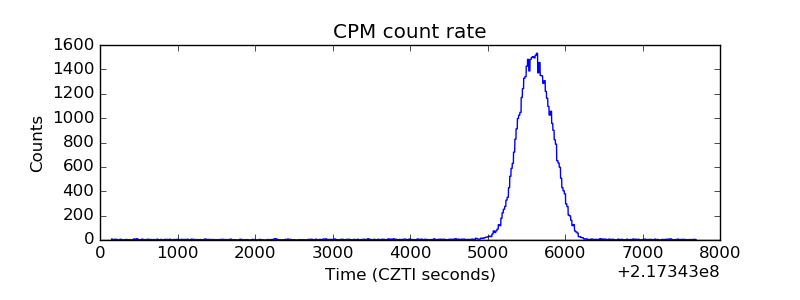 |
| CZT Counter | 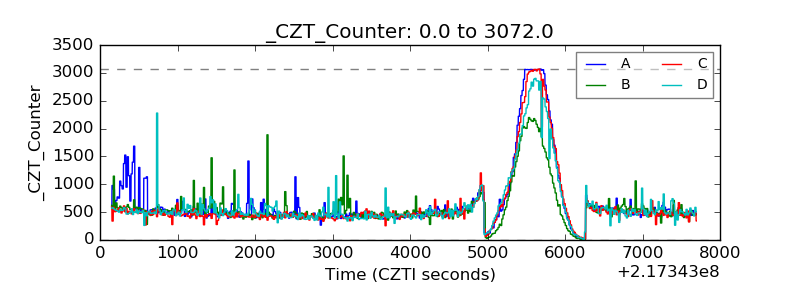 |
| +2.5 Volts monitor |  |
| +5 Volts monitor |  |
| _ROLL_ROT | 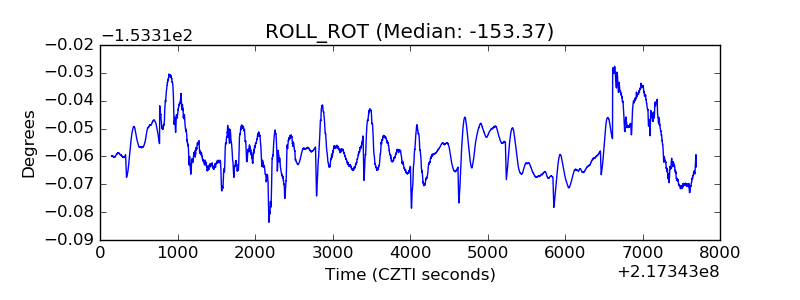 |
| _Roll_DEC | 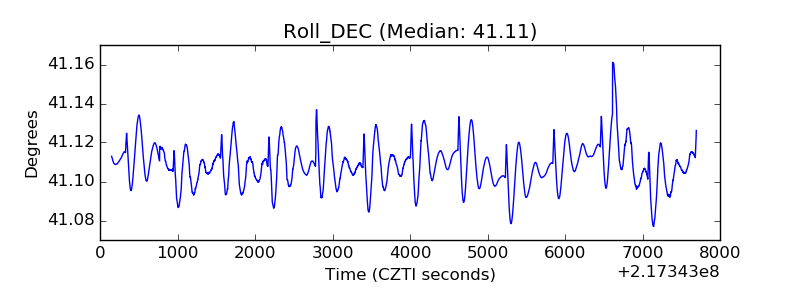 |
| _Roll_RA | 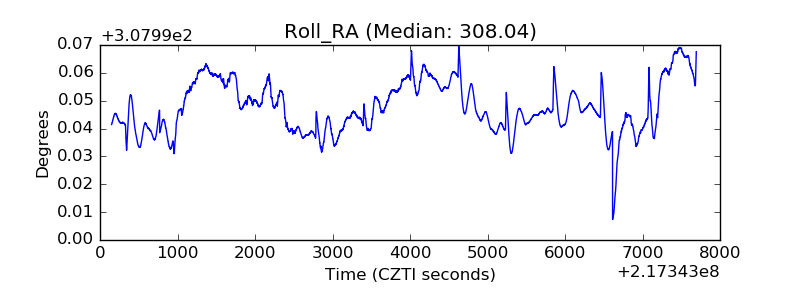 |
| Veto Counter | 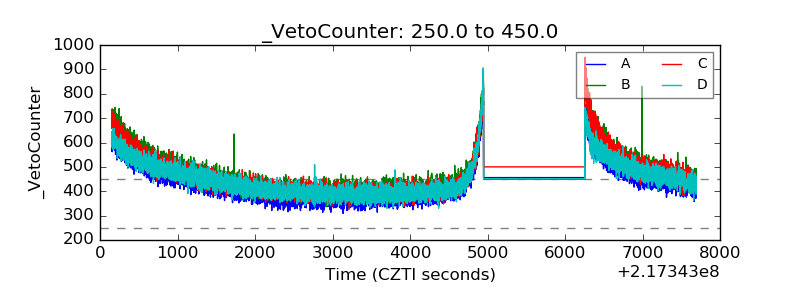 |