| Param | Original file | Final file |
|---|---|---|
| Filename | modeM0/AS1G06_103T01_9000000812_06210cztM0_level2.evt | modeM0/AS1G06_103T01_9000000812_06210cztM0_level2_quad_clean.evt |
| Size (bytes) | 416,972,160 | 84,801,600 |
| Size | 397.7 MB | 80.9 MB |
| Events in quadrant A | 3,015,879 | 540,381 |
| Events in quadrant B | 3,055,769 | 550,247 |
| Events in quadrant C | 2,870,739 | 538,797 |
| Events in quadrant D | 3,270,975 | 512,833 |
| Mode SS | |||
|---|---|---|---|
| Quadrant | BADHDUFLAG | Total packets | Discarded packets |
| A | 0 | 124 | 0 |
| B | 0 | 124 | 0 |
| C | 0 | 124 | 0 |
| D | 0 | 124 | 0 |
| Mode M9 | |||
|---|---|---|---|
| Quadrant | BADHDUFLAG | Total packets | Discarded packets |
| A | 0 | 13 | 0 |
| B | 0 | 13 | 0 |
| C | 0 | 13 | 0 |
| D | 0 | 13 | 0 |
| Mode M0 | |||
|---|---|---|---|
| Quadrant | BADHDUFLAG | Total packets | Discarded packets |
| A | 0 | 12805 | 2 |
| B | 0 | 13049 | 1 |
| C | 0 | 12582 | 1 |
| D | 0 | 13665 | 1 |
| Quadrant | Total seconds | Saturated seconds | Saturation percentage |
|---|---|---|---|
| A | 6098 | 102 | 1.672680% |
| B | 6098 | 88 | 1.443096% |
| C | 6098 | 62 | 1.016727% |
| D | 6098 | 93 | 1.525090% |
Noise dominated data is calculated using 1-second bins in cleaned event files. If a bin has >2000 counts, and if more than 50% of those come from <1% of pixels, then it is considered to be noise-dominated and hence unusable.
| Quadrant | # 1 sec bins | Bins with >0 counts | Bins with >2000 counts | High rate bins dominated by noise | Noise dominated (total time) | Noise dominated (detector-on time) | Marked lightcurve |
|---|---|---|---|---|---|---|---|
| A | 7353 | 6098 | 7 | 7 | 0.10% | 0.11% | 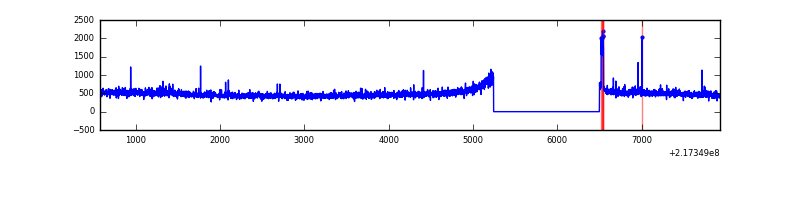 |
| B | 7353 | 6099 | 3 | 3 | 0.04% | 0.05% | 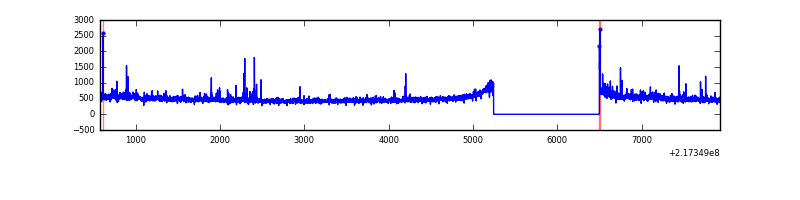 |
| C | 7353 | 6098 | 0 | 0 | 0.00% | 0.00% | 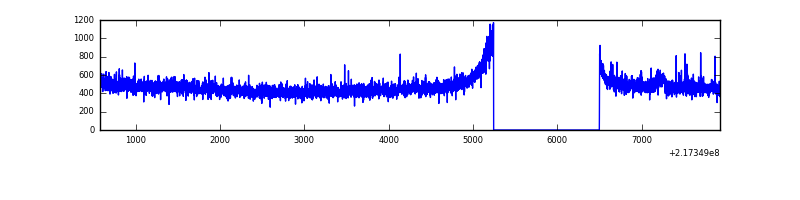 |
| D | 7353 | 6098 | 12 | 12 | 0.16% | 0.20% | 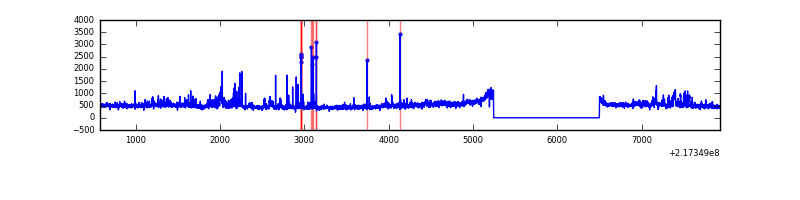 |
Top three noisy pixels from each quadrant. If the there are fewer than three noisy pixels in the level2.evt file, extra rows are filled as -1
| Pixel properties | Quadrant properties | ||||||
|---|---|---|---|---|---|---|---|
| Quadrant | DetID | PixID | Counts | Sigma | Mean | Median | Sigma |
| A | 8 | 15 | 135198 | 897.52 | 737 | 721 | 149.8 |
| A | 8 | 192 | 37270 | 243.93 | 737 | 721 | 149.8 |
| A | 0 | 31 | 8140 | 49.52 | 737 | 721 | 149.8 |
| B | 0 | 214 | 63371 | 448.14 | 740 | 723 | 139.8 |
| B | 15 | 204 | 31343 | 219.03 | 740 | 723 | 139.8 |
| B | 0 | 219 | 25532 | 177.47 | 740 | 723 | 139.8 |
| C | 1 | 16 | 48182 | 287.51 | 721 | 724 | 165.1 |
| C | 9 | 54 | 8388 | 46.43 | 721 | 724 | 165.1 |
| C | 13 | 61 | 5576 | 29.39 | 721 | 724 | 165.1 |
| D | 2 | 136 | 102862 | 581.57 | 724 | 703 | 175.7 |
| D | 8 | 230 | 88976 | 502.52 | 724 | 703 | 175.7 |
| D | 13 | 200 | 87933 | 496.58 | 724 | 703 | 175.7 |
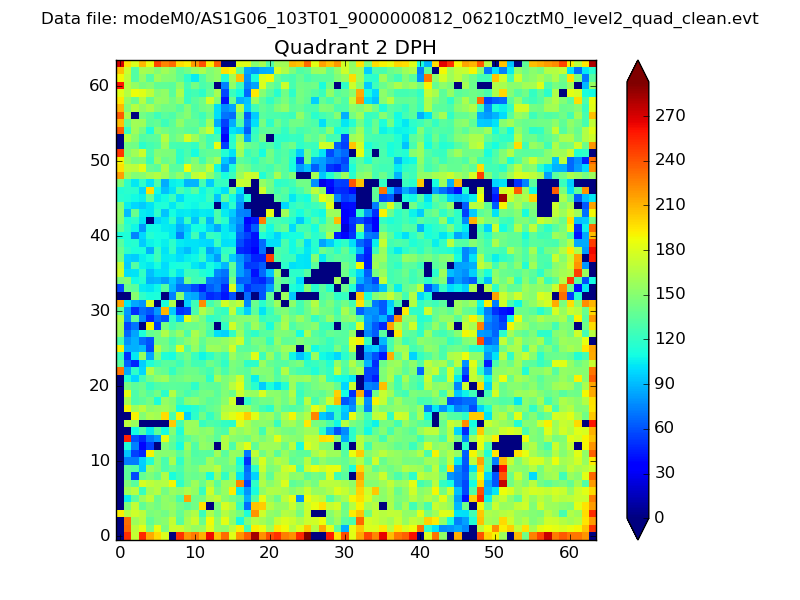
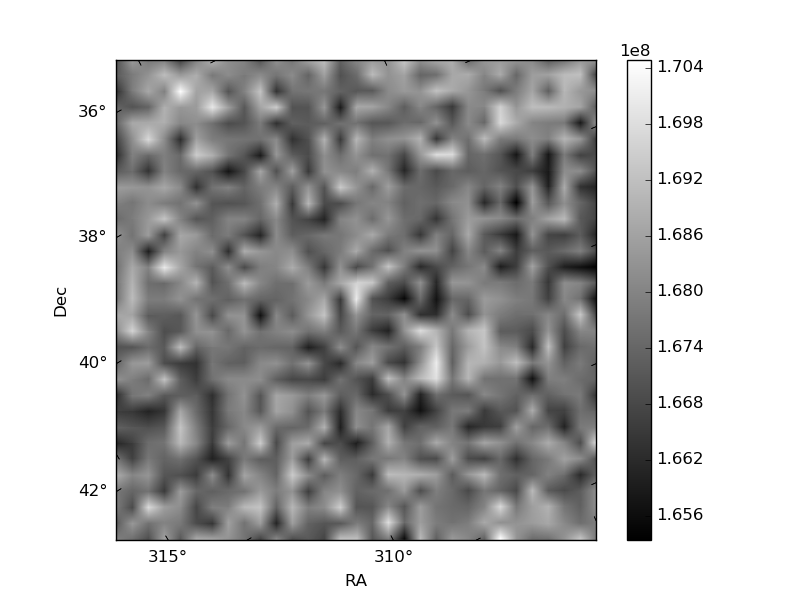
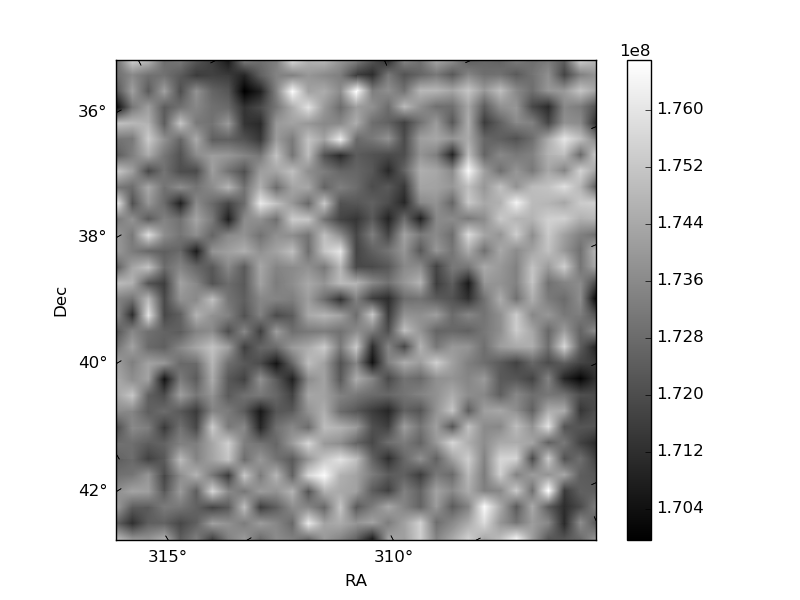
Histogram calculated using DETX and DETY for each event in the final _common_clean file
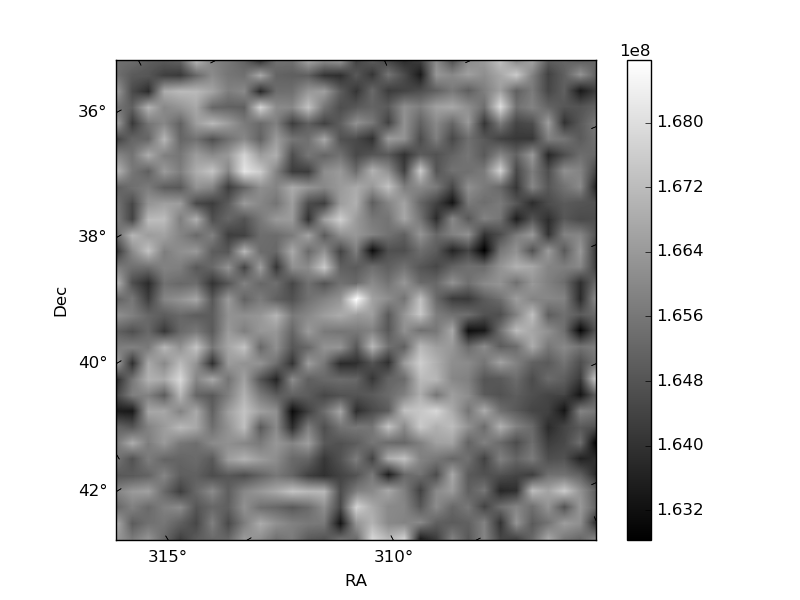
| Quadrant A | 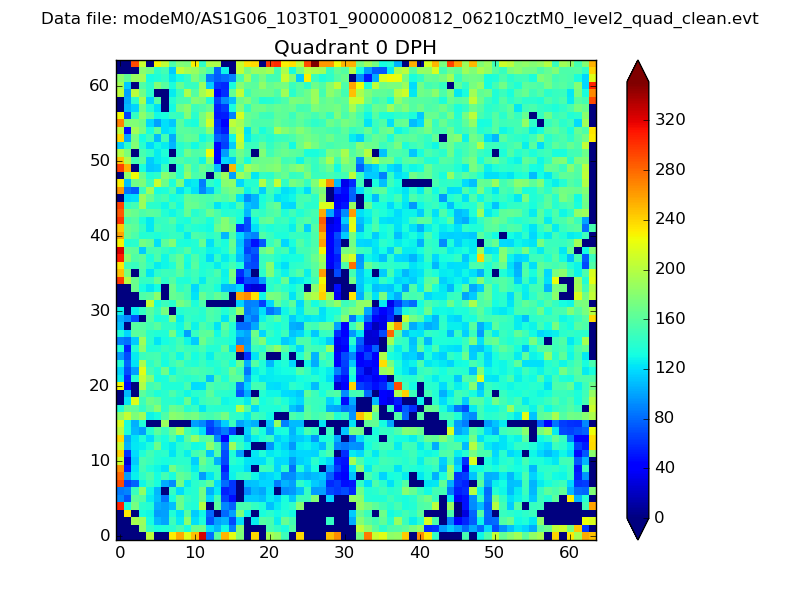 |
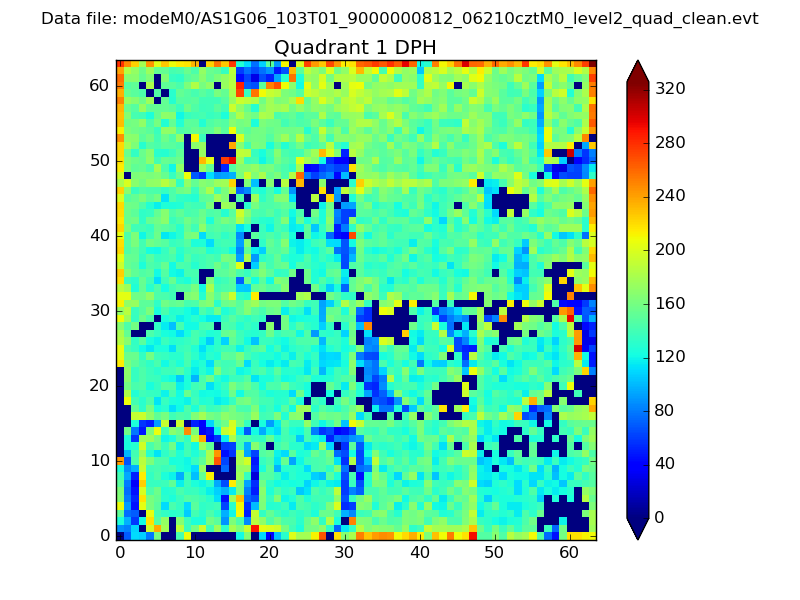 |
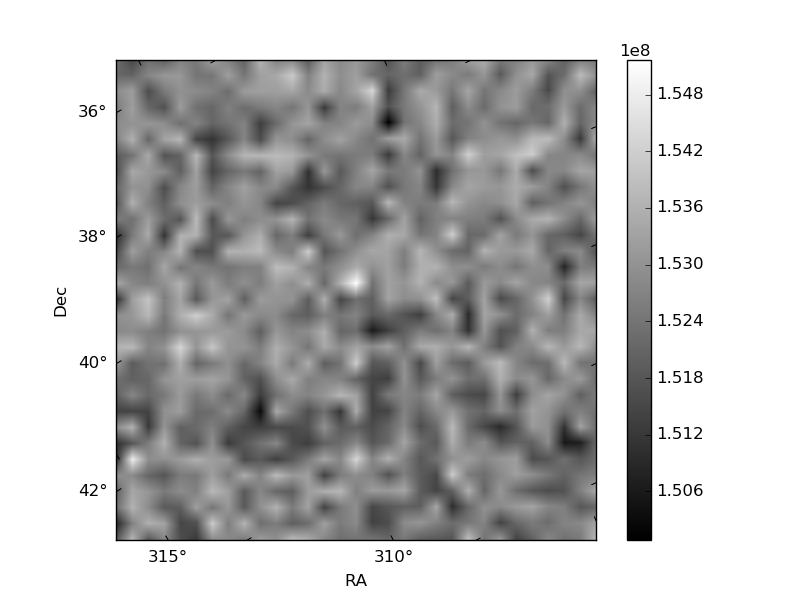
Quadrant B |
|---|---|---|---|
| Quadrant D | 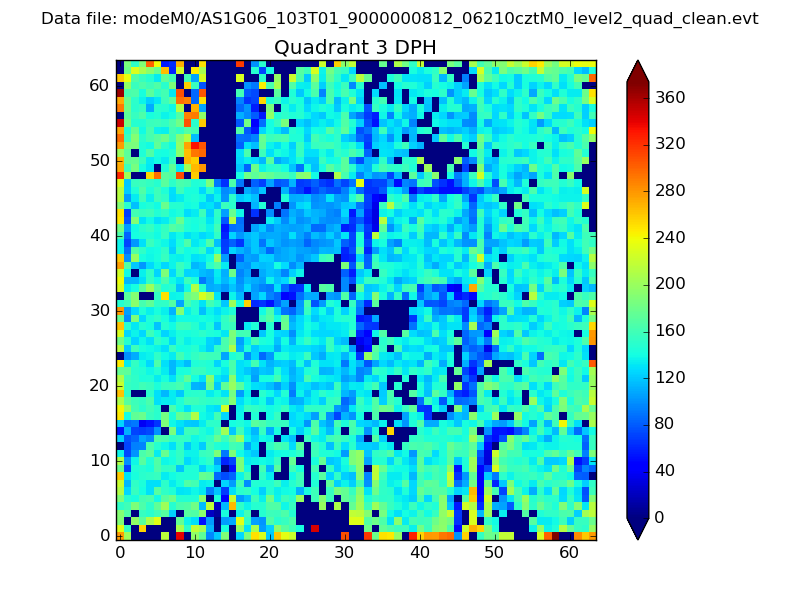 |
 |
Quadrant C |
| Plot type | Count rate plots | Images |
|---|---|---|
| Comparison with Poisson distribution Blue bars denote a histogram of data divided into 1 sec bins. Red curve is a Poisson curve with rate = median count rate of data. |
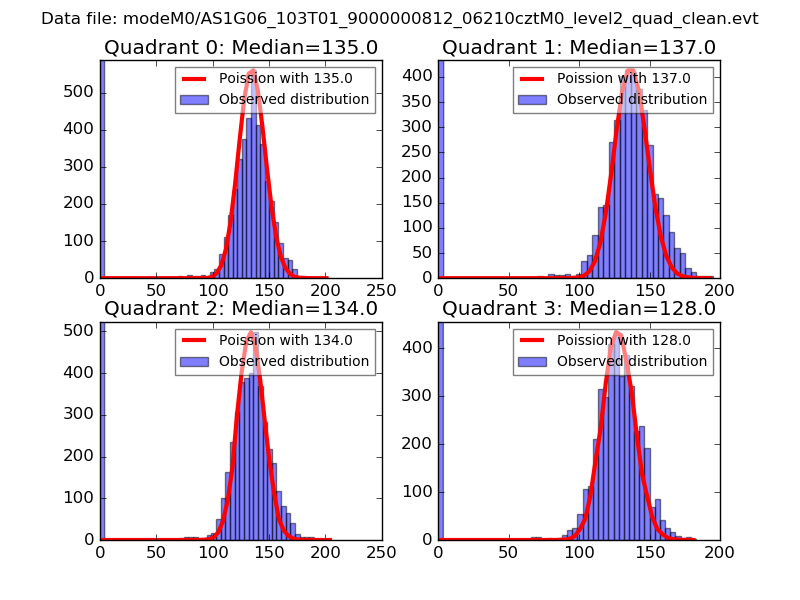 |
 |
| Quadrant-wise count rates Data is divided into 100 sec bins |
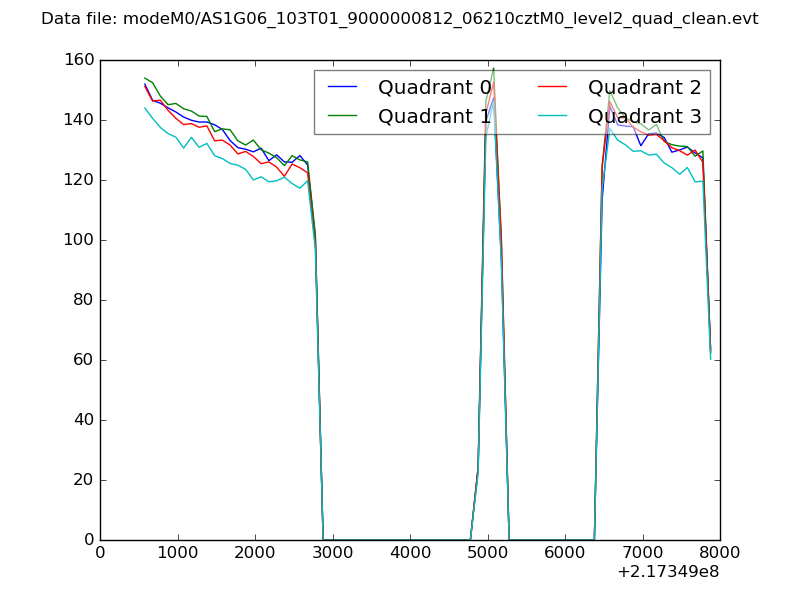 |
|
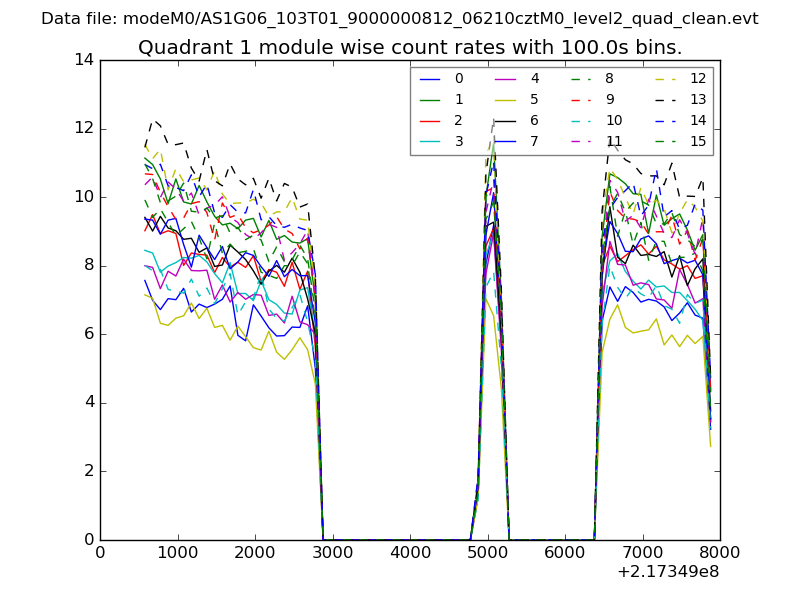
| Module-wise count rates for Quadrant A Data is divided into 100 sec bins |
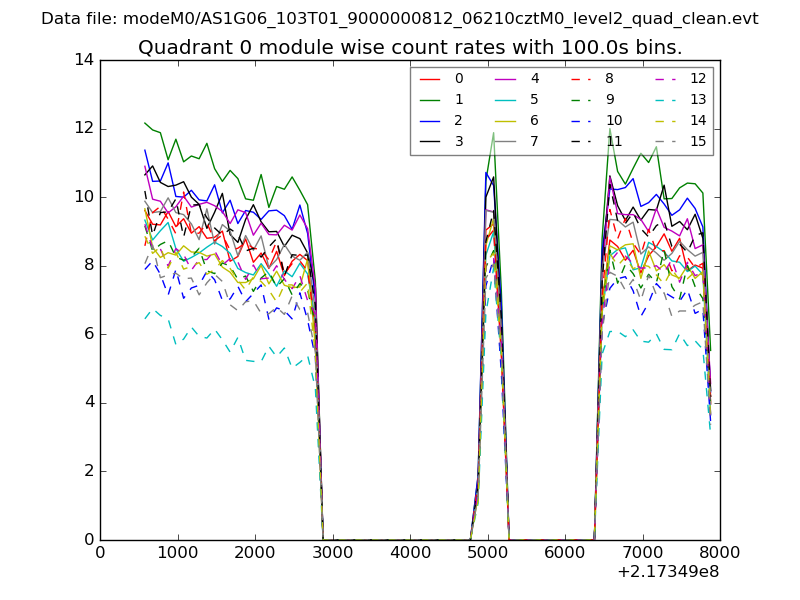 |
 |
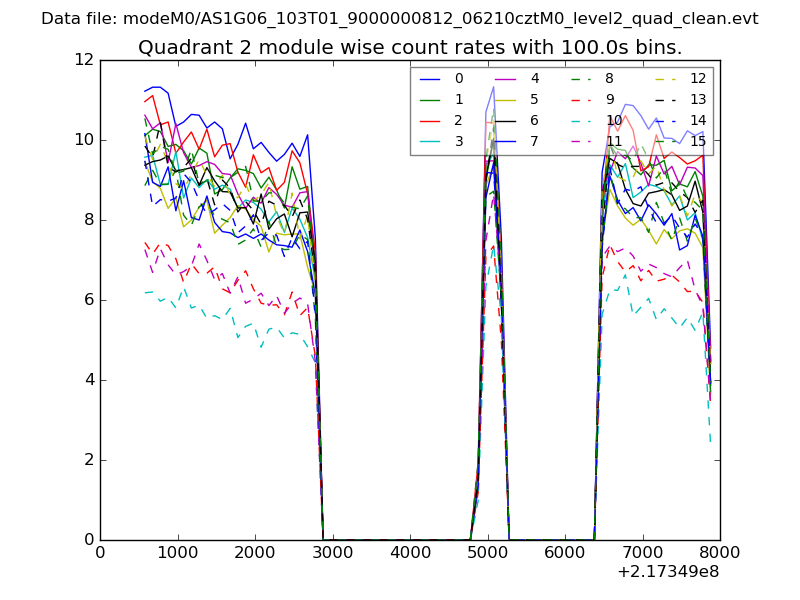
| Module-wise count rates for Quadrant B Data is divided into 100 sec bins |
 |
 |
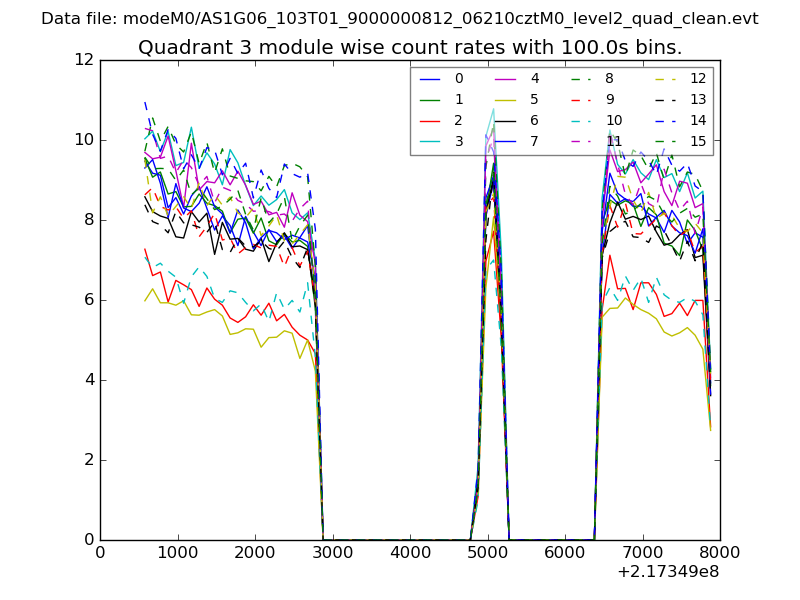
| Module-wise count rates for Quadrant C Data is divided into 100 sec bins |
 |
 |
| Module-wise count rates for Quadrant D Data is divided into 100 sec bins |
 |
 |
| Parameter | Plot |
|---|---|
| CZT HV Monitor | 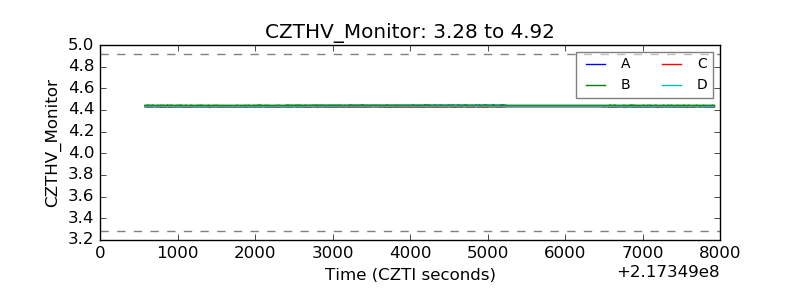 |
| D_VDD | 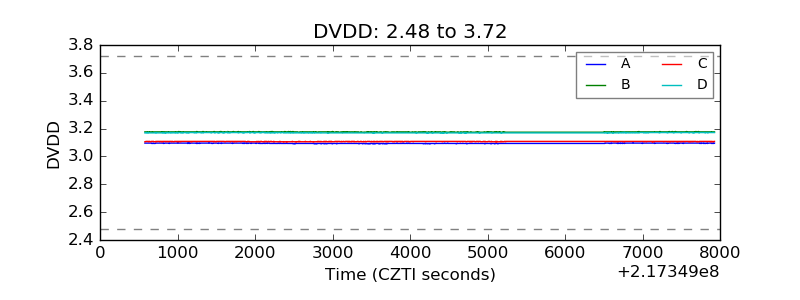 |
| Temperature 1 | 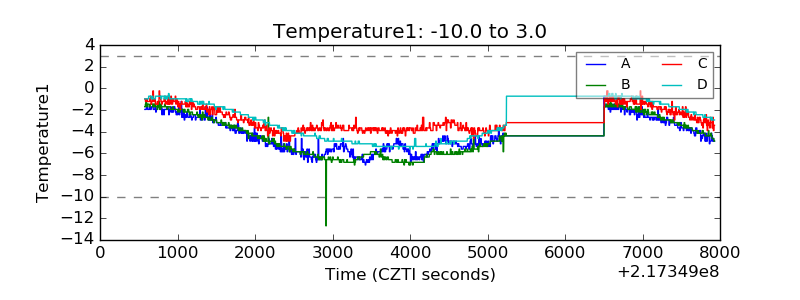 |
| Veto HV Monitor | 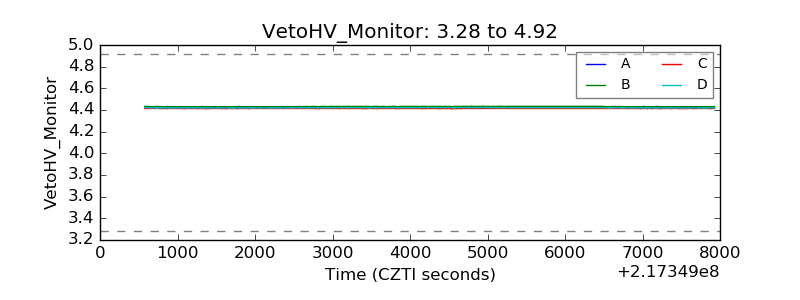 |
| Veto LLD | 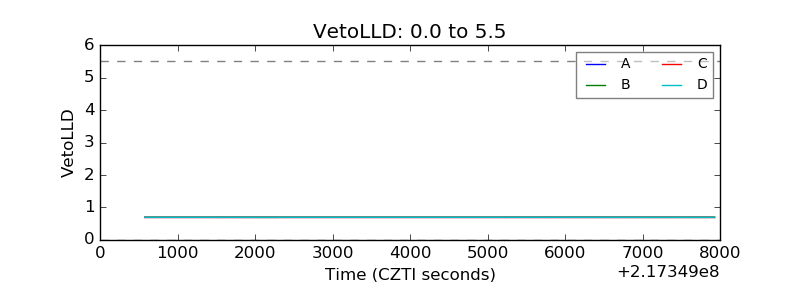 |
| Alpha Counter |  |
| _CPM_Rate | 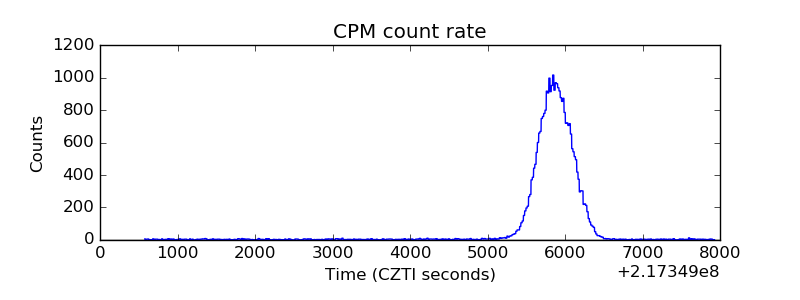 |
| CZT Counter |  |
| +2.5 Volts monitor |  |
| +5 Volts monitor |  |
| _ROLL_ROT | 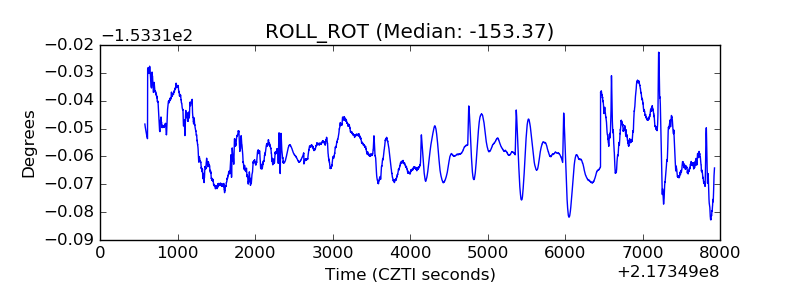 |
| _Roll_DEC | 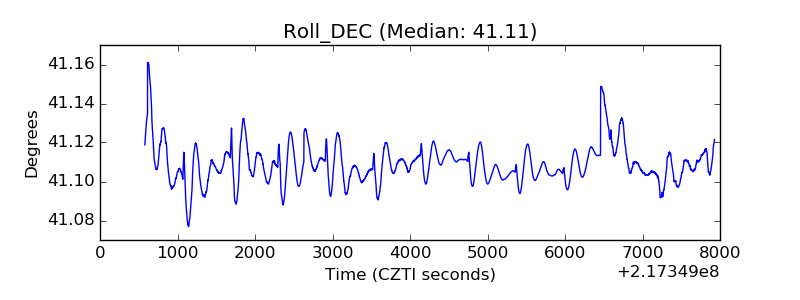 |
| _Roll_RA | 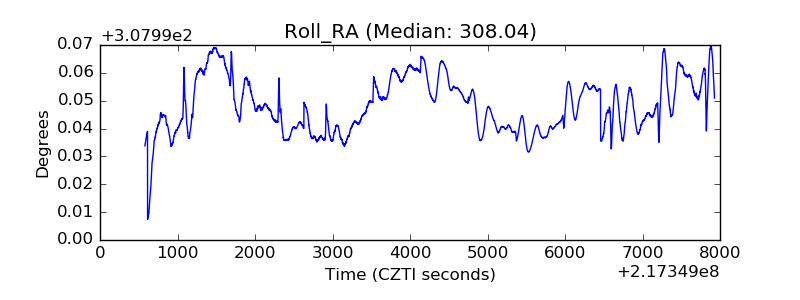 |
| Veto Counter |  |