| Param | Original file | Final file |
|---|---|---|
| Filename | modeM0/AS1G06_103T01_9000000812_06211cztM0_level2.evt | modeM0/AS1G06_103T01_9000000812_06211cztM0_level2_quad_clean.evt |
| Size (bytes) | 429,465,600 | 89,360,640 |
| Size | 409.6 MB | 85.2 MB |
| Events in quadrant A | 3,146,396 | 567,738 |
| Events in quadrant B | 3,222,106 | 578,138 |
| Events in quadrant C | 2,991,966 | 570,447 |
| Events in quadrant D | 3,207,666 | 540,134 |
| Mode SS | |||
|---|---|---|---|
| Quadrant | BADHDUFLAG | Total packets | Discarded packets |
| A | 0 | 130 | 0 |
| B | 0 | 130 | 0 |
| C | 0 | 130 | 0 |
| D | 0 | 130 | 0 |
| Mode M9 | |||
|---|---|---|---|
| Quadrant | BADHDUFLAG | Total packets | Discarded packets |
| A | 0 | 13 | 0 |
| B | 0 | 13 | 0 |
| C | 0 | 13 | 0 |
| D | 0 | 14 | 0 |
| Mode M0 | |||
|---|---|---|---|
| Quadrant | BADHDUFLAG | Total packets | Discarded packets |
| A | 0 | 13524 | 3 |
| B | 0 | 13916 | 2 |
| C | 0 | 13308 | 2 |
| D | 0 | 14022 | 2 |
| Quadrant | Total seconds | Saturated seconds | Saturation percentage |
|---|---|---|---|
| A | 6448 | 74 | 1.147643% |
| B | 6448 | 85 | 1.318238% |
| C | 6448 | 58 | 0.899504% |
| D | 6448 | 61 | 0.946030% |
Noise dominated data is calculated using 1-second bins in cleaned event files. If a bin has >2000 counts, and if more than 50% of those come from <1% of pixels, then it is considered to be noise-dominated and hence unusable.
| Quadrant | # 1 sec bins | Bins with >0 counts | Bins with >2000 counts | High rate bins dominated by noise | Noise dominated (total time) | Noise dominated (detector-on time) | Marked lightcurve |
|---|---|---|---|---|---|---|---|
| A | 7488 | 6449 | 8 | 8 | 0.11% | 0.12% | 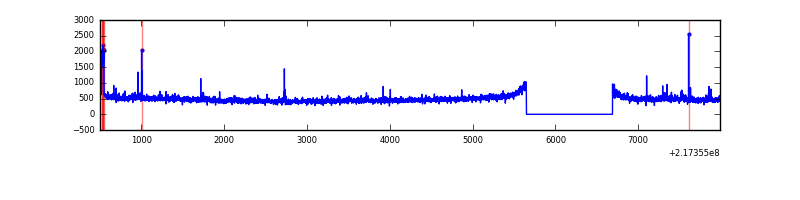 |
| B | 7488 | 6449 | 10 | 10 | 0.13% | 0.16% | 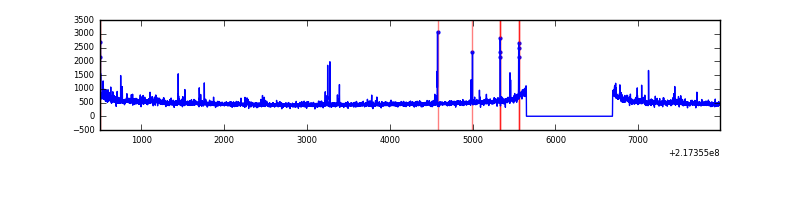 |
| C | 7488 | 6449 | 0 | 0 | 0.00% | 0.00% | 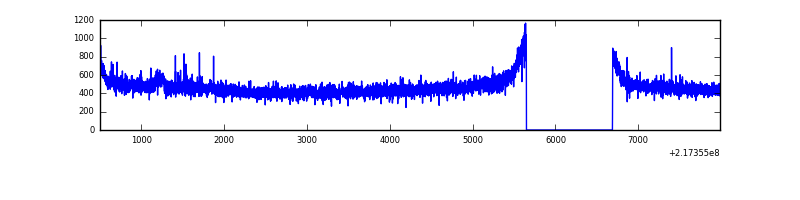 |
| D | 7488 | 6449 | 4 | 4 | 0.05% | 0.06% | 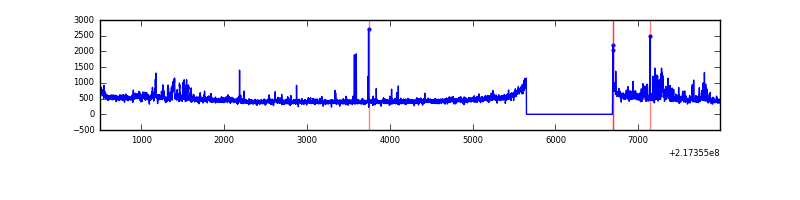 |
Top three noisy pixels from each quadrant. If the there are fewer than three noisy pixels in the level2.evt file, extra rows are filled as -1
| Pixel properties | Quadrant properties | ||||||
|---|---|---|---|---|---|---|---|
| Quadrant | DetID | PixID | Counts | Sigma | Mean | Median | Sigma |
| A | 8 | 15 | 143338 | 913.4 | 766 | 749 | 156.1 |
| A | 8 | 192 | 37296 | 234.11 | 766 | 749 | 156.1 |
| A | 0 | 31 | 8202 | 47.74 | 766 | 749 | 156.1 |
| B | 0 | 214 | 47868 | 321.4 | 773 | 754 | 146.6 |
| B | 0 | 219 | 47189 | 316.76 | 773 | 754 | 146.6 |
| B | 4 | 81 | 41094 | 275.19 | 773 | 754 | 146.6 |
| C | 1 | 16 | 38434 | 217.07 | 755 | 759 | 173.6 |
| C | 9 | 54 | 6915 | 35.47 | 755 | 759 | 173.6 |
| C | 13 | 61 | 5869 | 29.44 | 755 | 759 | 173.6 |
| D | 8 | 230 | 124582 | 667.89 | 755 | 733 | 185.4 |
| D | 2 | 136 | 83393 | 445.77 | 755 | 733 | 185.4 |
| D | 2 | 63 | 56173 | 298.98 | 755 | 733 | 185.4 |
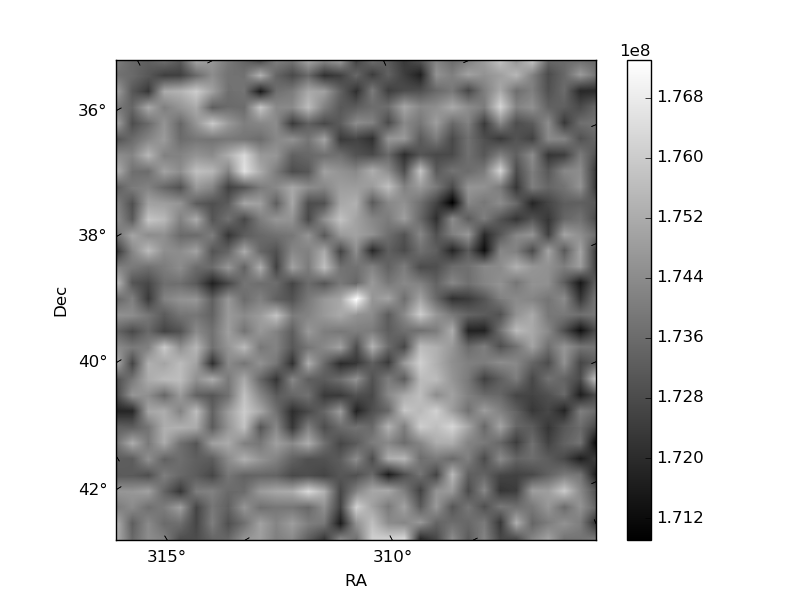
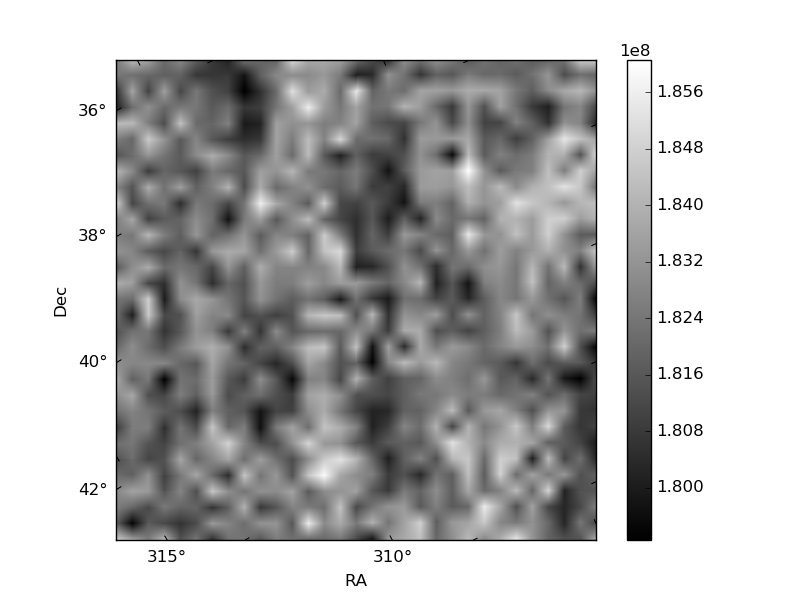
Histogram calculated using DETX and DETY for each event in the final _common_clean file
| Quadrant A | 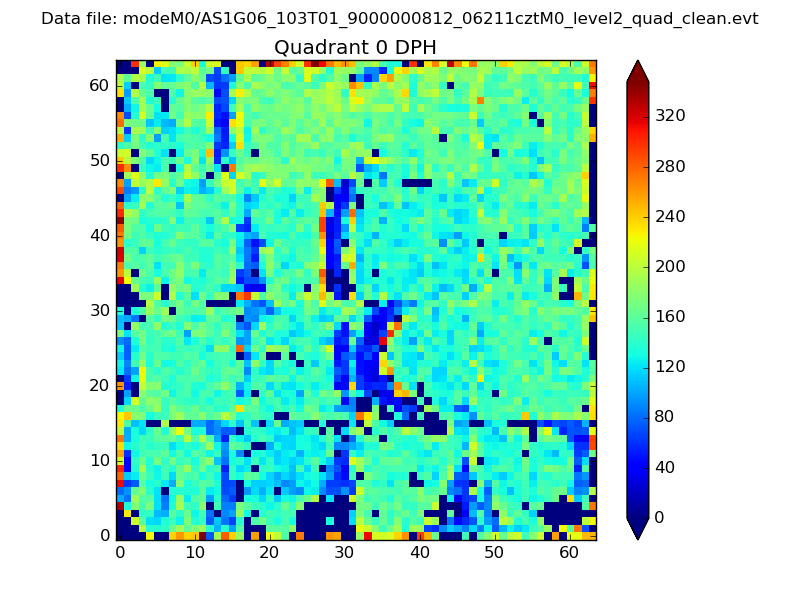 |
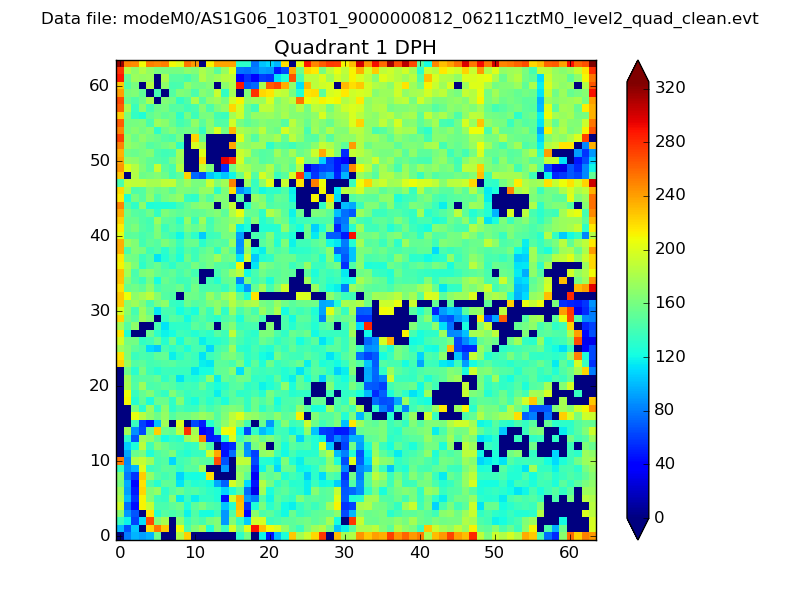 |
Quadrant B |
|---|---|---|---|
| Quadrant D | 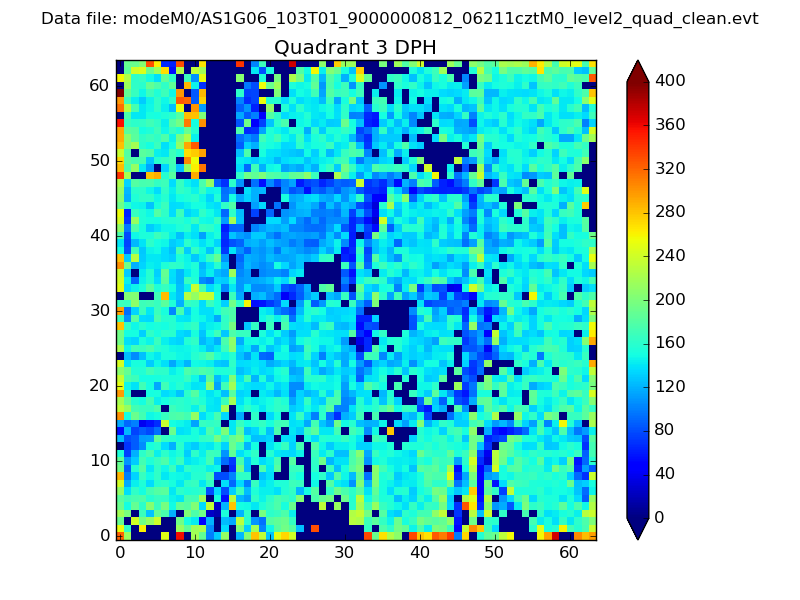 |
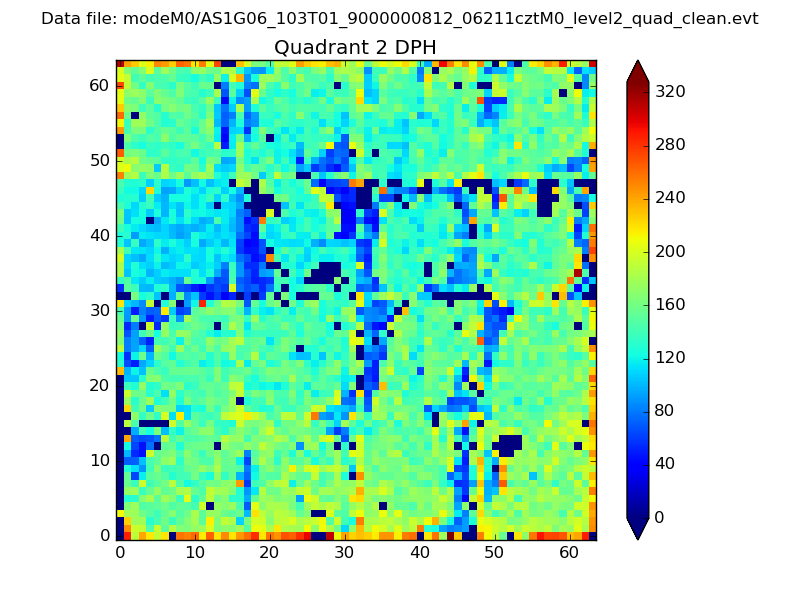 |
Quadrant C |
| Plot type | Count rate plots | Images |
|---|---|---|
| Comparison with Poisson distribution Blue bars denote a histogram of data divided into 1 sec bins. Red curve is a Poisson curve with rate = median count rate of data. |
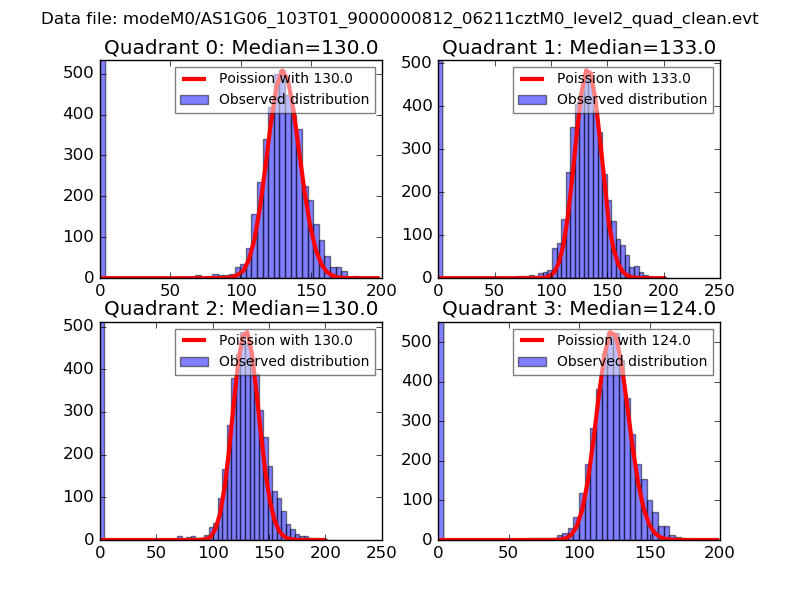 |
 |
| Quadrant-wise count rates Data is divided into 100 sec bins |
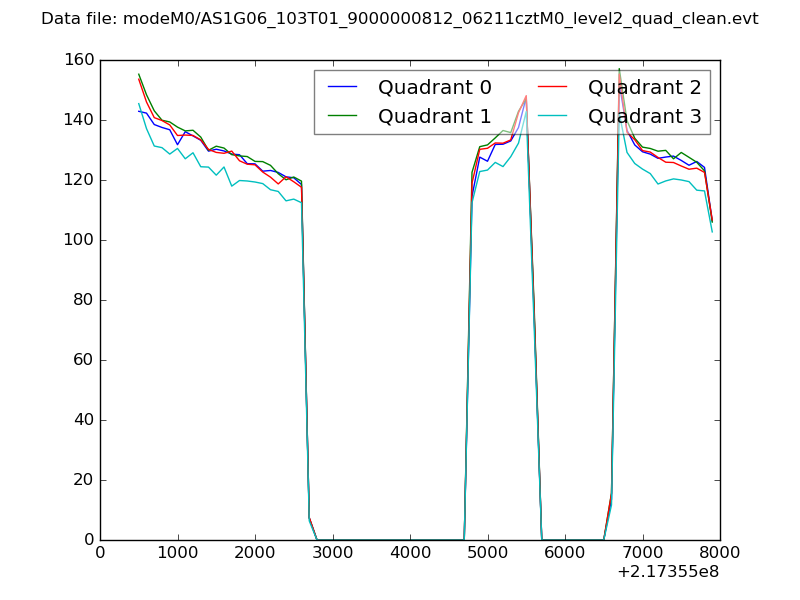 |
|
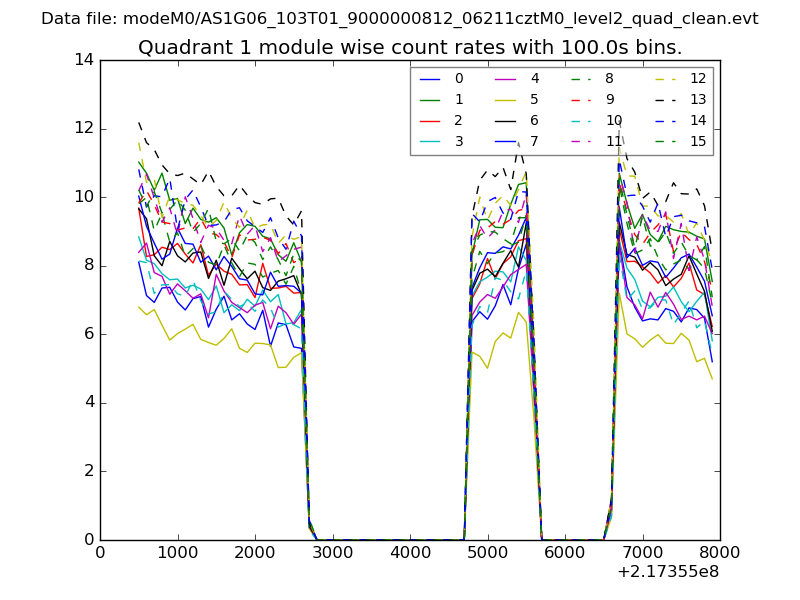
| Module-wise count rates for Quadrant A Data is divided into 100 sec bins |
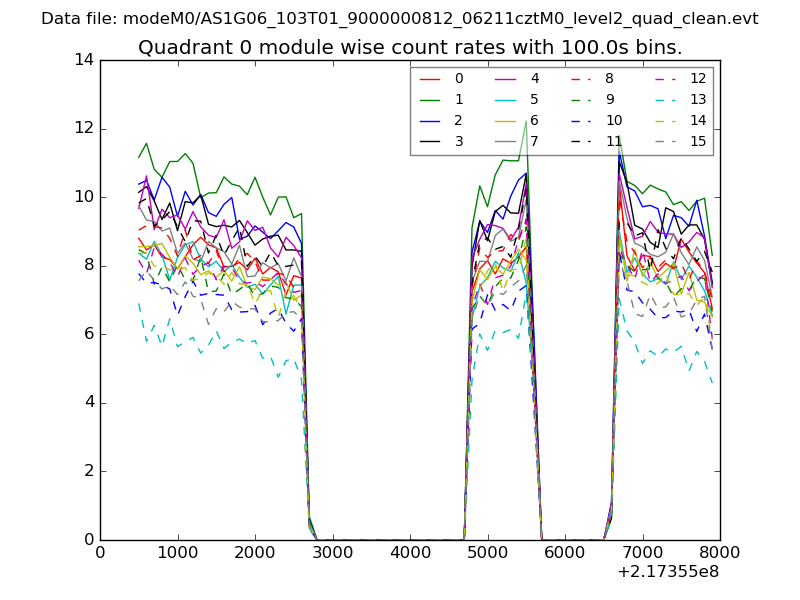 |
 |
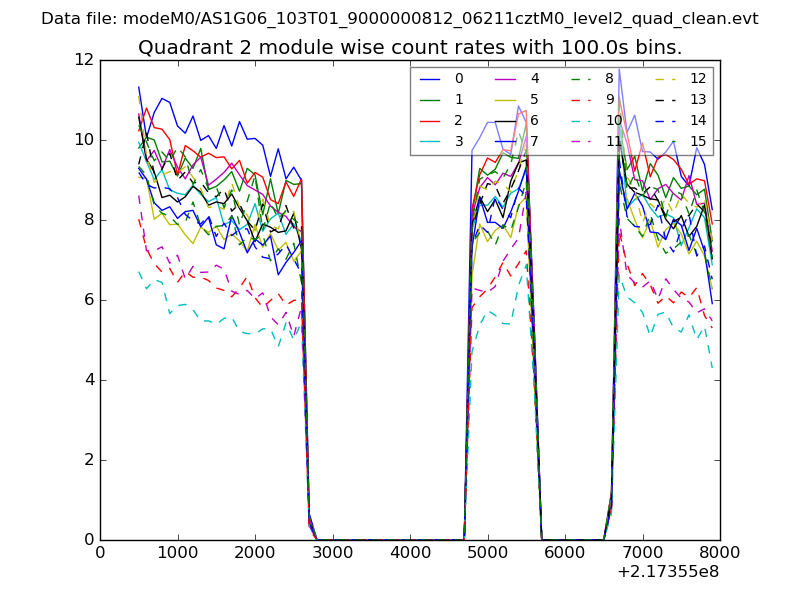
| Module-wise count rates for Quadrant B Data is divided into 100 sec bins |
 |
 |
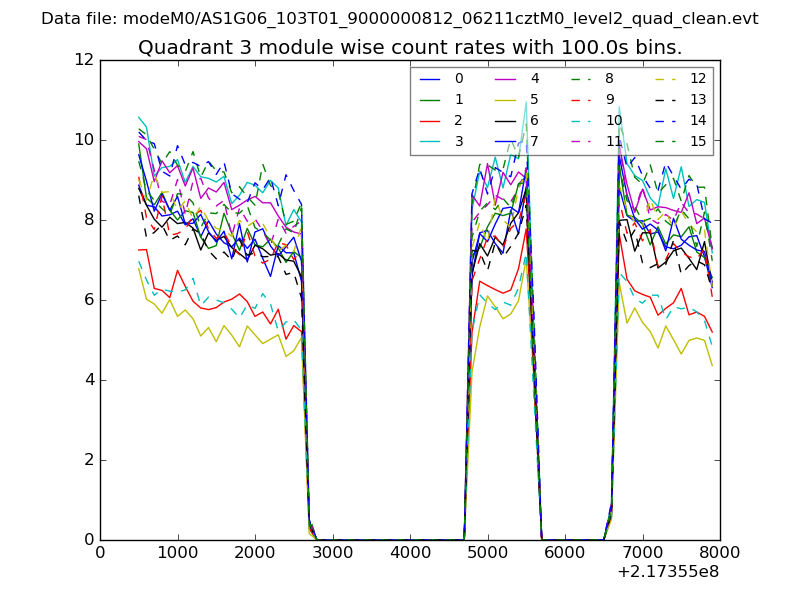
| Module-wise count rates for Quadrant C Data is divided into 100 sec bins |
 |
 |
| Module-wise count rates for Quadrant D Data is divided into 100 sec bins |
 |
 |
| Parameter | Plot |
|---|---|
| CZT HV Monitor | 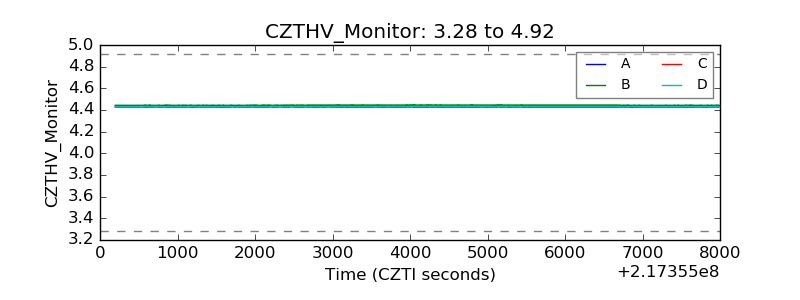 |
| D_VDD | 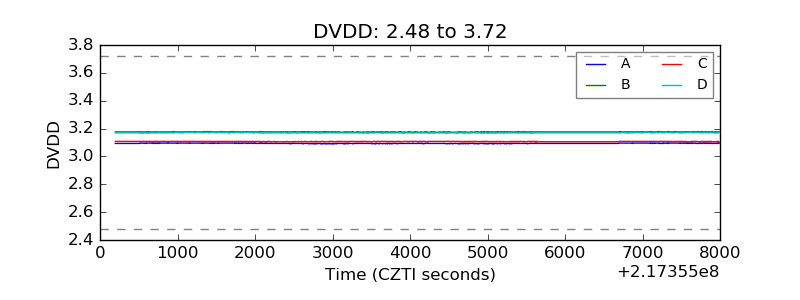 |
| Temperature 1 | 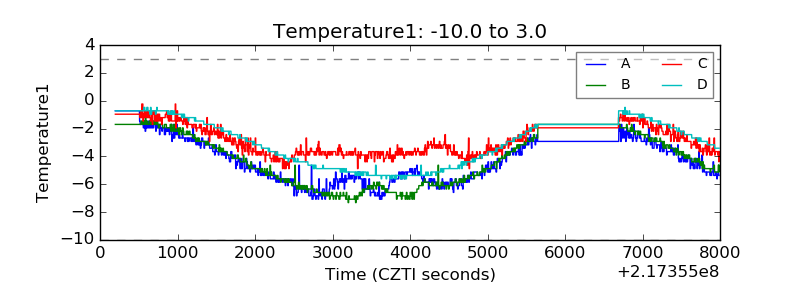 |
| Veto HV Monitor | 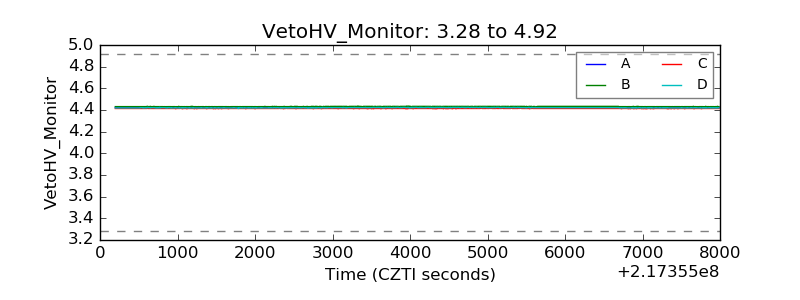 |
| Veto LLD | 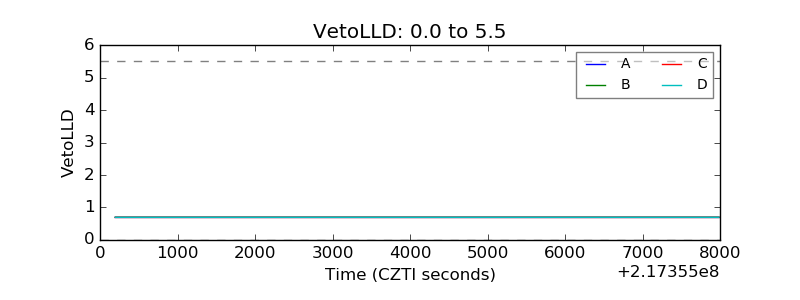 |
| Alpha Counter | 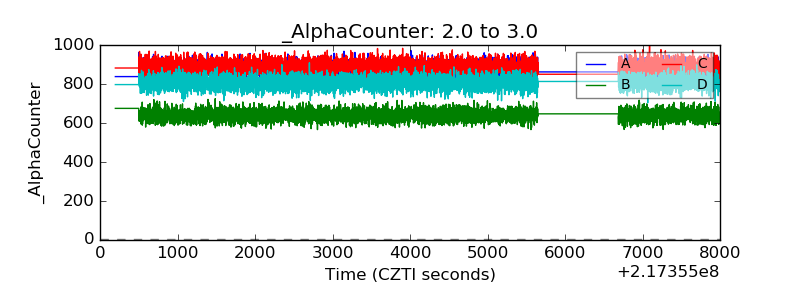 |
| _CPM_Rate | 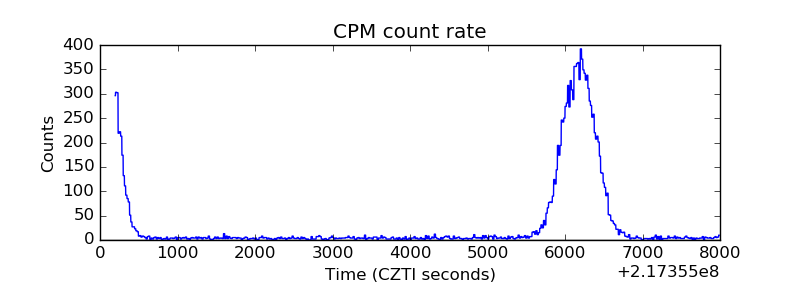 |
| CZT Counter |  |
| +2.5 Volts monitor |  |
| +5 Volts monitor |  |
| _ROLL_ROT | 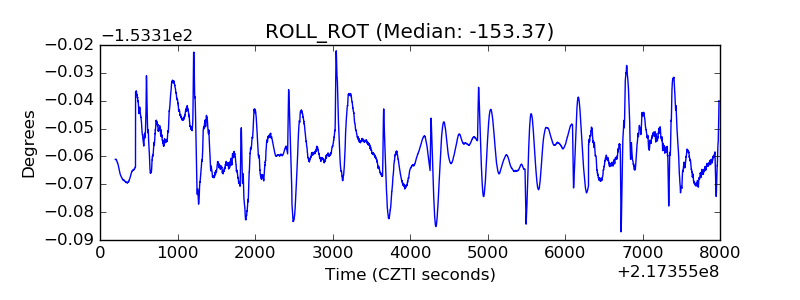 |
| _Roll_DEC | 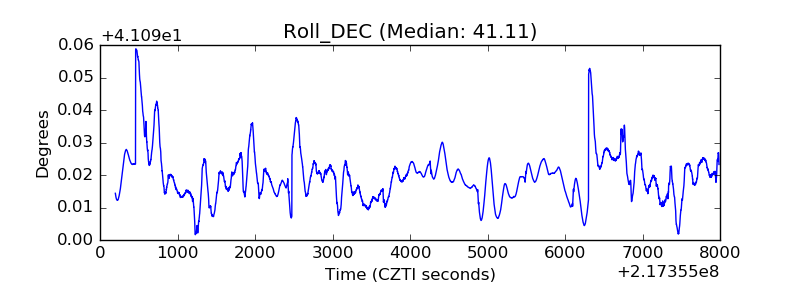 |
| _Roll_RA | 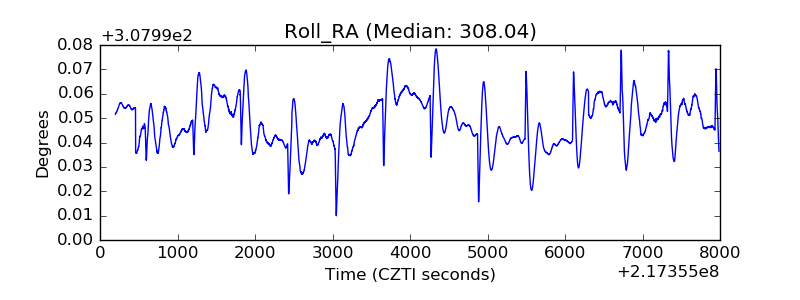 |
| Veto Counter |  |