| Param | Original file | Final file |
|---|---|---|
| Filename | modeM0/AS1G06_103T01_9000000812_06212cztM0_level2.evt | modeM0/AS1G06_103T01_9000000812_06212cztM0_level2_quad_clean.evt |
| Size (bytes) | 447,569,280 | 93,473,280 |
| Size | 426.8 MB | 89.1 MB |
| Events in quadrant A | 3,217,997 | 595,655 |
| Events in quadrant B | 3,364,446 | 601,609 |
| Events in quadrant C | 3,037,480 | 590,867 |
| Events in quadrant D | 3,468,754 | 564,890 |
| Mode SS | |||
|---|---|---|---|
| Quadrant | BADHDUFLAG | Total packets | Discarded packets |
| A | 0 | 140 | 0 |
| B | 0 | 140 | 0 |
| C | 0 | 140 | 0 |
| D | 0 | 140 | 0 |
| Mode M9 | |||
|---|---|---|---|
| Quadrant | BADHDUFLAG | Total packets | Discarded packets |
| A | 0 | 8 | 0 |
| B | 0 | 8 | 0 |
| C | 0 | 8 | 0 |
| D | 0 | 8 | 0 |
| Mode M0 | |||
|---|---|---|---|
| Quadrant | BADHDUFLAG | Total packets | Discarded packets |
| A | 0 | 14089 | 2 |
| B | 0 | 14614 | 1 |
| C | 0 | 13901 | 1 |
| D | 0 | 15055 | 1 |
| Quadrant | Total seconds | Saturated seconds | Saturation percentage |
|---|---|---|---|
| A | 6852 | 10 | 0.145943% |
| B | 6852 | 67 | 0.977817% |
| C | 6852 | 9 | 0.131349% |
| D | 6852 | 20 | 0.291886% |
Noise dominated data is calculated using 1-second bins in cleaned event files. If a bin has >2000 counts, and if more than 50% of those come from <1% of pixels, then it is considered to be noise-dominated and hence unusable.
| Quadrant | # 1 sec bins | Bins with >0 counts | Bins with >2000 counts | High rate bins dominated by noise | Noise dominated (total time) | Noise dominated (detector-on time) | Marked lightcurve |
|---|---|---|---|---|---|---|---|
| A | 7647 | 6853 | 1 | 1 | 0.01% | 0.01% | 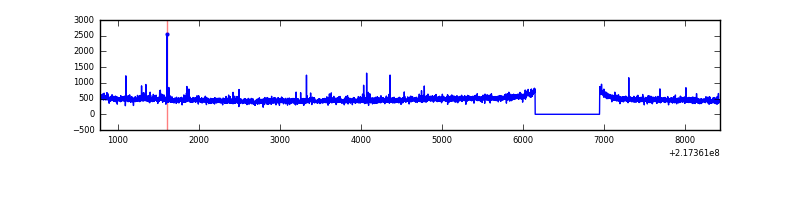 |
| B | 7647 | 6853 | 22 | 22 | 0.29% | 0.32% | 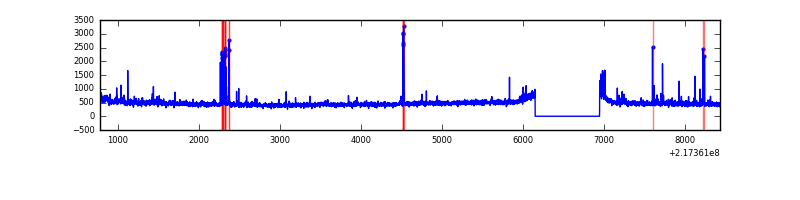 |
| C | 7647 | 6853 | 0 | 0 | 0.00% | 0.00% | 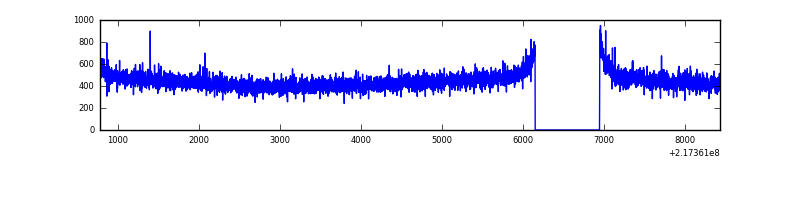 |
| D | 7647 | 6853 | 11 | 11 | 0.14% | 0.16% | 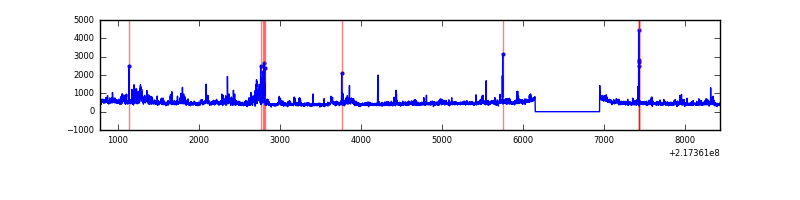 |
Top three noisy pixels from each quadrant. If the there are fewer than three noisy pixels in the level2.evt file, extra rows are filled as -1
| Pixel properties | Quadrant properties | ||||||
|---|---|---|---|---|---|---|---|
| Quadrant | DetID | PixID | Counts | Sigma | Mean | Median | Sigma |
| A | 8 | 15 | 178305 | 1099.14 | 789 | 770 | 161.5 |
| A | 12 | 194 | 7692 | 42.85 | 789 | 770 | 161.5 |
| A | 0 | 226 | 7530 | 41.85 | 789 | 770 | 161.5 |
| B | 0 | 219 | 144373 | 947.34 | 796 | 777 | 151.6 |
| B | 0 | 214 | 48496 | 314.81 | 796 | 777 | 151.6 |
| B | 15 | 204 | 34568 | 222.93 | 796 | 777 | 151.6 |
| C | 1 | 16 | 27697 | 150.3 | 770 | 773 | 179.1 |
| C | 13 | 61 | 6011 | 29.24 | 770 | 773 | 179.1 |
| C | 9 | 54 | 2754 | 11.06 | 770 | 773 | 179.1 |
| D | 2 | 63 | 229186 | 1206.92 | 770 | 745 | 189.3 |
| D | 2 | 136 | 132568 | 696.46 | 770 | 745 | 189.3 |
| D | 2 | 14 | 104407 | 547.67 | 770 | 745 | 189.3 |
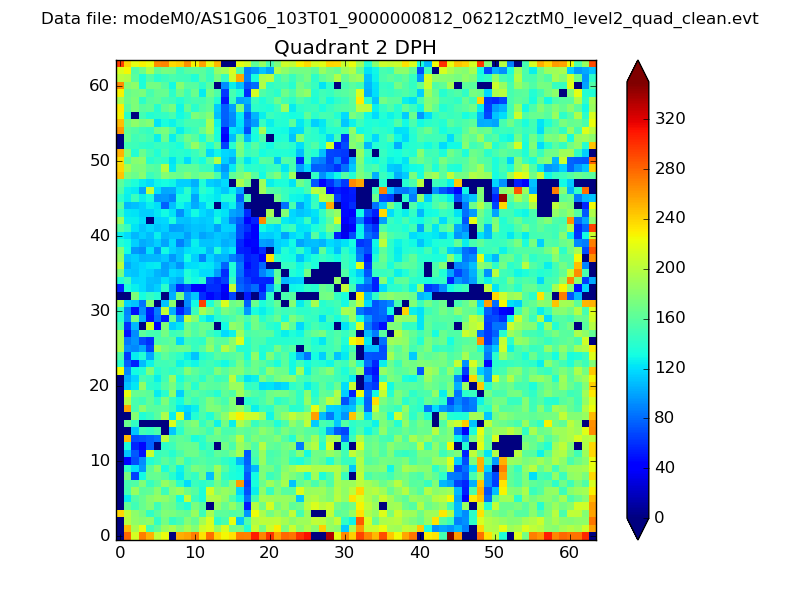
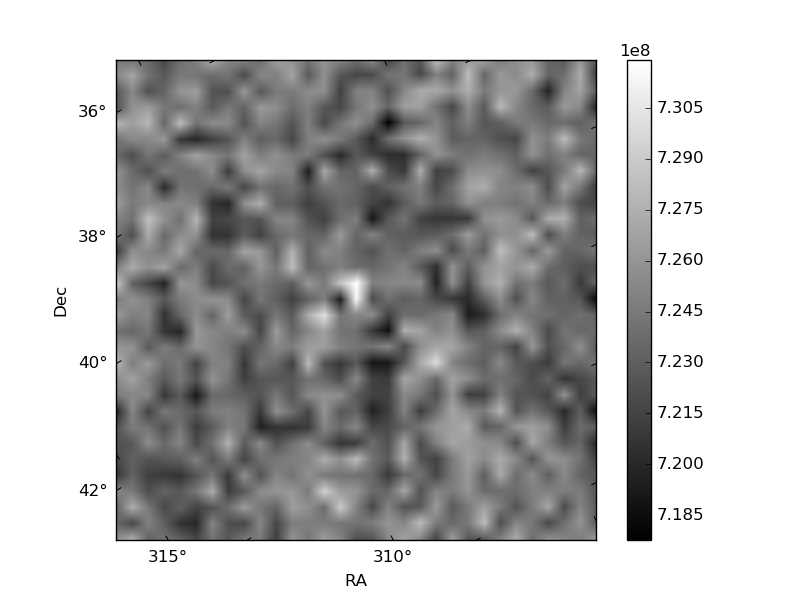
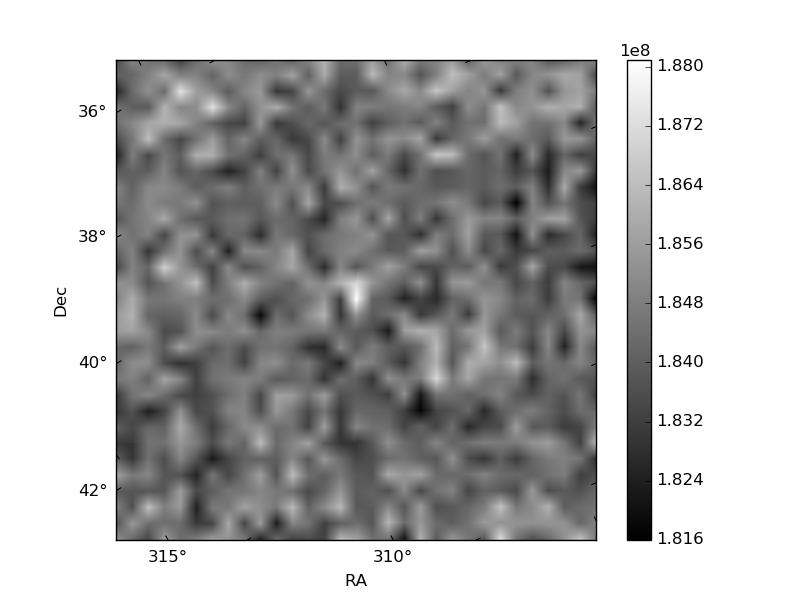
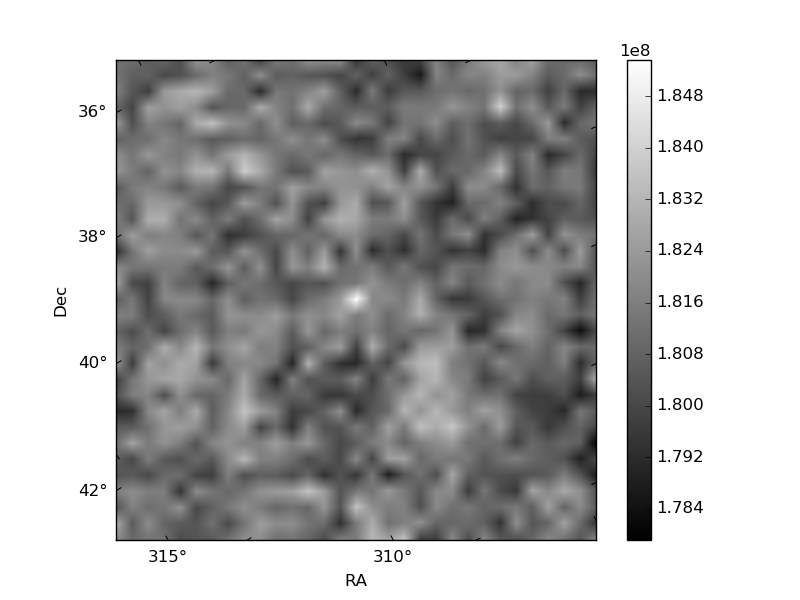
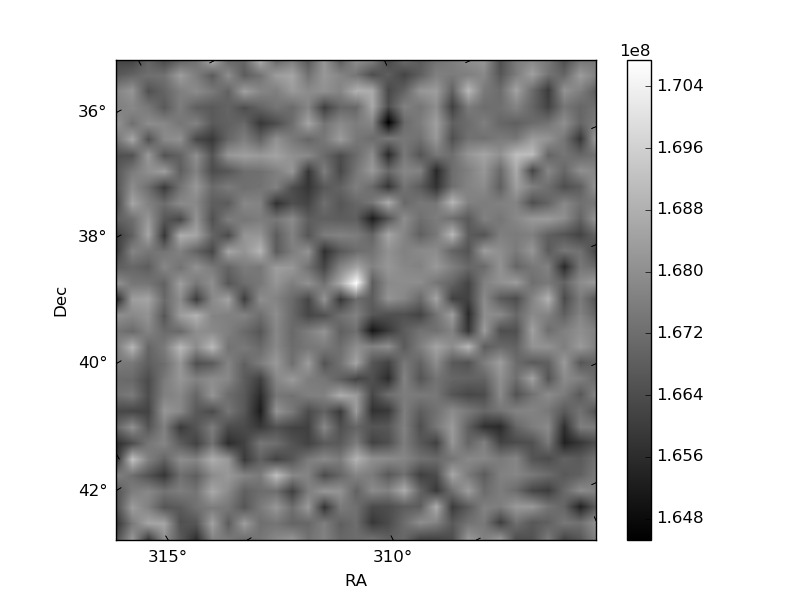
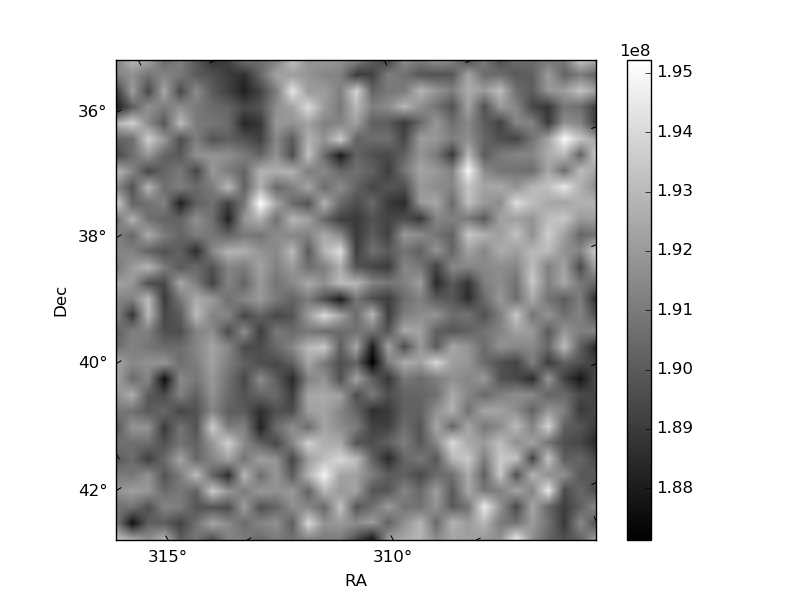
Histogram calculated using DETX and DETY for each event in the final _common_clean file
| Quadrant A | 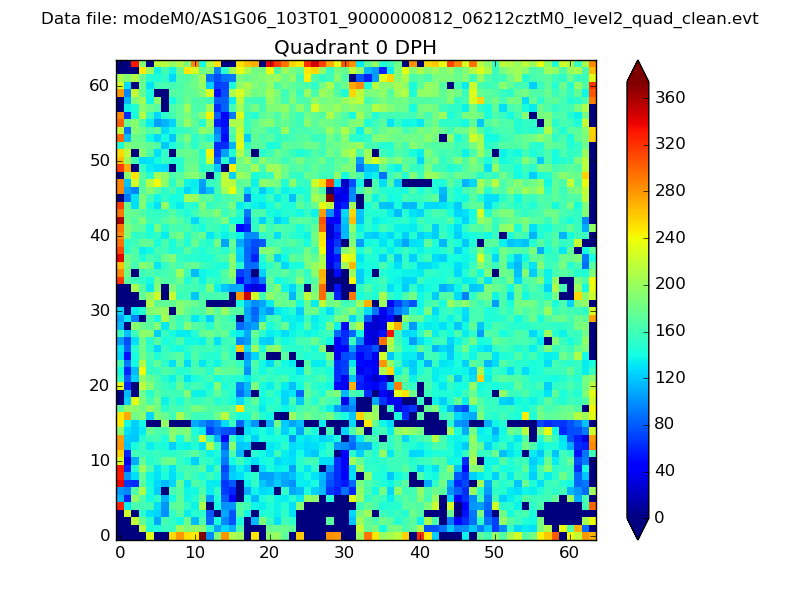 |
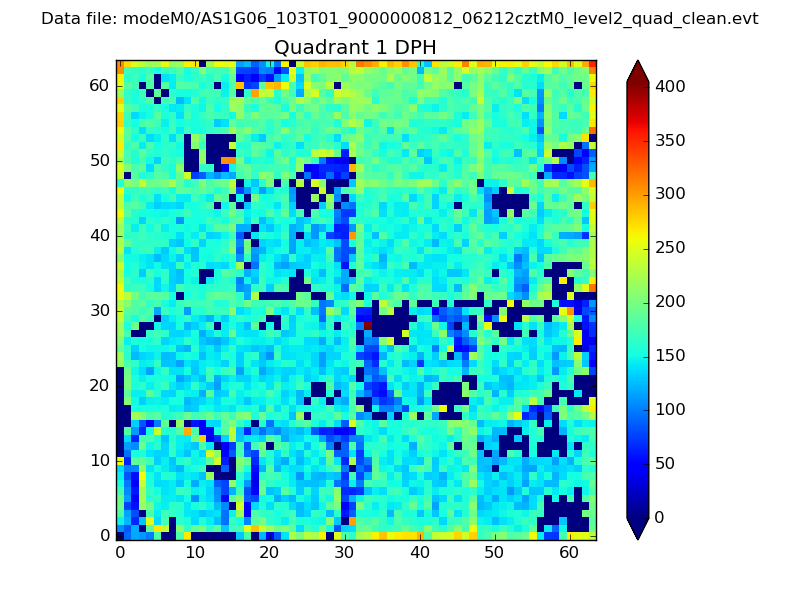 |
Quadrant B |
|---|---|---|---|
| Quadrant D | 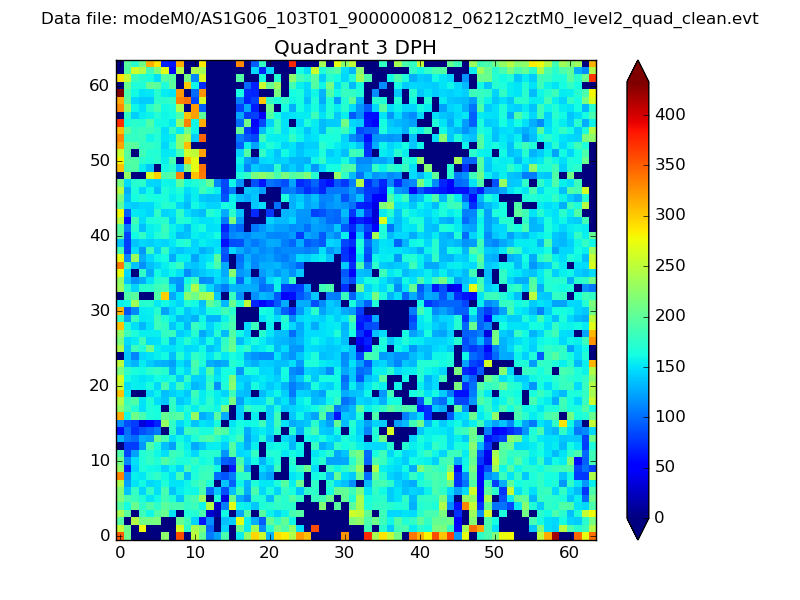 |
 |
Quadrant C |
| Plot type | Count rate plots | Images |
|---|---|---|
| Comparison with Poisson distribution Blue bars denote a histogram of data divided into 1 sec bins. Red curve is a Poisson curve with rate = median count rate of data. |
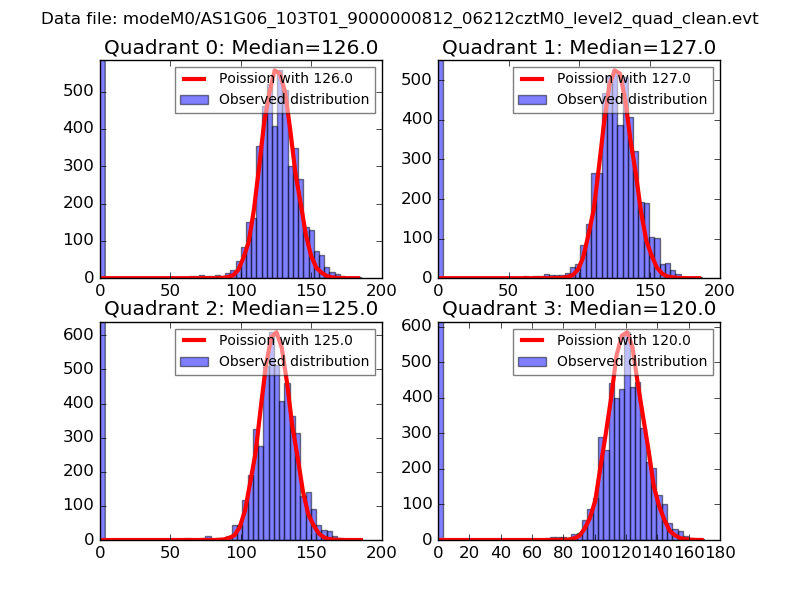 |
 |
| Quadrant-wise count rates Data is divided into 100 sec bins |
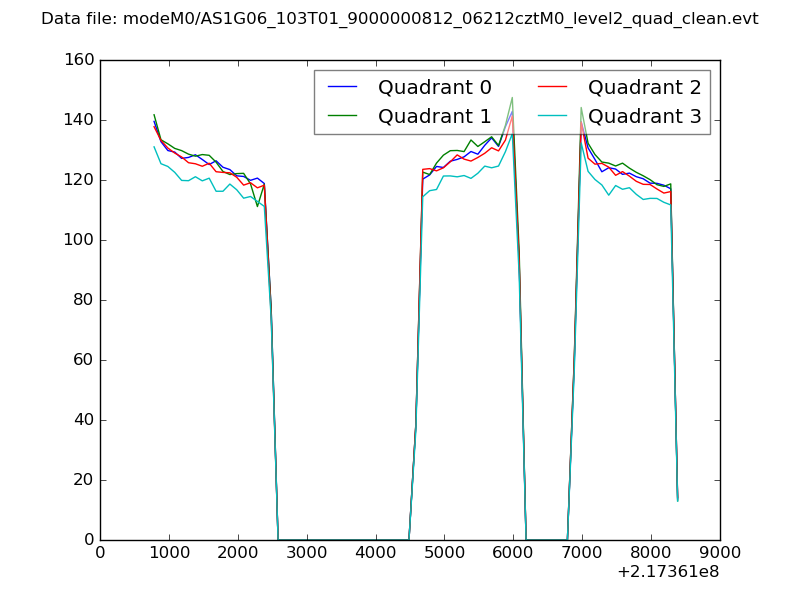 |
|
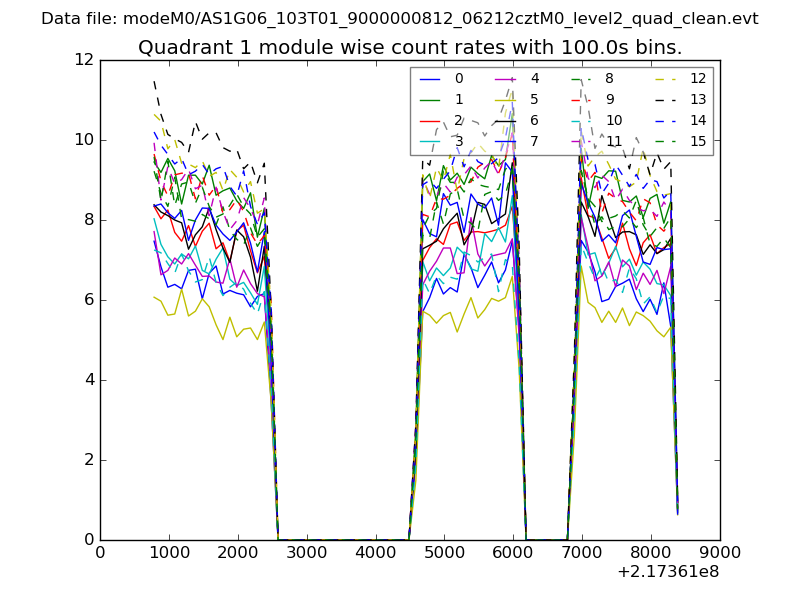
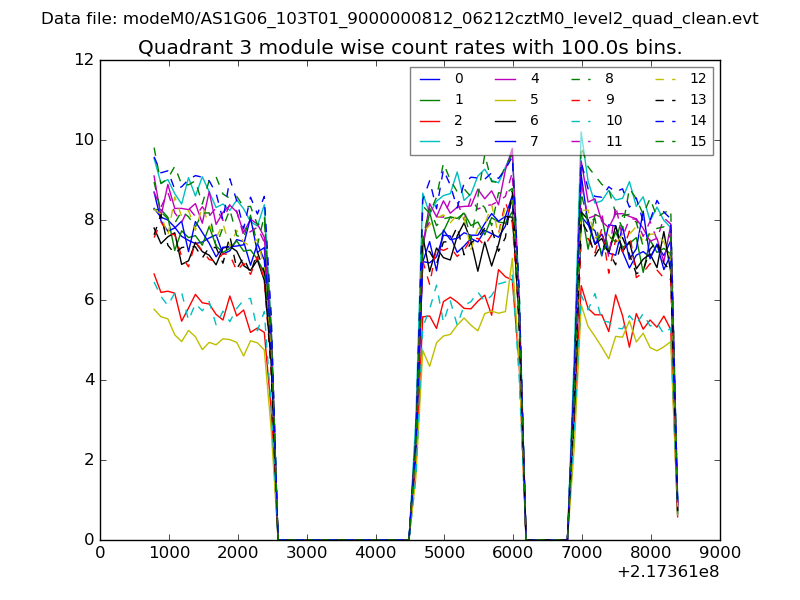
| Module-wise count rates for Quadrant A Data is divided into 100 sec bins |
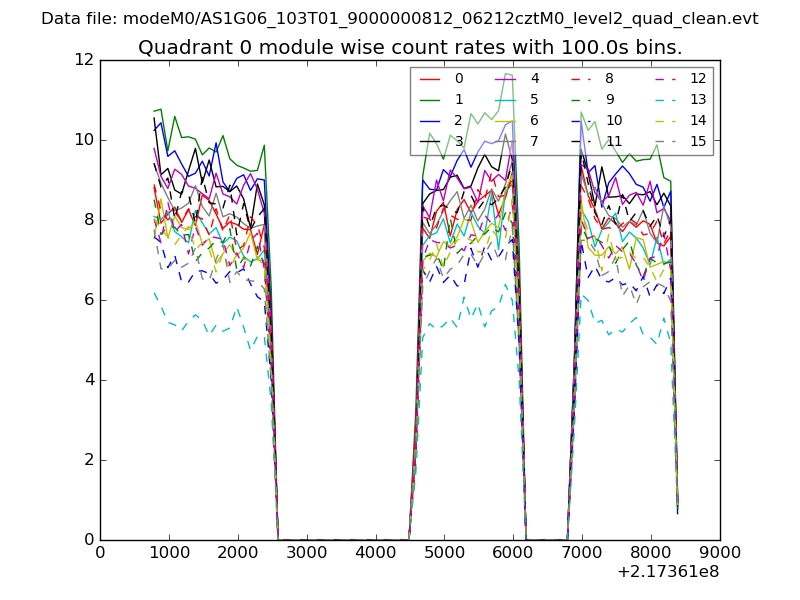 |
 |
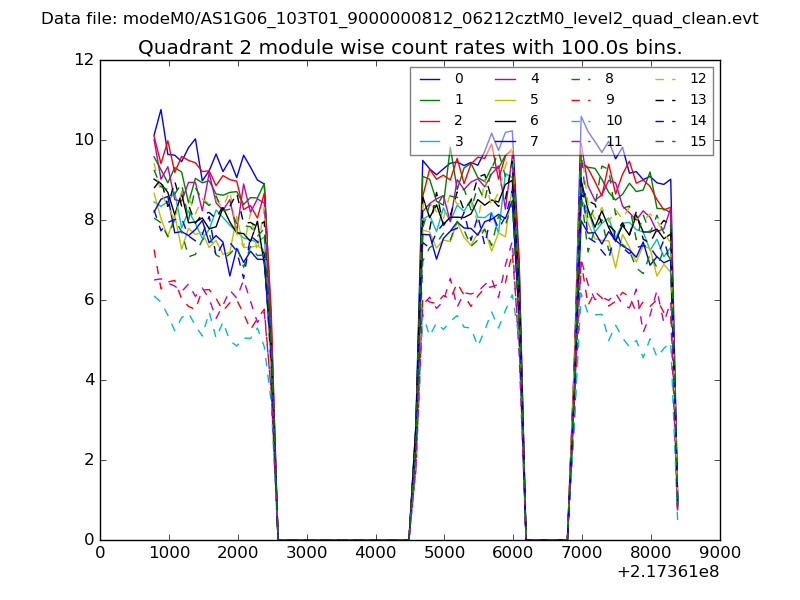
| Module-wise count rates for Quadrant B Data is divided into 100 sec bins |
 |
 |
| Module-wise count rates for Quadrant C Data is divided into 100 sec bins |
 |
 |
| Module-wise count rates for Quadrant D Data is divided into 100 sec bins |
 |
 |
| Parameter | Plot |
|---|---|
| CZT HV Monitor | 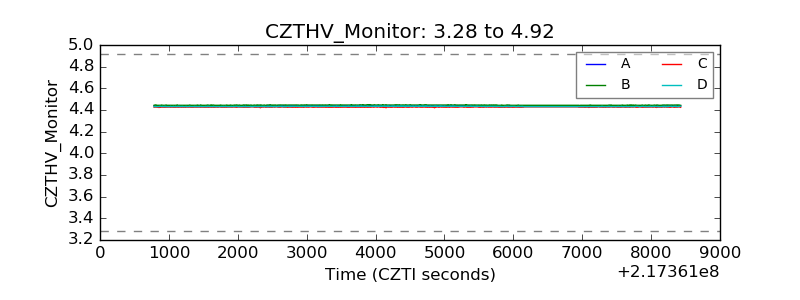 |
| D_VDD | 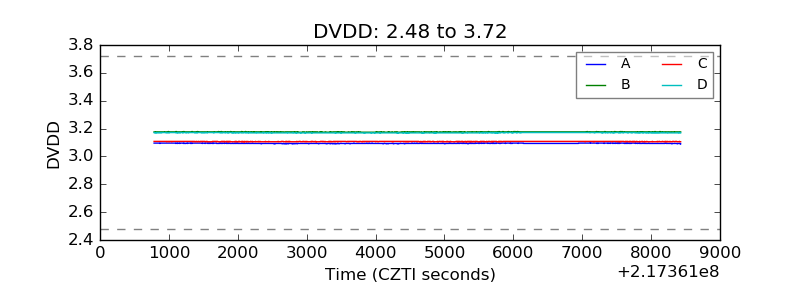 |
| Temperature 1 | 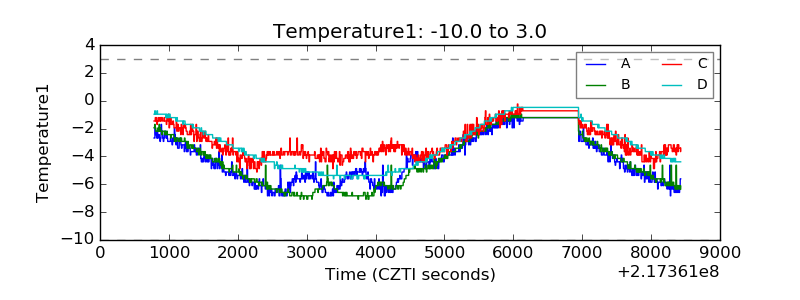 |
| Veto HV Monitor | 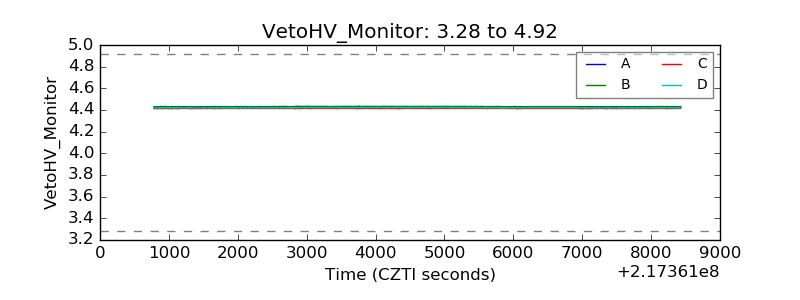 |
| Veto LLD | 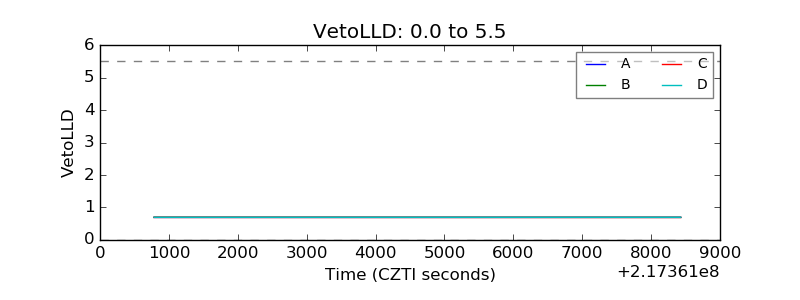 |
| Alpha Counter | 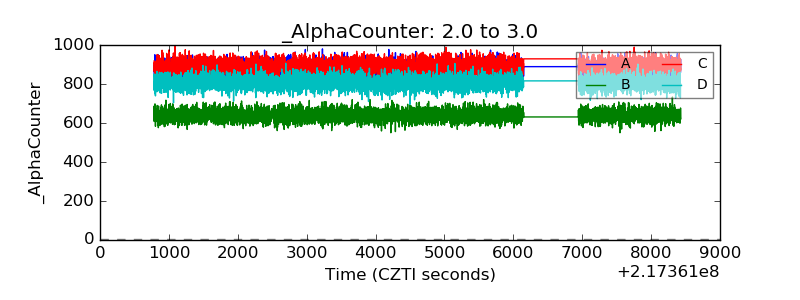 |
| _CPM_Rate | 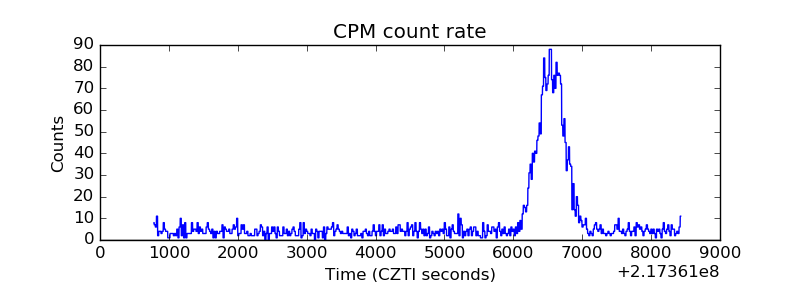 |
| CZT Counter | 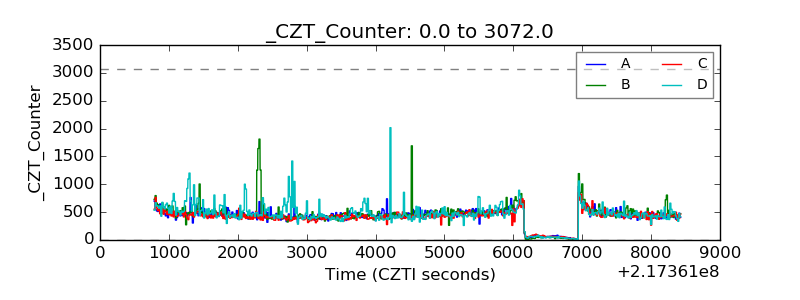 |
| +2.5 Volts monitor | 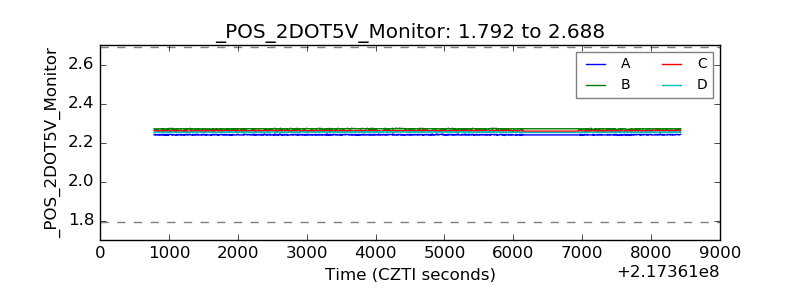 |
| +5 Volts monitor | 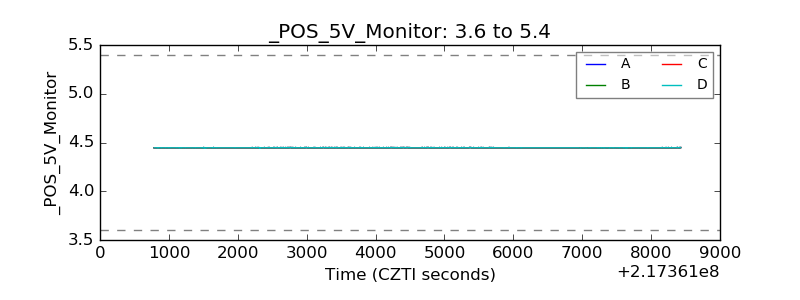 |
| _ROLL_ROT | 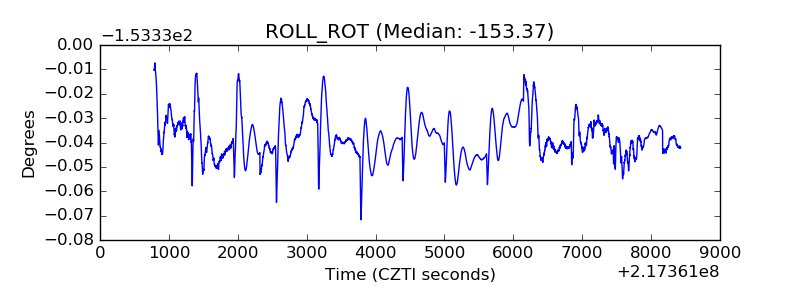 |
| _Roll_DEC | 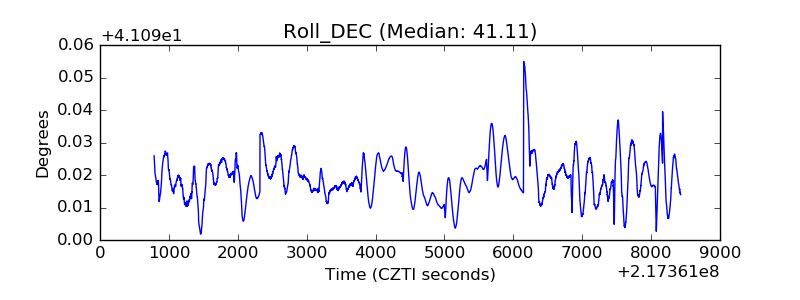 |
| _Roll_RA | 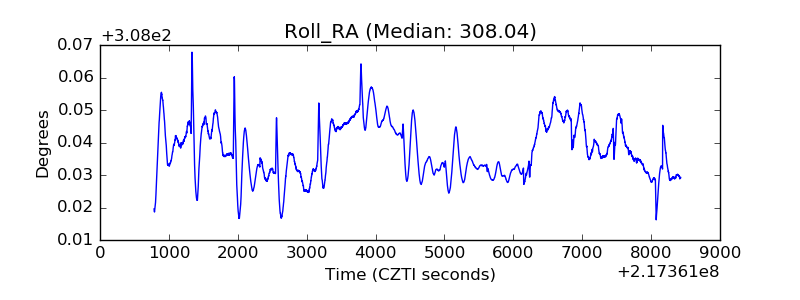 |
| Veto Counter | 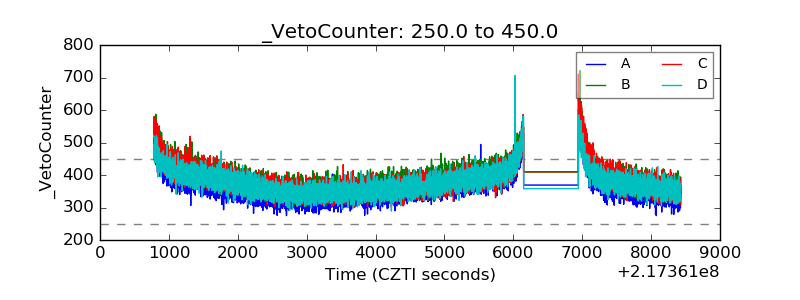 |